Global foreign exchange markets are subject to a wide range of macroeconomic influences. The sheer breadth of related information and required analyses often prevent their systematic use in trading. However, modern macro-quantamental scorecards can condense ample point-in-time macroeconomic data into thematic scores for easy systematic visualization and empirical evaluation.
This post demonstrates how to create structured macro-quantamental scorecards for FX forward trading in Python. It uses indicators related to economic growth differentials, monetary policy divergences, external balances, valuation metrics, and price competitiveness. Resulting scorecards provide point-in-time snapshots of macroeconomic conditions across all liquid currencies. They also summarize historical and thematic perspectives. Empirical analysis highlights the predictive power and trading value of macro-quantamental scores.
A Jupyter notebook that shows how to build the discussed scorecard in Python can be downloaded here. The notebook operation requires access to J.P. Morgan DataQuery to download data from JPMaQS. Everyone with DataQuery access can download data, except for the latest months. Moreover, J.P. Morgan offers free trials on the complete dataset for institutional clients. An academic support program sponsors data sets for research projects.
Macro-quantamental scorecards: a systematic information overlay
A macro-quantamental scorecard is a condensed presentation of macroeconomic information that has predictive power for specific financial contract returns. It is suitable for enhancing the information efficiency of discretionary management by adding a systematic layer, i.e., the optional inclusion of structured and rules-based information and guidance. The predictive power and economic value of such guidance are quantifiable based on historical analysis and backtests. Macro-quantamental scorecards can also be intermediate steps for integrating macro information into systematic trading.
Scorecards must be based on quantamental indicators, i.e., point-in-time information states of standard macroeconomic indicators. Point-in-time means that for each day in the past, the indicator is calculated based on the concurrent latest “vintages” of all underlying time series. The primary source for macro-quantamental indicators is the J.P. Morgan Macrosynergy Quantamental System (JPMaQS), which provides free (limited) access, full-scale trials, and complimentary academic research support.
Financial contracts are typically exposed to a broad range of macroeconomic forces, many of which are subtle and interrelated. To make such a wide array of information states manageable, macro-quantamental scorecards typically implement a conceptual hierarchy that condenses low-level macro-quantamental scores logically into more general and abstract concepts and themes:
- Macro-quantamental scores are normalized values of economic indicators relative to their (theoretical or empirical) neutral levels, with standard deviations based on a group of similar countries up to the concurrent point in time.
- Conceptual factor scores are sequentially re-normalized combinations of macro-quantamental scores that measure similar economic concepts, such as economic growth, inflation or external balances.
- Thematic factor scores are sequentially re-normalized combinations of conceptual factors that group concepts into broader themes, such as external vulnerability or price competitiveness of currency area. A glance at thematic factor scores is often sufficient to inform investment decisions intelligently, but the structured combination also allows drilling down to the concepts and indicators when required.
Structured macro-quantamental scorecards that are based on point-in-time information states have two great benefits:
- They allow continuous, efficient reviews of a wide array of economic indicators for asset management. Standard financial research and news media cannot match scorecards’ broad and systematic perspectives.
- One can validate conceptual and thematic factor scores through empirical tests. This means one can test if macro-quantamental scores jointly or individually displayed significant predictive power and if one would have generated material economic value by merely following the related signals. Empirical evidence is not always necessary for using a score, but it may be in contentious cases and also allows investment managers to learn from historical experience.
A macro-quantamental scorecard structure for global FX forward markets
A condensed systematic macro view is particularly useful for global FX management. That is because one can trade almost 30 currencies with flexible and liquid forward markets, and all underlying exchange rates are subject to a broad range of plausible macro factors.
For this example scorecard, we consider nine developed and 20 emerging market currency areas with local currency forwards trading against their base currencies, i.e., either the dollar or the euro:
- DM currencies: the Australian dollar (AUD), the Canadian dollar (CAD), the euro (EUR), the Japanese yen (JPY), and the New Zealand dollar (NZD), against the U.S. dollar; the Swiss franc (CHF), the Norwegian krone (NOK), and the Swedish krona (SEK), against the euro; and the British pound (GBP) against an equally weighted basket of dollar and euro.
- EM currencies: the Brazilian real (BRL), the Chilean peso (CLP), the Colombian peso (COP), the Indonesian rupiah (IDR), the Israeli shekel (ILS), the Indian rupee (INR), the Korean won (KRW), the Mexican peso (MXN), the Malaysian Ringgit (MYR), the Peruvian sol (PEN), the Philippine peso (PHP), the Thai baht (THB), the Taiwanese dollar (TWD) and the South African rand (ZAR), all against the U.S. dollar; the Czech koruna (CZK), the Hungarian forint (HUF), the Romanian leu (RON), and the Polish zloty (PLN), against the euro; and the Russian ruble (RUB) and Turkish lira (TRY) against an equally weighted basket of dollar and euro.
We blacklist currencies for the purpose of scoring and empirical analysis for periods when their forward markets have been illiquid, or the exchange rate has been pegged. This classification is based on the FX tradeability and flexibility indicators of JPMaQS (view documentation).
This post and the related Jupyter Notebook implement a nested structure with 4 broad thematic scores, which themselves are composed of 2-4 conceptual factor scores. Each conceptual factor score is calculated based on 2-5 macro-quantamental categories. The latter represent types of indicators conventionally followed by economists. All categories, factors and themes are backed by standard theory and are formulated such that their theoretical influence is positive for a long position of the currency of the reference area. The structure is based on common sense and published research. It only serves as an example. In practice, each trader and institution would adapt scorecards to their proprietary research, experience, and needs.
The below is an abbreviated structure of the scorecard. Please see the annex at the end of the post for all scores used up to the third level, with links to the documentation of the macro-quantamental indicators used.
Thematic factor 1: Relative economic activity
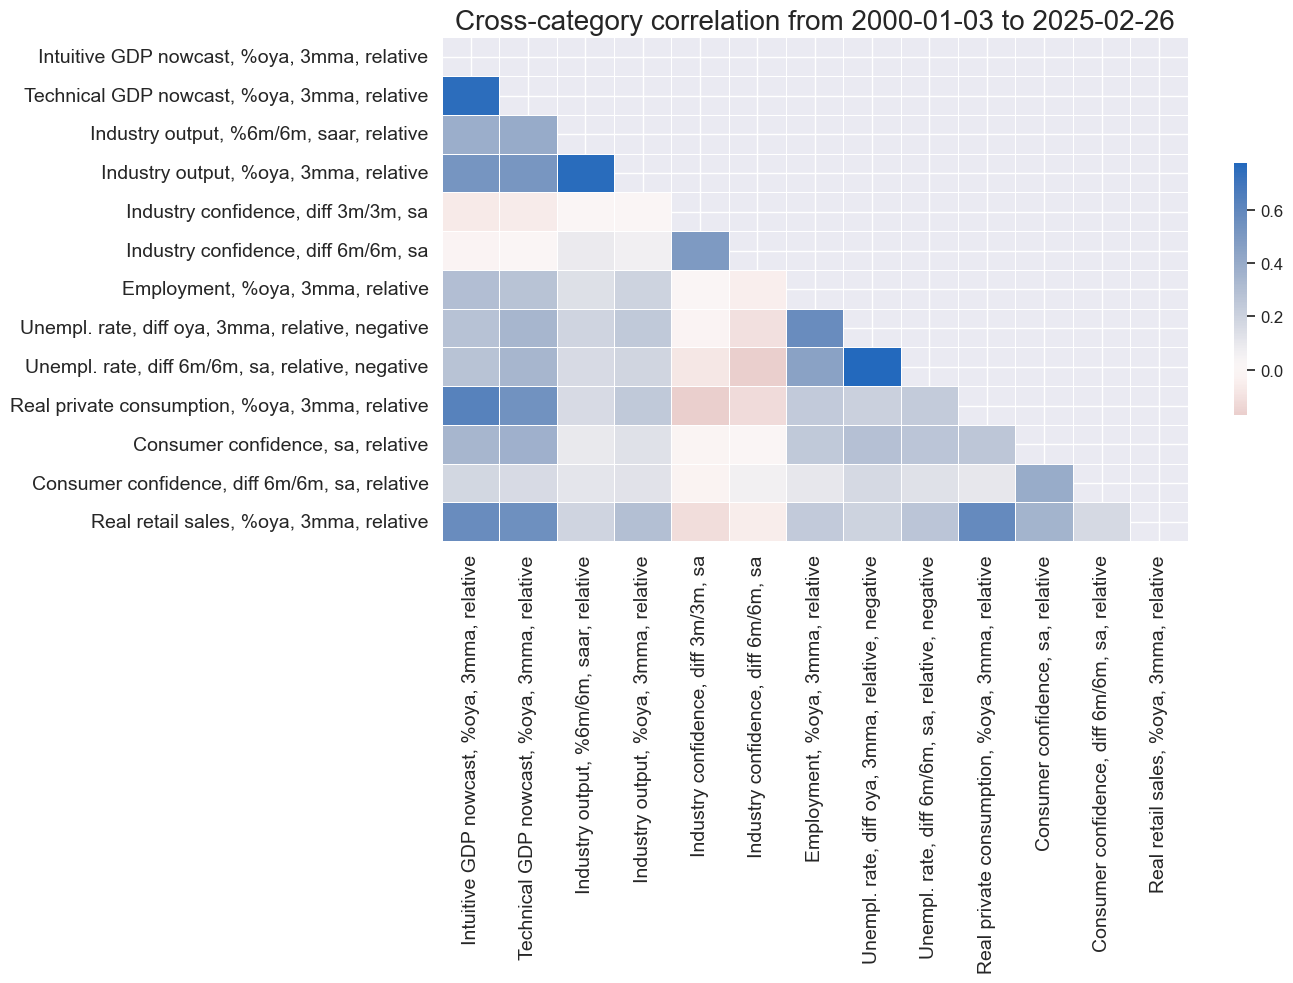
- Conceptual factor 1: Relative output growth.
Four macro-quantamental scores of nowcast GDP and industrial production growth relative to base currency area. - Conceptual factor 2: Manufacturing business confidence changes.
Two macro-quantamental scores of manufacturing business sentiment changes. - Conceptual factor 3: Relative labor market tightening.
Three macro-quantamental scores of labor market tightening relative to base currency area. - Conceptual factor 4: Relative private consumption growth.
Four macro-quantamental scores of real consumer spending and consumer confidence relative to base currency area.
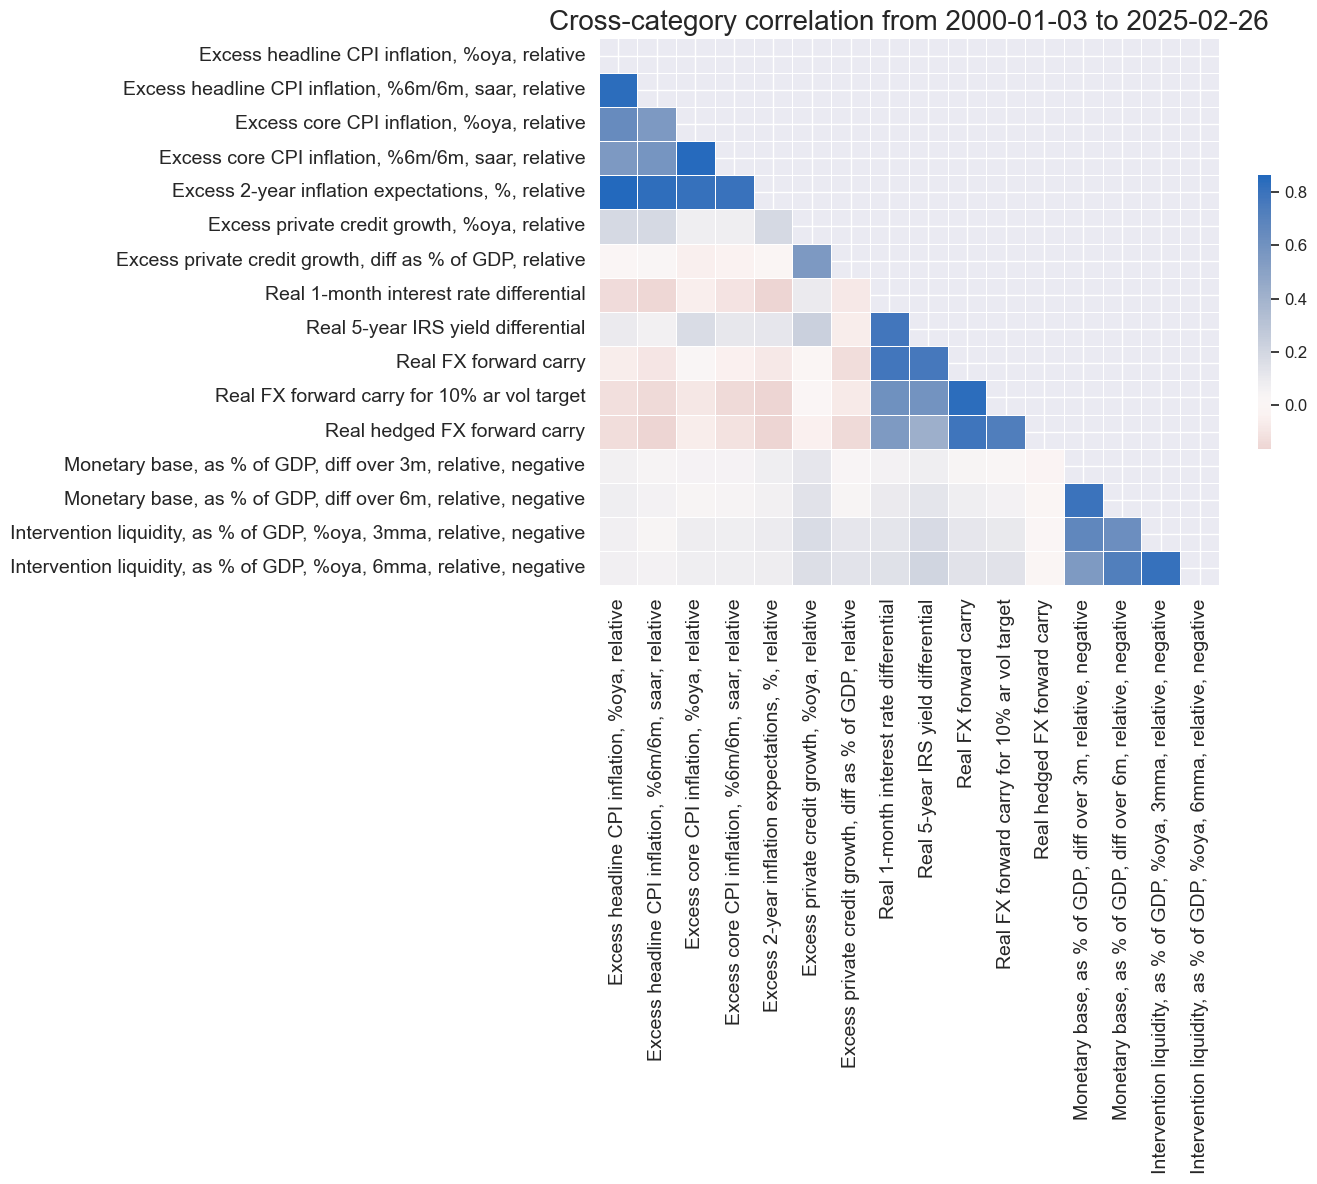
Thematic factor 2: Relative monetary policy tightening bias or tightness
- Conceptual factor 1: Relative excess inflation ratios.
Five macro-quantamental scores of CPI headline inflation, CPI core inflation, and inflation expectations in excess if the effective inflation target, normalized by target average, and relative to the base currency area. - Conceptual factor 2: Relative excess credit growth.
Two macro-quantamental scores of private credit growth in excess of the effective inflation target and relative to the base currency area. - Conceptual factor 3: Real rate differentials and carry.
Five macro-quantamental scores of real interest rate differentials and various types of real FX carry. - Conceptual factor 4: Relative liquidity tightening.
Four macro-quantamental scores of monetary base and intervention liquidity, relative to base currency area and negative.
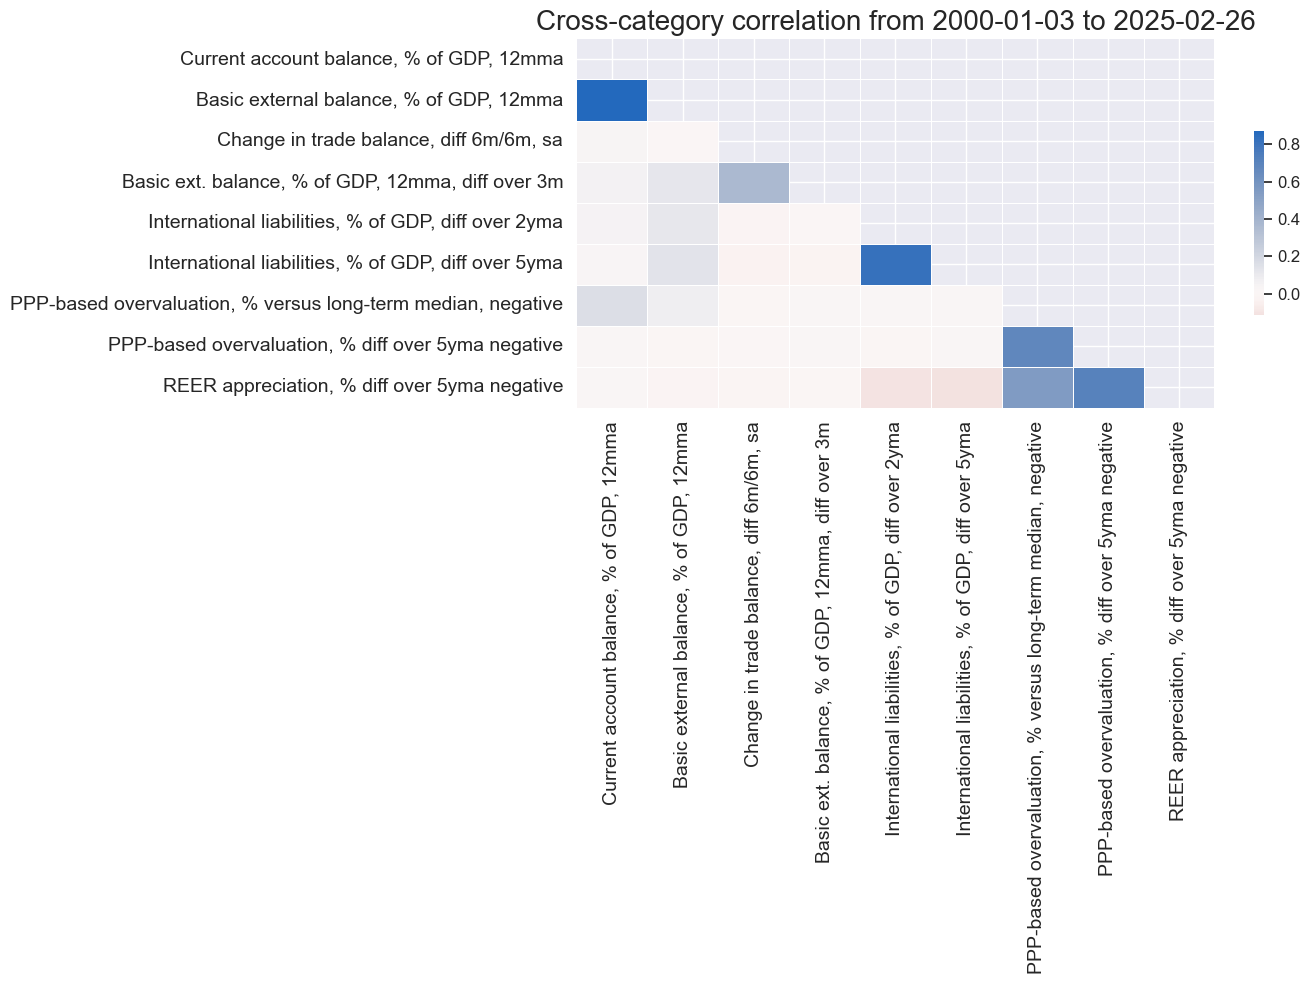
Thematic factor 3: External balances and valuation
- Conceptual factor 1: External balances ratios (and their changes).
Two macro-quantamental scores of external balance ratios and their dynamics. - Conceptual factor 2: External liabilities growth (negative).
Two macro-quantamental scores of medium-term accumulation of external liabilities as a ratio to GDP and negative. - Conceptual factor 3: FX overvaluation (negative).
Three macro-quantamental scores of medium-term depreciation based on purchasing power parity and real effective exchange rates.
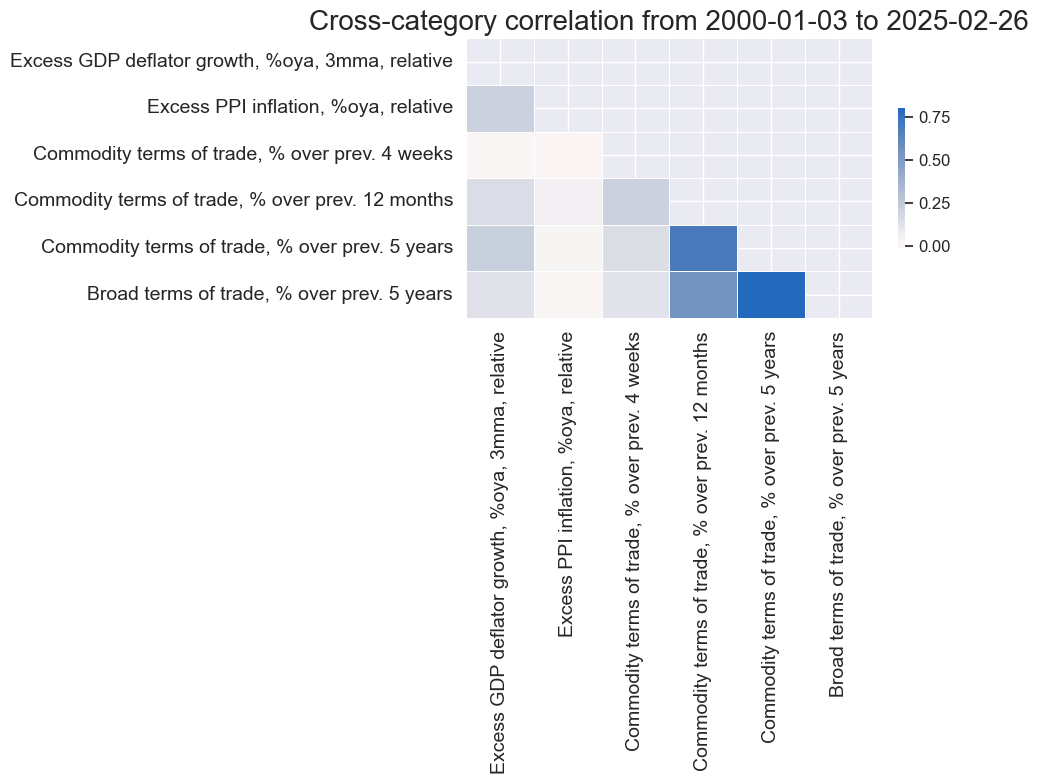
Thematic factor 4: Relative price competitiveness
- Conceptual factor 1: Relative excess producer price growth.
Two macro-quantamental scores of nowcast GDP deflator growth and industrial producer price growth in excess of the effective inflation target and relative to the base currency area. - Conceptual factor 2: Terms of trade improvement.
Four macro-quantamental indicators of commodity-based and broader terms of trade improvement.
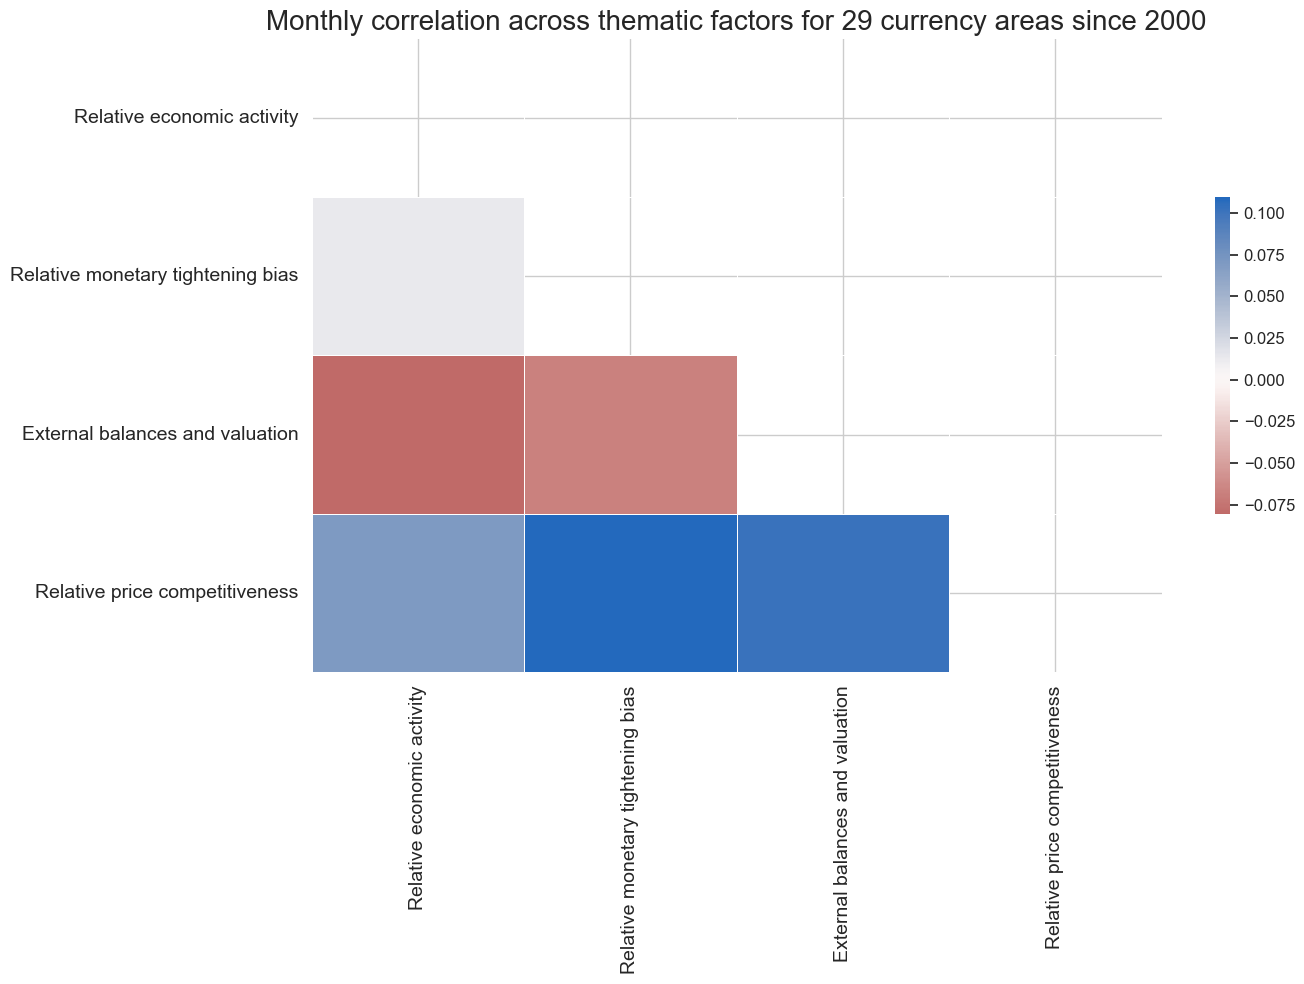
The thematic factor scores have a distinct and theoretically plausible correlation structure that reflects logical economic connections. Relative price competitiveness has been positively correlated with all other thematic scores. That is because high price growth for local products typically pushes up economic growth, inflation, and net exports. Meanwhile, there has been a negative correlation between relative activity performance and relative monetary policy tightening on the one side and external balances on the other. This reflects that exuberant domestic spending, due maybe to strong credit growth or expansionary fiscal policy, often comes at the expense of surging imports and deteriorating external balances.
Condensed snapshot and history
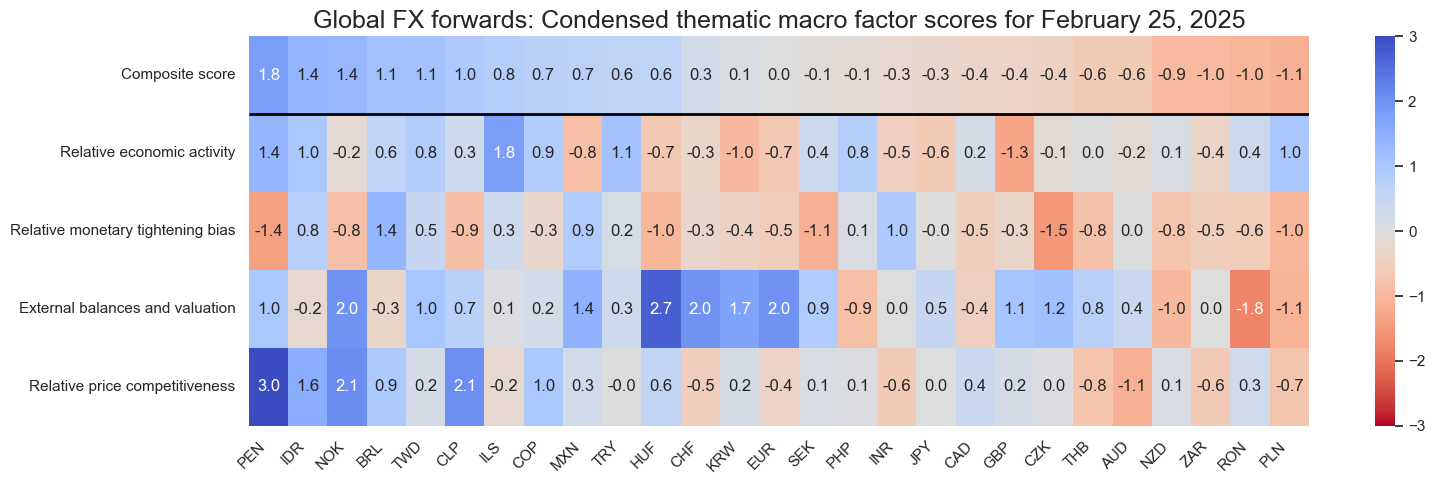
The most straightforward application of scorecard information is a point-in-time status of the thematic scores and a re-normalized equally weighted composite, as exemplified below. For the standard quantamental data format this can be easily implemented in Python by using the view_snapshot() method of the ScoreVisualisers class in the open-source Macrosynergy package.
This view can serve two purposes.
- Composite scores can be treated as a “default overlay” of positioning. Macro is not everything, but everything else being equal, a macro score is a good guidance for positioning across currencies. Put differently, it is a valid overlay to other positioning motives. The value of that simple approach is demonstrated in a simulated PnL below.
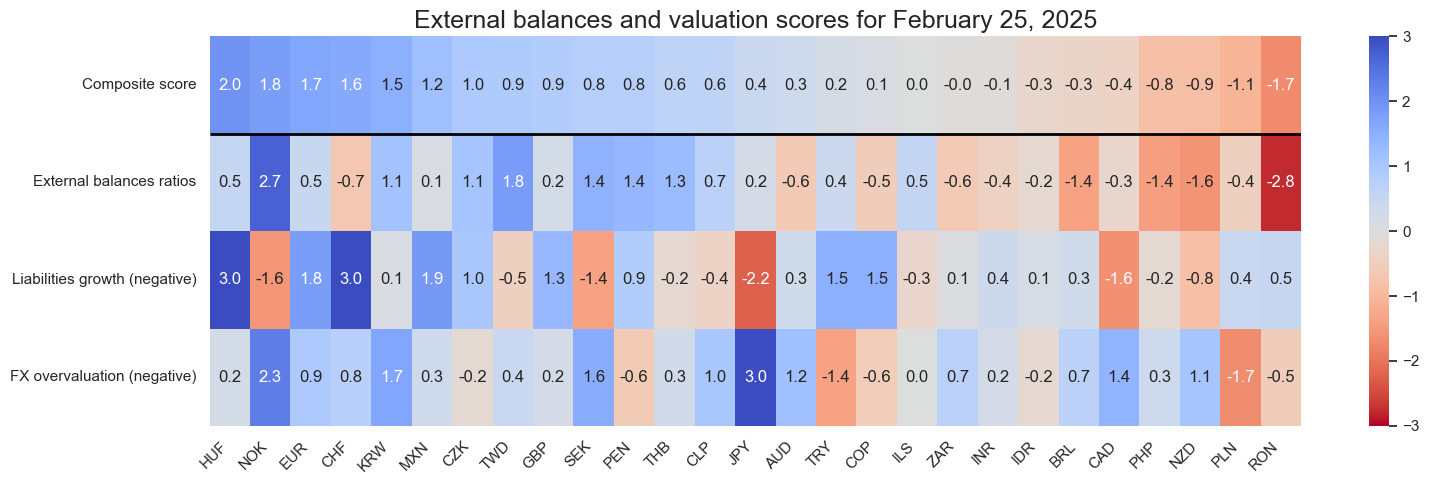
- A snapshot of macro scores makes it easy to compare quantitative macro facts with market perceptions and positions. At the end of February 2025, the strong scores for Peru, Indonesia, and Norway would make long positions more interesting if the market was negatively pre-disposed or positioned. Generally, scorecards are a sound basis for detecting disparities between dominant market narratives and quantitative facts.
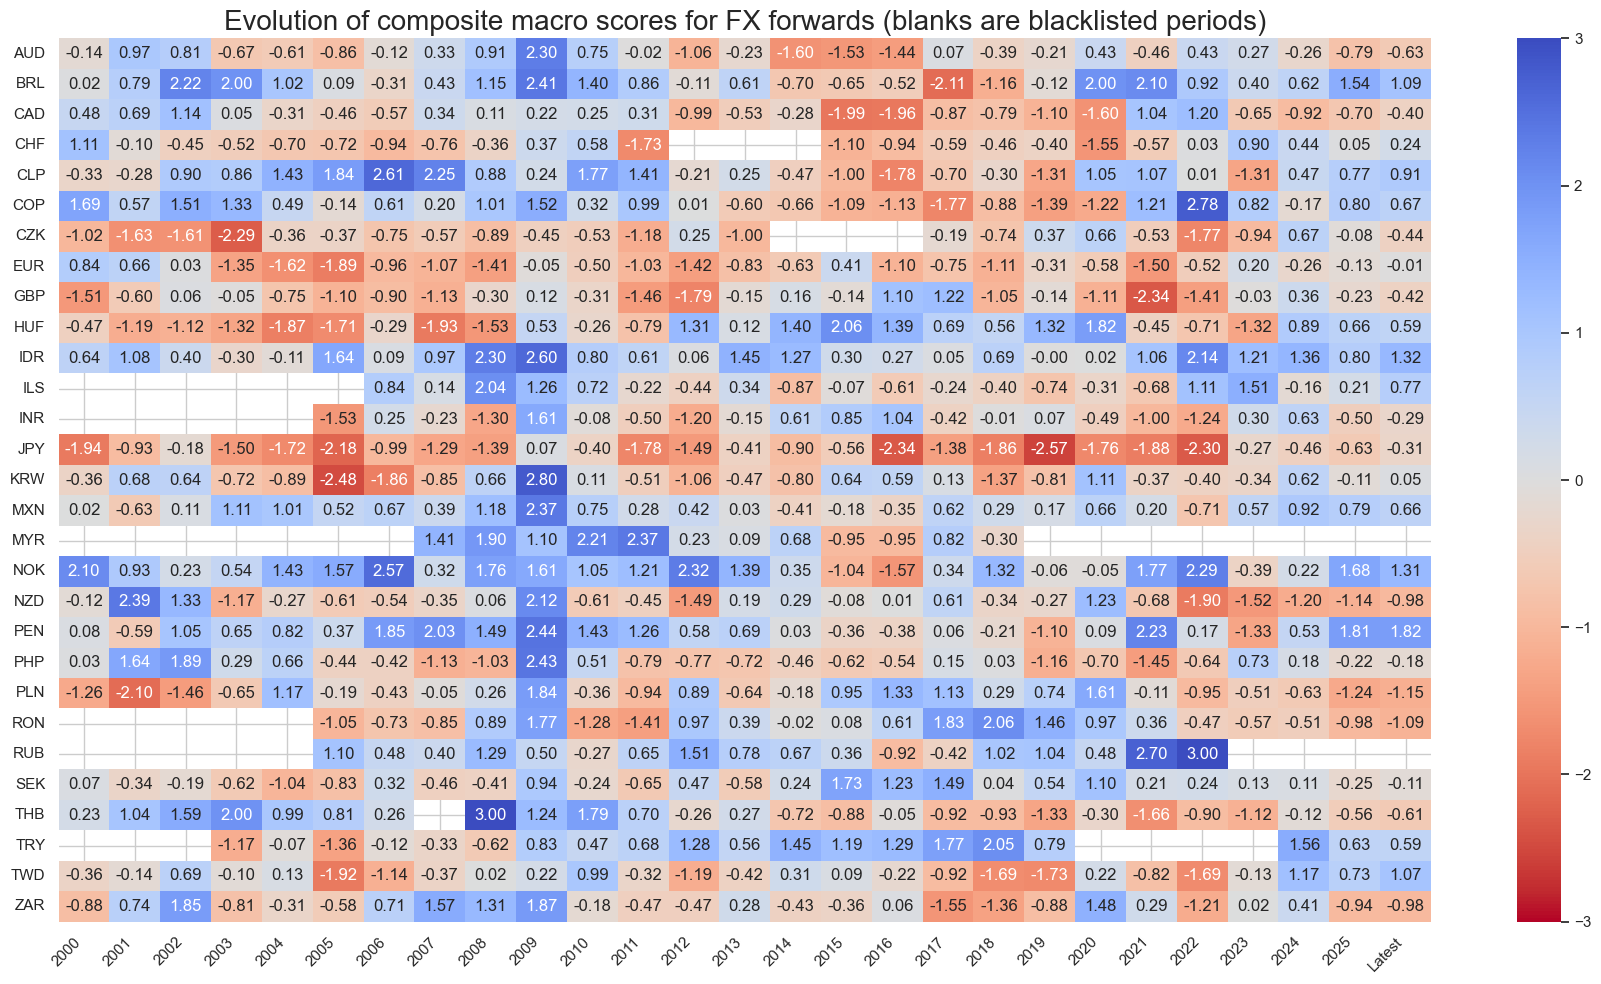
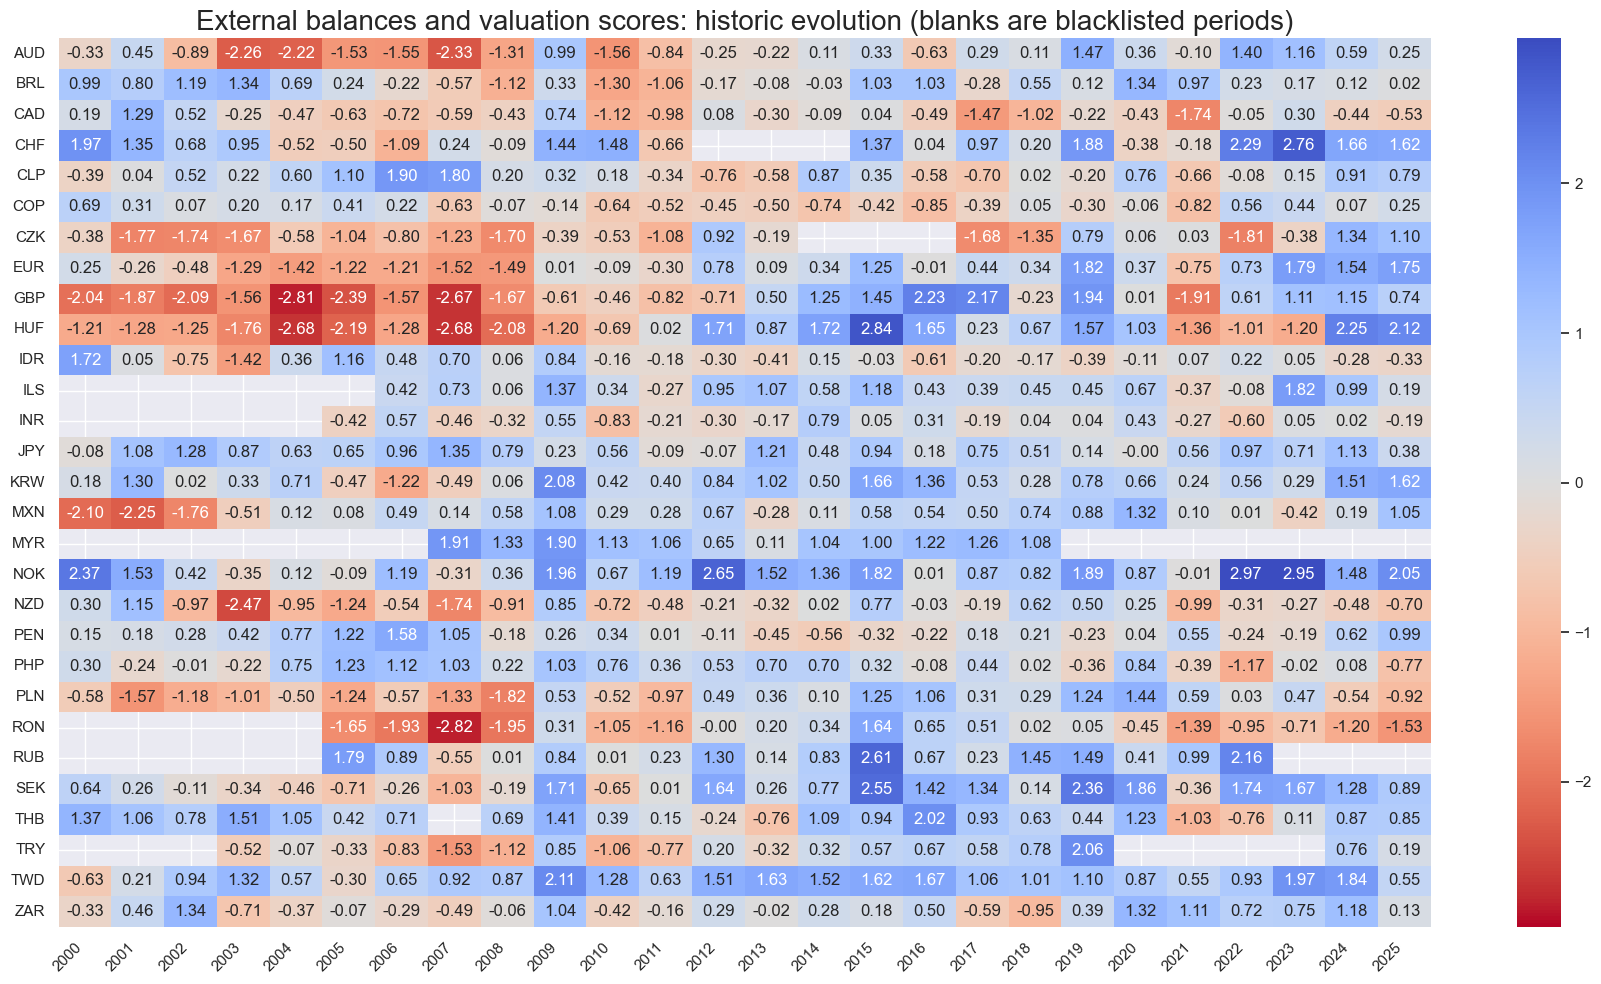
It can be useful to view the long-term evolution of composite or thematic factor scores. This can be quickly implemented through the view_score_evolution() method of the ScoreVisualisers class. This view reveals that by historical standards, the latest FX environment is diverse but predominantly positive for smaller countries’ currencies. The size of most scores is modest.
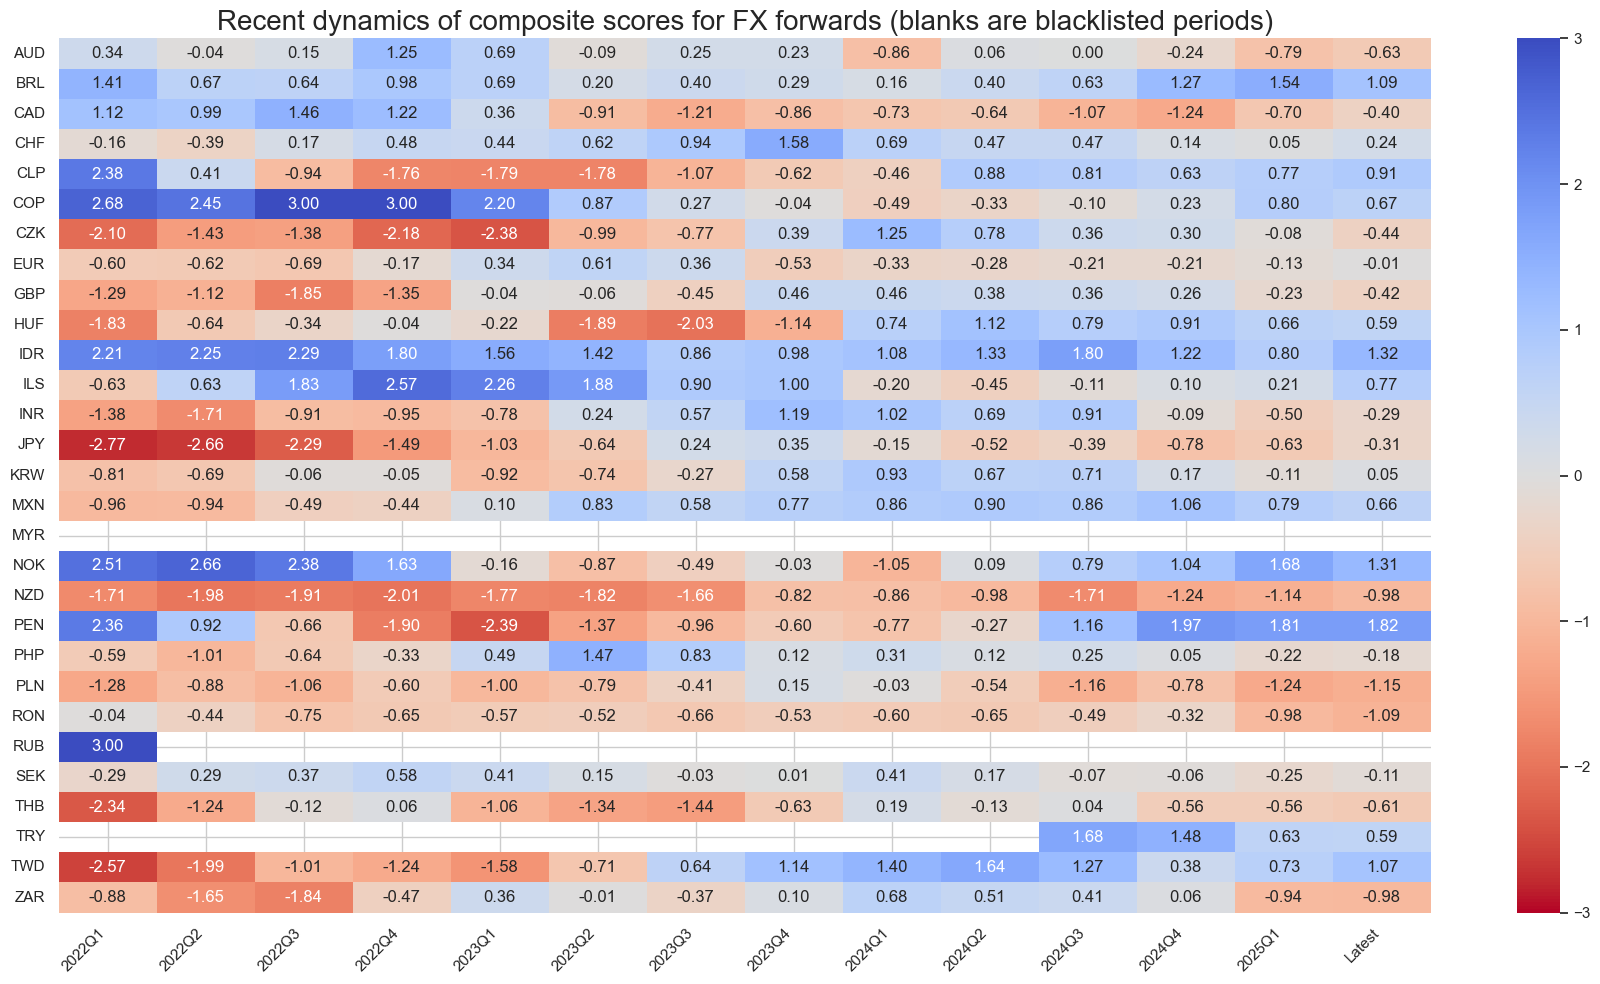
A quarterly-frequency display of more recent dynamics since 2022 illustrates that while composite score values change continuously, their signs have flipped direction only about once per year. The gradual, almost surreptitious evolution in macro conditions often gives rise to rational inattention and missed trading opportunities.
Predictive power and economic value
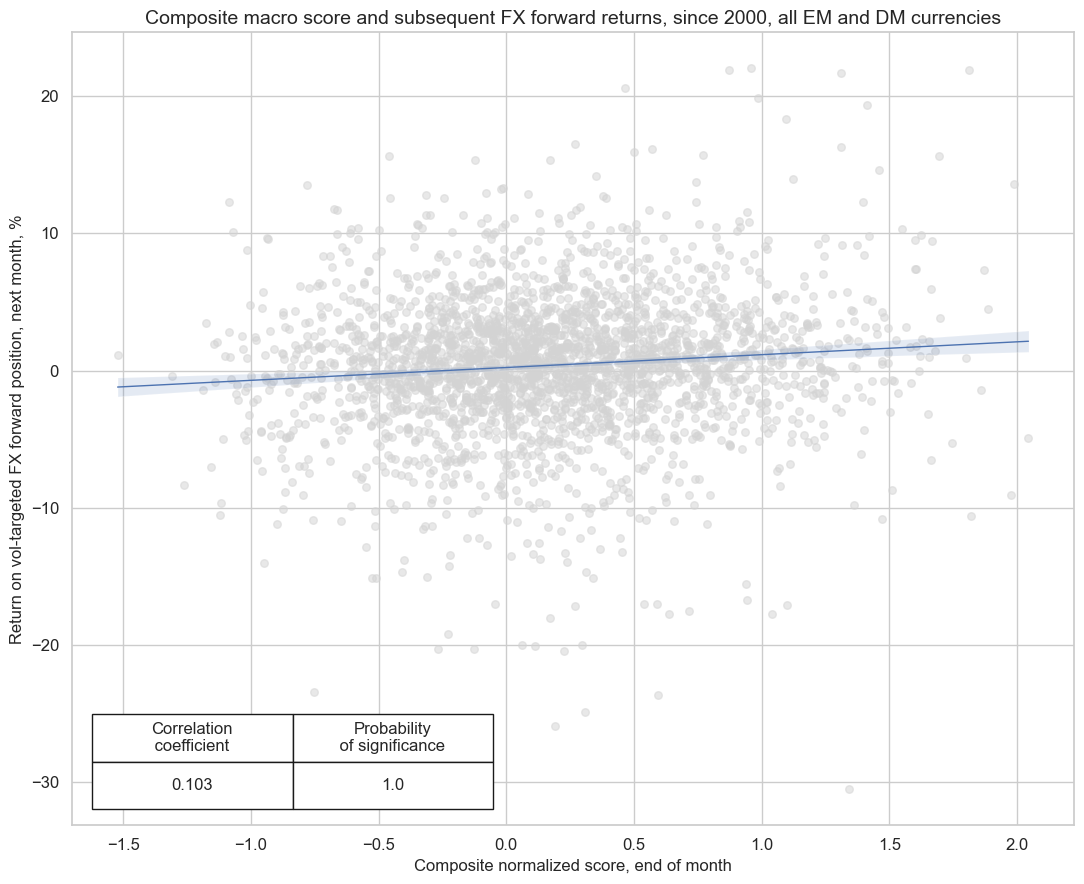
Since all macro-quantamental scores are point in time, one can easily test their predictive power at various frequencies. We do so by using the CategoryRelations class of the Macrosynergy package. The below scatters and regression illustrate the predictive relation between end-of-month thematic macro scores and the next month’s volatility-targeted FX returns. The volatility targeting ensures that results are not biased towards the most volatile currencies and episodes. The focus of the analysis is, as usual, on the direction of the predictive relation and its statistical significance, according to the Macrosynergy panel test. Note that this test assesses both the intertemporal and cross-currency predictive strength.
All four thematic scores have predicted subsequent FX forward returns positively and with high significance. The results hold if we use non-vol-targeted returns, except that strength and significance of relative economic activity is a bit lower and that of external balances and valuation a bit higher. The change in emphasis presumably reflects the greater effect of crisis periods and vulnerable countries on untargeted returns. Positive and significant predictive power is also confirmed for all thematic scores at weekly and quarterly frequencies.

With all thematic factor scores being significant positive predictors, it is not surprising that the composite of them is also a highly significant positive predictor of subsequent FX returns. What is important, though, is that the forward correlation of the composite score is stronger than that of any individual score. Combined predictive power is far more than an average of individual predictive power. This illustrates that conceptually distinct macro themes are often complementary in predicting returns.
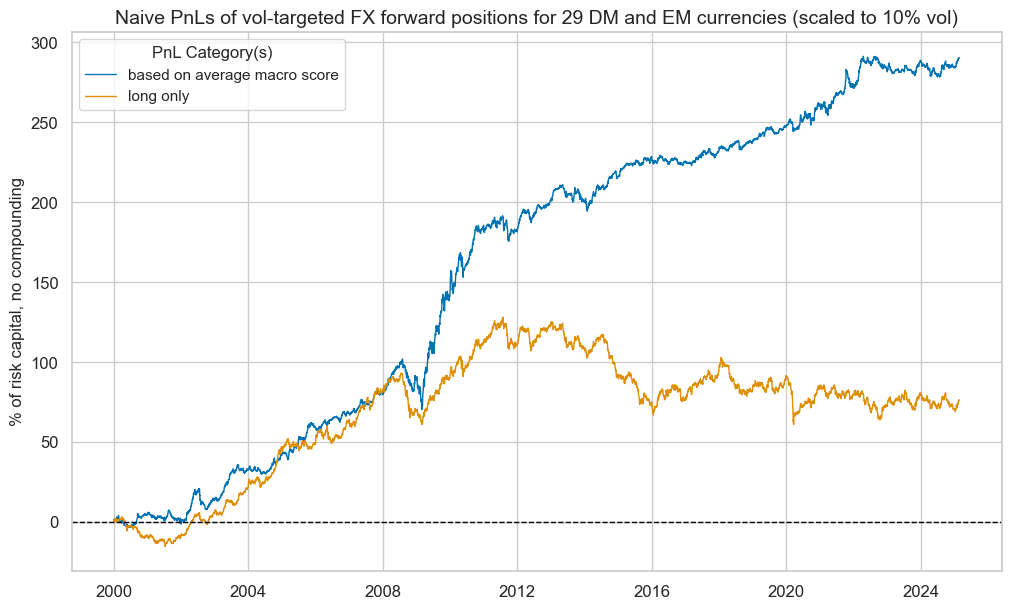
The conceptual macro factors, thematic scores, and the composite score have in no way been optimized. The above scorecard has been crafted based on theory and judgment alone. Therefore, a valid indication of the economic value of such an overlay is the naïve PnL of a simple trading strategy across all 29 FX forwards.
Naïve PnLs are a staple of Macrosynergy research. Here, the PnL simulation takes vol-targeted FX positions at the beginning of each month in accordance with the composite macro score at the end of the previous month assuming a one-day slippage for positioning change. The simulation does not consider transaction costs and any risk management, except for the volatility targeting.
The evolution of risk-adjusted excess returns (net of funding) is displayed below. The long-term Sharpe and Sortino ratios of the composite score-based “strategy” have been 1.2 and 1.7, respectively. Value generation has been consistent, albeit with occasional periods of doldrums. Plausibly, macro scores are more profitable signals when there is economic turmoil than in normal times, as they thrive on cross-country divergences. The share of the top 5% monthly PnLs in long-term value generation has been 50%. Altogether, this shows the pervasive influence of macro influences over periods and currencies, even if measured in very simple and equal forms for all countries.
Thematic focus
The macro focus of FX markets often depends on context and publicized themes. As fear of a specific risk rises, so does the attention to related macro factors. Shifting focus requires adaptable thematic scorecards. For example, FX markets recurrently experience international funding pressures or fears thereof. This typically causes investors to focus on external balances, external liabilities, and currency overvaluation caused by previous capital inflows, particularly in emerging markets. Published market research then begins to focus on groups of presumably vulnerable currencies. One can be ahead of such narratives and check perceptions easily by extracting “thematic scorecards” that focus on the macro factors that are associated with the dominant risks. In the case of funding pressure, they are represented by the conceptual factors of the “external balances and valuation” theme.
The history of a specific FX macro theme is also relevant as it puts the position of all currency areas today in perspective. At the time of drafting this post, very few currencies would have looked vulnerable to funding pressure, particularly when compared with the 2000s and early 2010s.
Currency focus
Strategic positioning in specific currencies can be supported by country scorecards. They give an overview of thematic and conceptual factor developments and can drill down to lower-level constituents. They also allow a simple verification of common narratives as to the macroeconomic position of a currency.
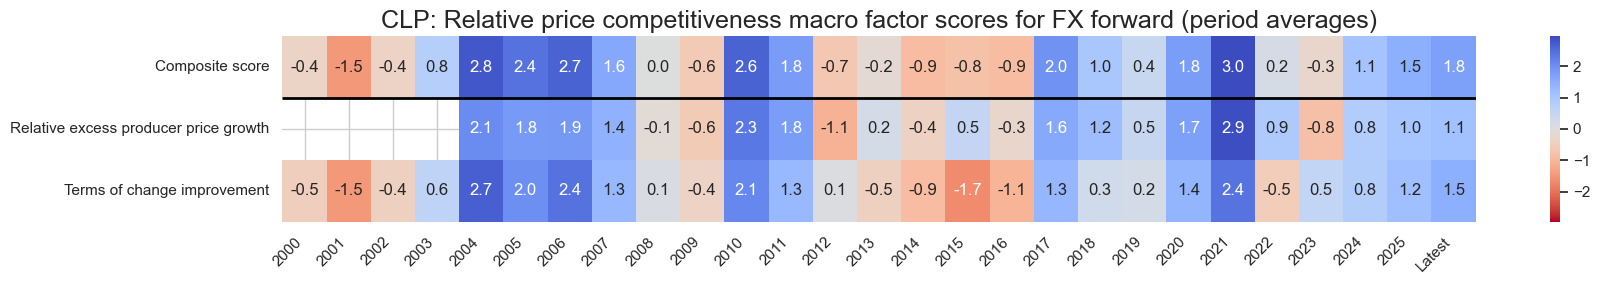
The below intertemporal scorecard for the Chilean peso, for example, shows a modestly supportive latest macro environment, based mainly on price competitiveness and external valuation.
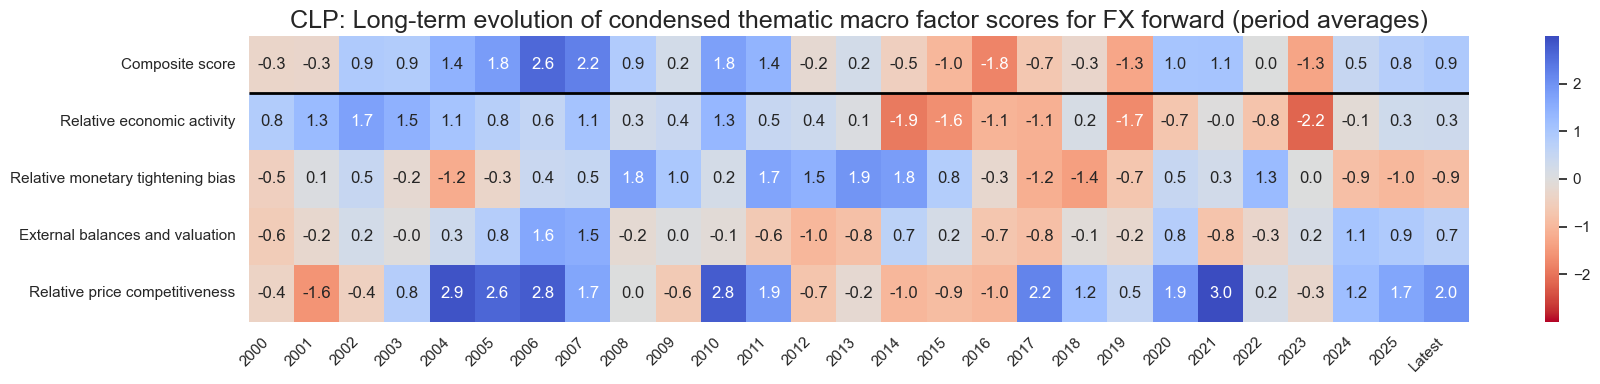
The price competitiveness, in turn, arises mainly from the high value of the terms-of-trade factor score.
The external valuation metric is supported by the external balances score and (negative) overvaluation score. 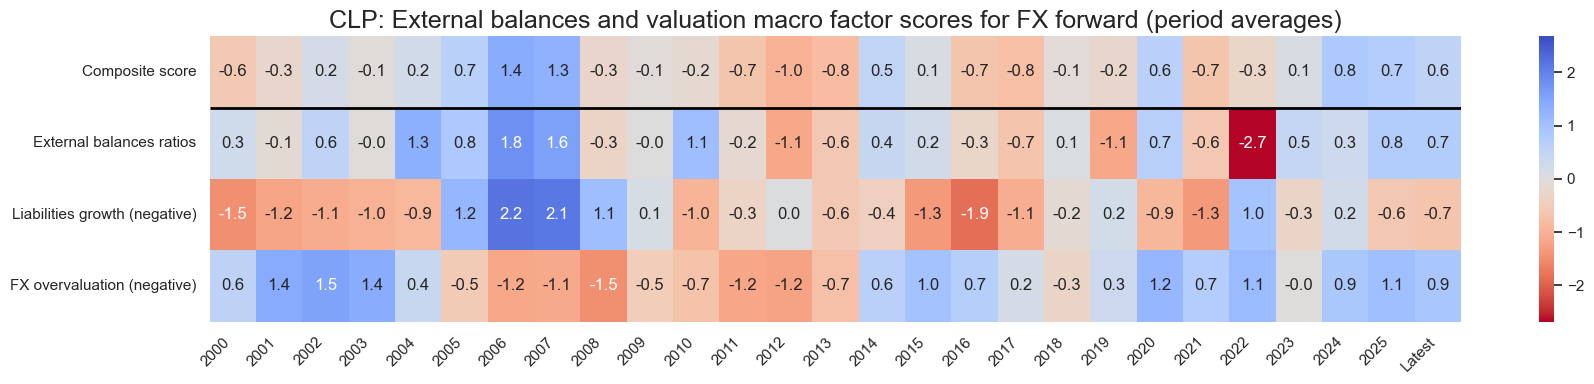
Annex: Full structure of global FX scorecard
This is a detailed structure with links to relevant documentation of the underlying macro-quantamental categories.
Thematic factor 1: Relative economic activity
- Conceptual factor 1: Relative output growth
- Intuitive GDP nowcast, % over a year ago, 3mma, relative to base currency area
- Technical GDP nowcast, % over a year ago, 3mma, relative to base currency area
- Industrial output growth, % 6 months over previous 6 months, seasonally-adjusted annualized rate, relative to base currency area
- Industrial output growth, % over a year ago, 3mma, relative to base currency area
- Conceptual factor 2: Manufacturing business confidence changes
- Conceptual factor 3: Relative labor market tightening
- Conceptual factor 4: Relative private consumption growth
- Real private consumption, % over a year ago, 3mma, relative to base currency area
- Consumer confidence score, seasonally adjusted, relative to base currency area
- Consumer confidence score, difference 6m/6m, seasonally adjusted, relative to base currency area
- Real retail sales, % over a year ago, 3mma, relative to base currency area
Thematic factor 2: Relative monetary policy tightening bias or tightness
- Conceptual factor 1: Relative excess inflation ratios
- Excess headline CPI inflation, % over a year ago, relative to base currency area
- Excess headline CPI inflation, % 6 months over previous 6 months, seasonally-adjusted annualized rate, relative to base currency area
- Excess core CPI inflation, % over a year ago, relative to base currency area
- Excess core CPI inflation, % 6 months over previous 6 months, seasonally-adjusted annualized rate, relative to base currency area
- Excess 2-year inflation expectation, %, relative to base currency area
- Conceptual factor 2: Relative excess credit growth
- Conceptual factor 3: Real rate differentials and carry
- Conceptual factor 4: Relative liquidity tightening
- Monetary base, as % of GDP, difference over 3m, relative to base currency area, negative
- Monetary base, as % of GDP, difference over 6m, relative to base currency area, negative
- Intervention liquidity, as % of GDP, % over a year ago, 3mma, relative to base currency area, negative
- Intervention liquidity, as % of GDP, % over a year ago, 6mma, relative to base currency area, negative
Thematic factor 3: External balances and valuation
- Conceptual factor 1: External balances ratios (and their changes)
- Conceptual factor 2: External liabilities growth (negative)
- Conceptual factor 3: FX overvaluation
Thematic factor 4: Relative price competitiveness
- Conceptual factor 1: Relative excess producer price growth
- Conceptual factor 2: Terms of trade improvement
The term “excess” in the above descriptions means relative to the central bank’s effective inflation target (documentation here). Excess credit ratios are all divided by the effective inflation target, as it is typically the proportionate deviation that determines the monetary policy response. Finally, if constituents of a conceptual factor score or a thematic score are missing, the score is calculated based on the available constituents.
Despite the nesting of three levels of macro scores, the scorecard’s structure and reading are straightforward. That is mainly because we treat all currency areas equally. This facilitates interpretation but may not generally be optimal given the wide range of developed and emerging market currencies that are covered:
- We apply the same categories and structure to all countries. Principally this can be enhanced by selecting different indicators for a conceptual or thematic factors, depending on country convention. For example, rather than using just employment growth and unemployment rates for the state of labor in the U.S. one could add jobless claims.
- We assume that the quantitative impact of any macro-quantamental score is the same across currency areas. Principally, one could scale factors based on expert judgment or theoretical considerations. For example, the impact of growth differentials on exchange rate moves should depend on the openness of an economy.
- We weigh conceptually distinct factors equally without ranking or optimization. This evokes the principle of “conceptual parity”, which often serves well for building robust signals in systematic trading strategies. If this seen as undesirable optimization based on statistical learning is a plausible and valid enhancement (view post here).


