Macro-quantamental scorecards enable portfolio managers to systematically exploit point-in-time economic information for the rebalancing of their positions. This post illustrates how to construct quantamental factors and scorecards for dollar-based investors in emerging local bond markets, a segment that demands close attention to macroeconomic developments.
A plausible set of relevant macro factors includes changes in external balances, relative economic growth, terms-of-trade dynamics, international investment positions, government balances, and duration term premia. The dynamics and current states of these factors, along with their composite indicators, can be visualized through snapshot scorecards, historical heatmaps, and country-specific scorecards. Empirical evidence demonstrates that the resulting scores possess significant predictive power, high accuracy, and material PnL value-generation potential.
The post below is based on Macrosynergy’s proprietary research. Please quote as “Sueppel, Elena, ‘Macro scorecards for local-currency EM bonds,’ Macrosynergy research post, November 2025.”
The attached Jupyter notebook allows for the audit and replication of the research results. The notebook’s operation requires access to J.P. Morgan DataQuery to download data from JPMaQS. Access is generally available to DataQuery clients, subject to restrictions. J.P. Morgan offers unrestricted access for institutional clients, including free trials. Also, an academic research support program.
How macro-quantamental scorecards create investment value
A macro-quantamental scorecard is a concise and intuitively structured presentation of point-in-time macroeconomic factors designed to predict subsequent financial market trends. Each conceptual factor typically combines several underlying macro-quantamental indicators. For instance, the abstract factor “external balance strength” may be derived from multiple external balance measures and their respective dynamics. Importantly, all indicators must rely solely on the information available at each point in time, without contamination by revisions or hindsight. A comprehensive range of macro-quantamental indicators for macro strategies is available on the J.P. Morgan Macrosynergy Quantamental System (JPMaQS).
A macro-quantamental factor scorecard provides systematic support for discretionary portfolio management in two principal ways:
- Efficient visualization: Scorecards enable the systematic, continuous review of a wide range of economic information through simple heatmaps. This is illustrated in the fourth section of this post. The information can also be passed on directly to systematic trading.
- Empirical validation: Since macro-quantamental indicators and factors are point-in-time, it is straightforward to evaluate their predictive power. Thereby, we can build scorecards whose content is “filtered” by empirical evidence. In the fifth section of this post, we show how to test predictive correlation, predictive accuracy, and stylized PnL value generation along the lines of a previous post (Evaluating macro trading signals in three simple steps). If a factor has a strong theoretical backing, empirical validation may not be necessary for inclusion in a scorecard. However, empirical validation is essential when theory is ambiguous or even speculative.
Emerging local currency bond markets
In this post, we show examples of macro-quantamental scorecards for investments in local emerging bond markets. In particular, the analysis targets U.S. dollar returns on local-currency bond index positions, which are subject to foreign exchange, duration, and sovereign credit risk. The returns of these positions are from JPMaQS (documentation) but are based on the J.P. Morgan Government Bond Index Emerging Markets (GBI-EM), which provides a benchmark for local-currency bonds issued by emerging-market governments.
The set of 16 emerging markets considered for this post is in alphabetical order of the currency symbols: Brazil (BRL), Chile (CLP), Colombia (COP), the Czech Republic (CZK), Hungary (HUF), Indonesia (IDR), Mexico (MXN), Malaysia (MYR), Peru (PEN), the Philippines (PHP), Poland (PLN), Romania (RON), Russia (RUB), Thailand (THB), Turkey (TRY), and South Africa (ZAR). Periods in which markets were not tradable or illiquid have been excluded based on JPMaQS’ “tradability dummy” for the FX forward markets (documentation).
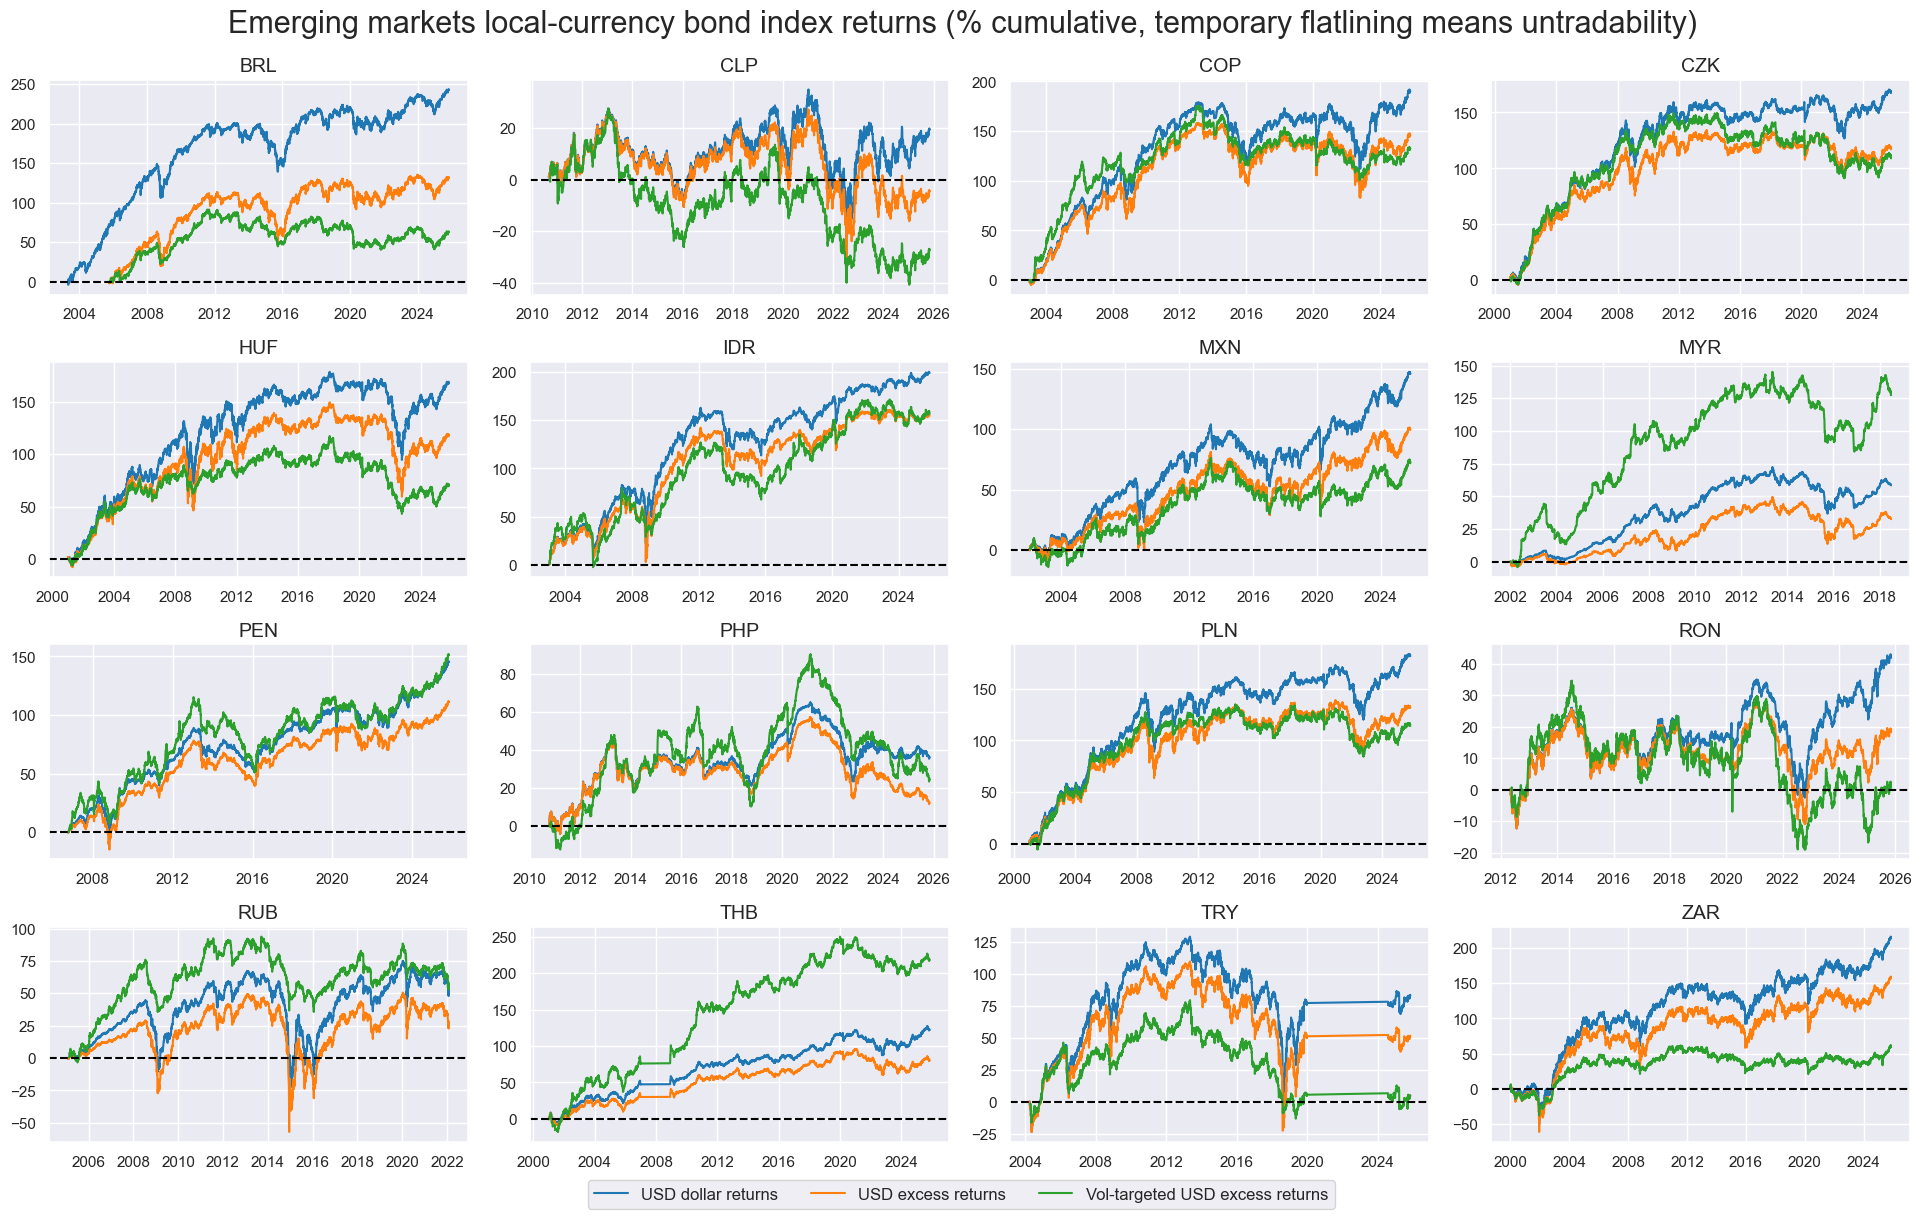
U.S. dollar returns on local bond investments have shown considerable variation across countries. The timeline panel below illustrates the evolution of three types of returns: dollar cash returns (blue lines), dollar excess returns that account for funding or opportunity costs (orange lines), and volatility-targeted excess returns (green lines). The primary focus of the following analyses is the excess return on volatility-targeted positions, which ensures a comparable level of risk exposure across countries and over time. Positions are recalibrated monthly to target an expected annualized volatility of 10%, based on recent historical return standard deviations. These standard deviations are computed as an exponentially weighted moving average of daily returns with a half-life of 11 active trading days.
Through their periods of tradability since 2000, vol-targeted positions in local EM bond index portfolios have mostly produced positive returns. Long-term performance has been between a negative 30% and a positive 220%. The weakest performance came from Chile, Turkey, and Romania. Thailand, Peru, and Indonesia achieved the strongest performance.
Plausible macro factors for tactical allocation
Two types of macro factors matter for local EM bond returns: country-specific factors and global factors. Here, we focus exclusively on local EM factors and even among these, only on proper macro factors. We disregard market factors, such as price trends, flows, or carry. Theoretically valid factors must affect the combined FX, duration, and credit risk balance of local EM bond exposure.
Based on theory and practical common sense, we identified six simple quantamental factors for this post that should predict either directional or relative local EM bond returns across the 16 markets. In all cases, we first select plausible quantamental indicators for each factor. Then we sequentially normalize these indicators around their natural neutral level (often zero) without hindsight. Then we average the indicator scores and re-normalize sequentially. If some indicators are temporarily unavailable, the factor is calculated based on the available ones. The six selected economic concepts are the following:
- External balances improvement: Shifts toward surpluses in transactions with other countries generally support currency appreciation and create scope for local monetary policy easing. In this analysis, external balance dynamics are approximated as the average of four indicator scores (documentation):
- The latest 3-month average of the seasonally adjusted merchandise trade balance as a ratio of nominal GDP, compared with its 5-year average.
- The 3-month average of the seasonally adjusted current account balance ratio, relative to its 5-year average.
- The change in the 1-year moving average of the merchandise trade balance ratio over the past three months.
- The seasonally adjusted 6-month moving average of the merchandise trade balance, compared with the previous 6 months.
- Relative economic growth: Stronger output growth relative to the United States tends to support currency appreciation and reduce sovereign credit risk. This factor is constructed as the average of three relative growth measures, all derived from the intuitive GDP growth estimation methods of JPMaQS (documentation):
- The estimated monthly GDP growth of the local economy relative to that of the U.S..
- The 3-month moving average of relative GDP growth versus the U.S.
- The estimated excess GDP growth of the local economy compared both with its own 5-year median and with U.S. excess growth.
- Terms of trade improvement: Rising export versus import prices foster net demand for the local currency and benefit government finances. The factor is calculated as an average of 3 change scores of commodity terms of trade with different lookback horizons (documentation): latest week over the previous 4 weeks, latest month over the previous 12 months, and latest month over the previous 5 years.
- International investment dynamics: An improving net international investment position, i.e., rising assets and declining liabilities, reduces vulnerability to sudden market disruptions and lowers sovereign default risk. The dynamics of international investments are captured by two sets of metrics, covering both net international asset growth and liability reduction (documentation):
- The change in net international investment as a percentage of GDP for the latest month relative to its 2-year and 5-year moving averages.
- The negative change in international liabilities as a percentage of GDP for the latest month relative to its 2-year and 5-year moving averages.
- Fiscal balances strength: Government surpluses reduce bond issuance and sovereign default risk. Here we simply average three types of annual general government balance ratios as % of GDP, normalized around the presumed neutral 3% Maastricht deficit threshold (documentation): the overall balance, the primary balance, and the structural balance.
- Duration term premia: High-risk premia on duration exposure accrue to the local bond investors. Here, the focus is on term premia estimates for interest rate swap contracts, based on macro-quantamental indicators (documentation) and the Macrosynergy model. Conceptually, the fixed income term premium refers to the gap between the yield of a longer-maturity bond and the average expected risk-free short-term rate for the same maturity. The factor is the average of the 2-year, 5-year, and 10-year estimated term premia scores.
The above factor scores are neither complete nor optimized, but sufficient for a simple, meaningful scorecard and proof of concept of material value generation. Composite macro factor scores have been calculated as re-normalized averages of the above six factor scores.
The evolution over time indicates that composite factor scores act as slow-moving trading signals, characterized by long cycles and only limited short-term fluctuations. They typically change sign less than once per year.
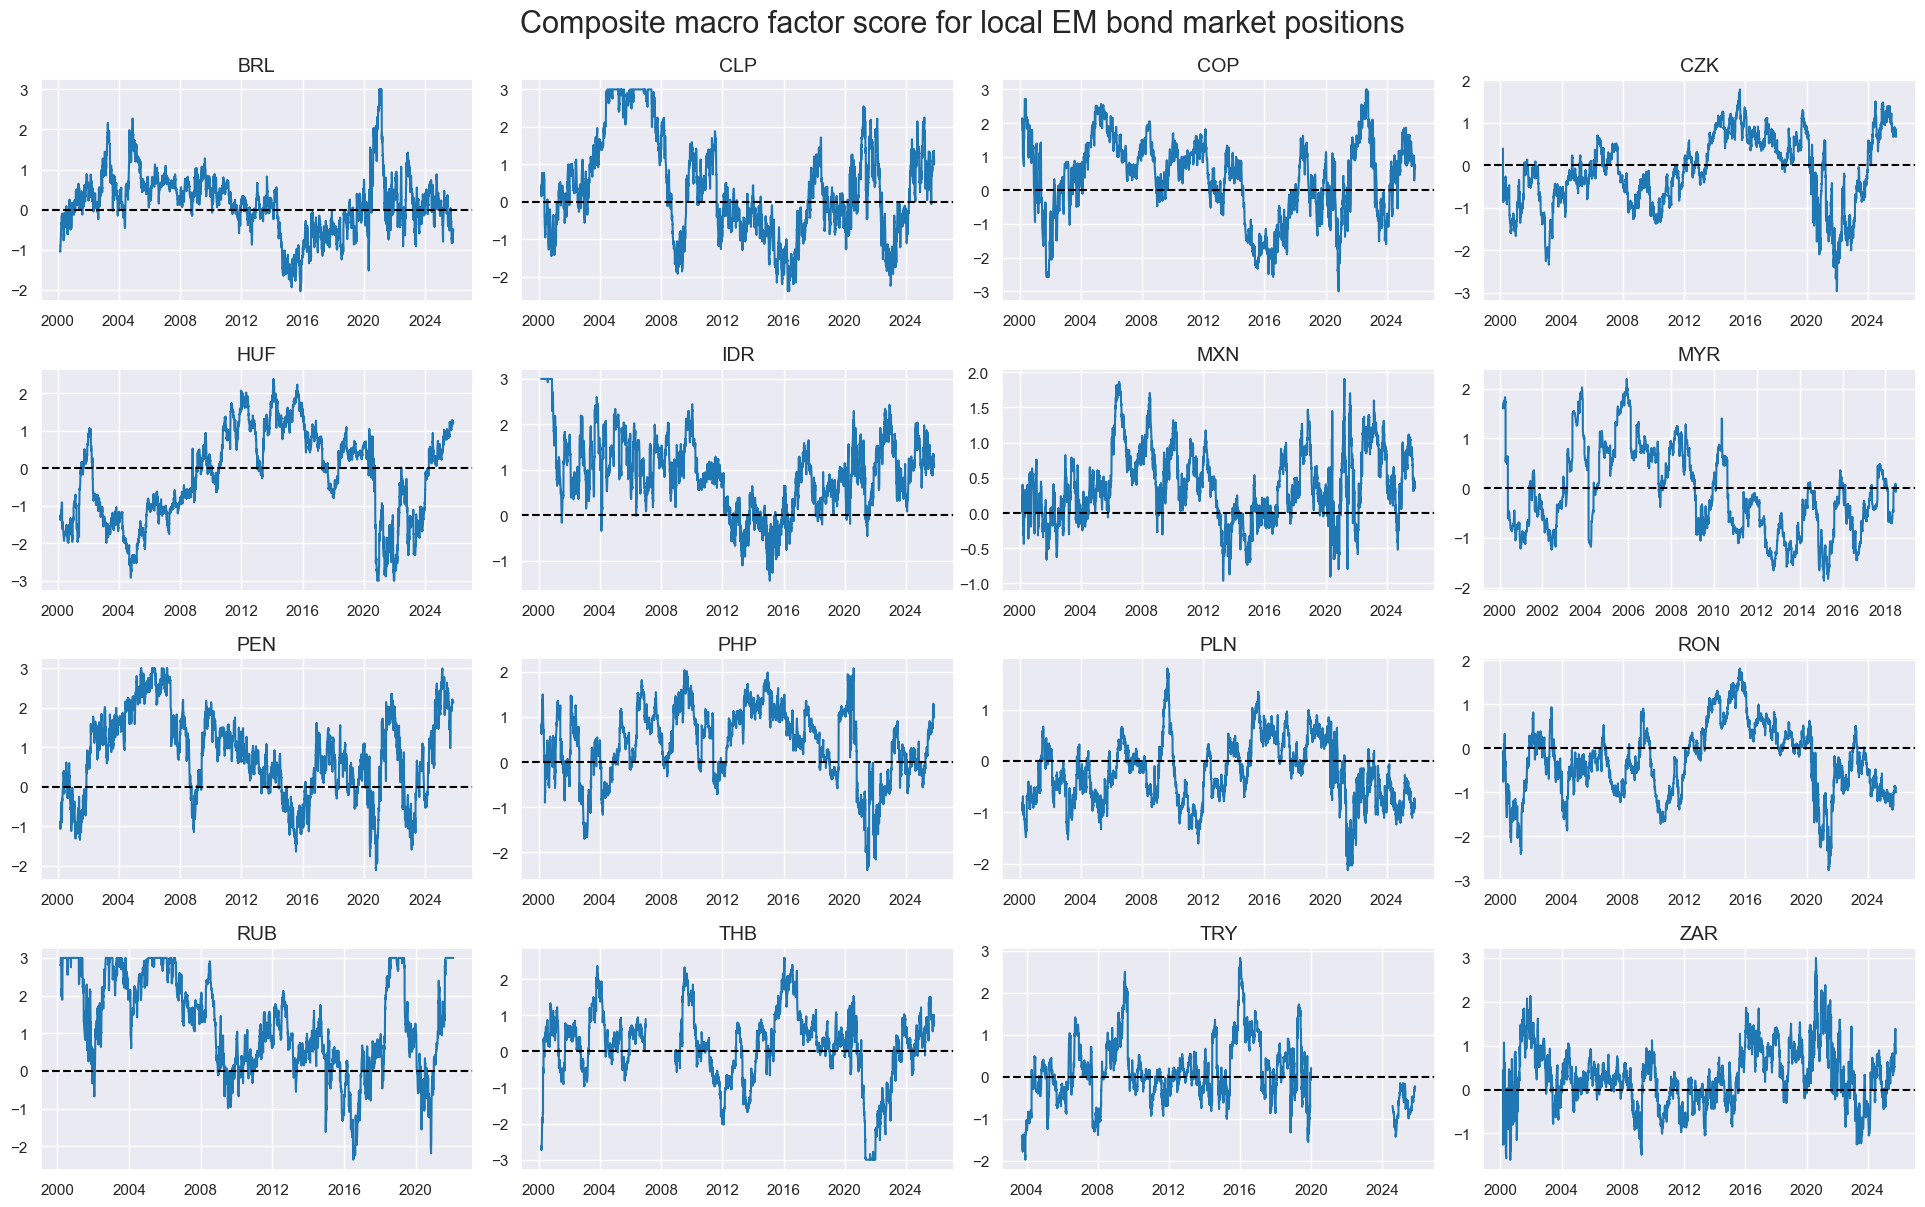
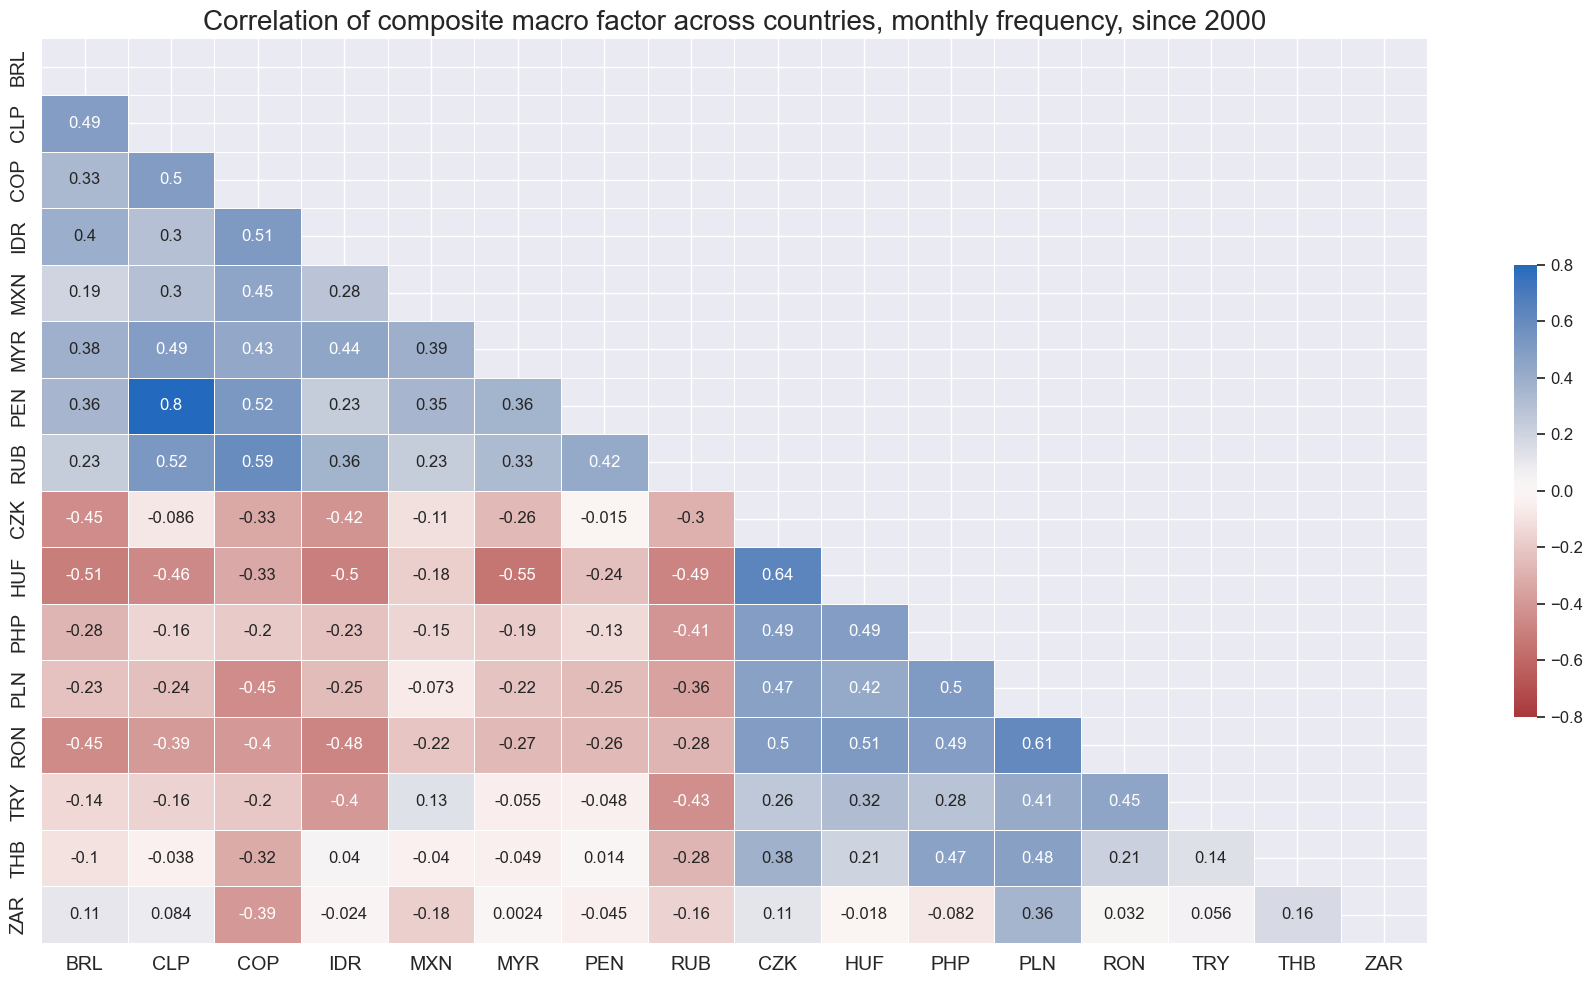
Unlike many market-based factors, such as trend or carry, the composite macro factors have not exhibited predominantly positive correlations across emerging markets. In particular, commodity importers and exporters have often shown negatively correlated signal values.
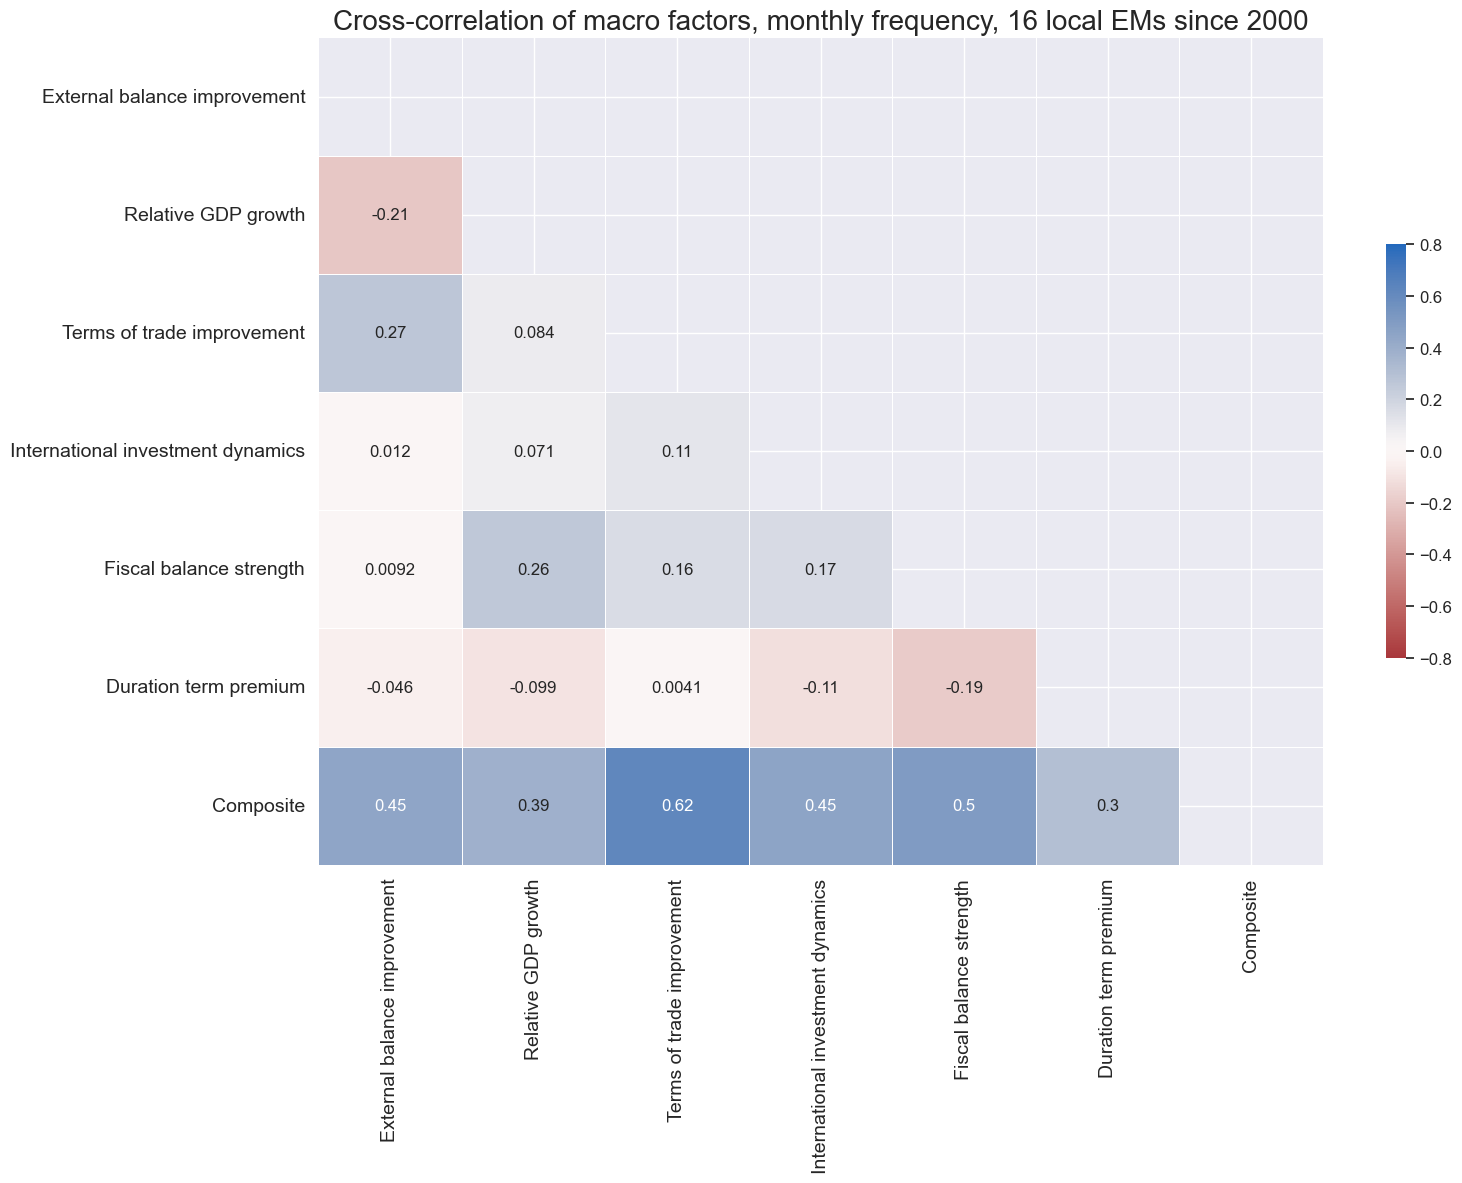
Cross-factor correlations have generally been low across the 16 countries in the panel. The largest positive correlation coefficients were shown between terms of trade and external balances improvements, and between relative growth and government fiscal balances, but none reached 30%. Negative correlation was found between relative GDP growth and external balance improvements, and between fiscal balances and duration term premia.
Macro-quantamental scorecards for EM local markets
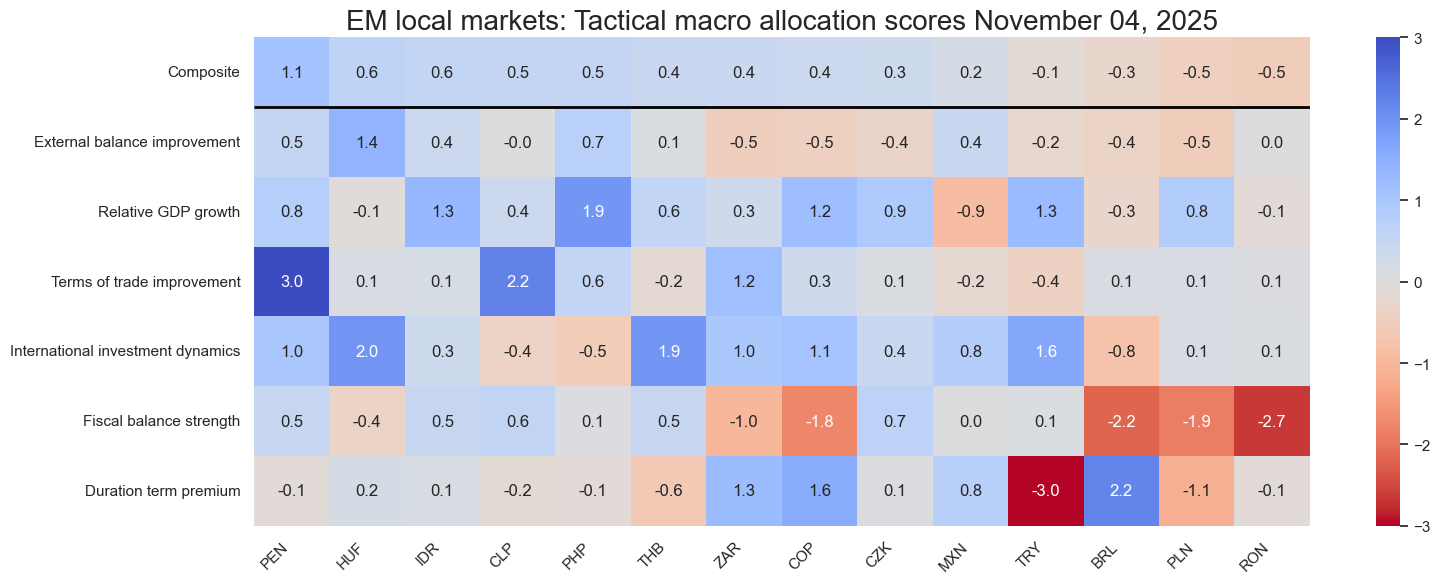
“Snapshot scorecards” visualize and rank various markets according to macro factor scores at any given point in time. If they are based on quantamental indicators, they update daily or even intra-day. All scorecards of this post have been produced in Python with a standardized pandas data frame and using the ScoreVisualisers class of the Macrosynergy package. The current point-in-time scorecard, for example, can be displayed with the view_snapshot method of the class. The instantiation of the class and the use of the method are shown in the Jupyter notebook of this post.
The snapshot below provides an overview of the macroeconomic positions of emerging local bond markets as of 4 November 2025, the cutoff date for this analysis. Based on the composite scores, more countries are in positive than in negative territory. Peru recorded the highest score, driven primarily by improvements in terms of trade, international investment dynamics, and strong GDP growth relative to the U.S. In contrast, Romania and Poland showed the weakest positions. Both countries exhibit large government deficits, while Poland also faces a negative duration risk premium and widening external deficits.
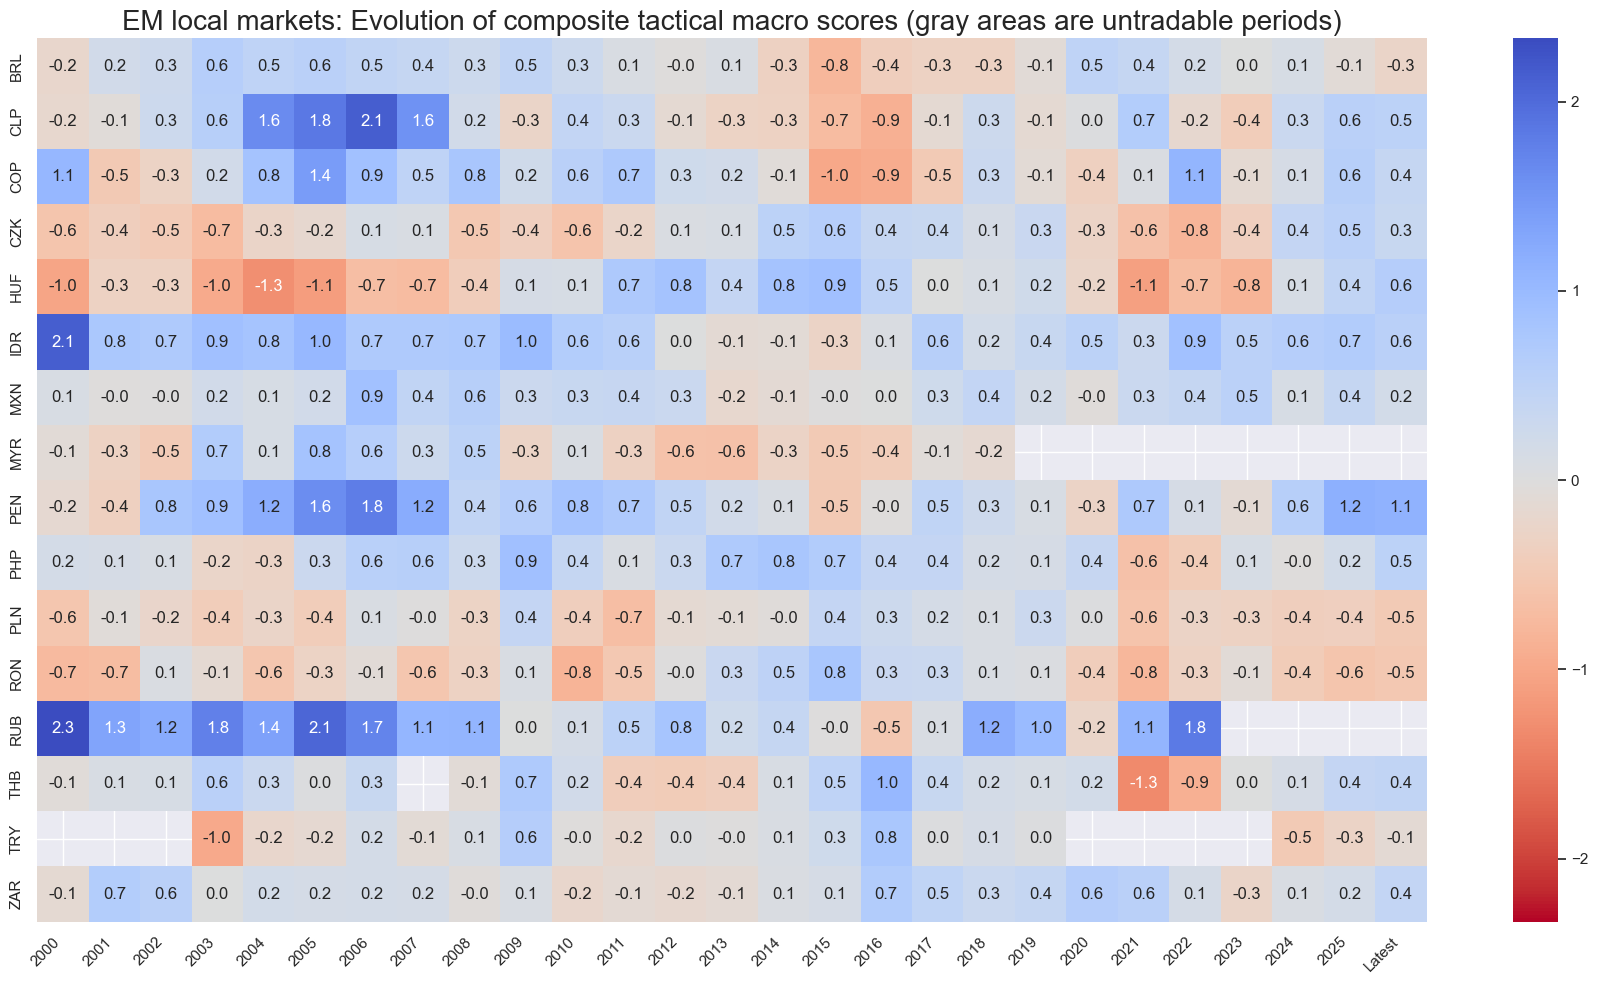
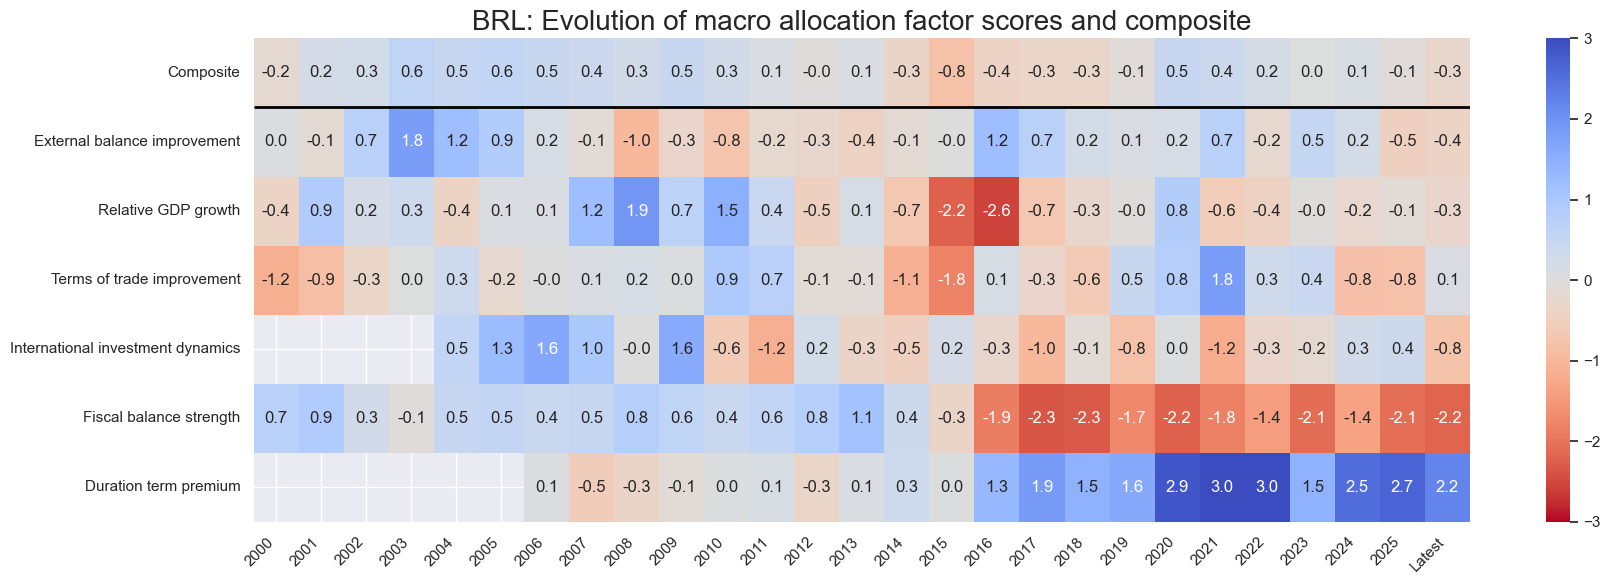
The historical overview below shows the evolution of composite macro scores since 2000, excluding periods where a market was not tradable. It has been produced with the view_score_evolution method of the ScoreVisualisers class. Compared to 2024, signals improved notably for the Philippines, Peru, Hungary, and South Africa. Brazil has been the only market with a notable deterioration in market conditions.
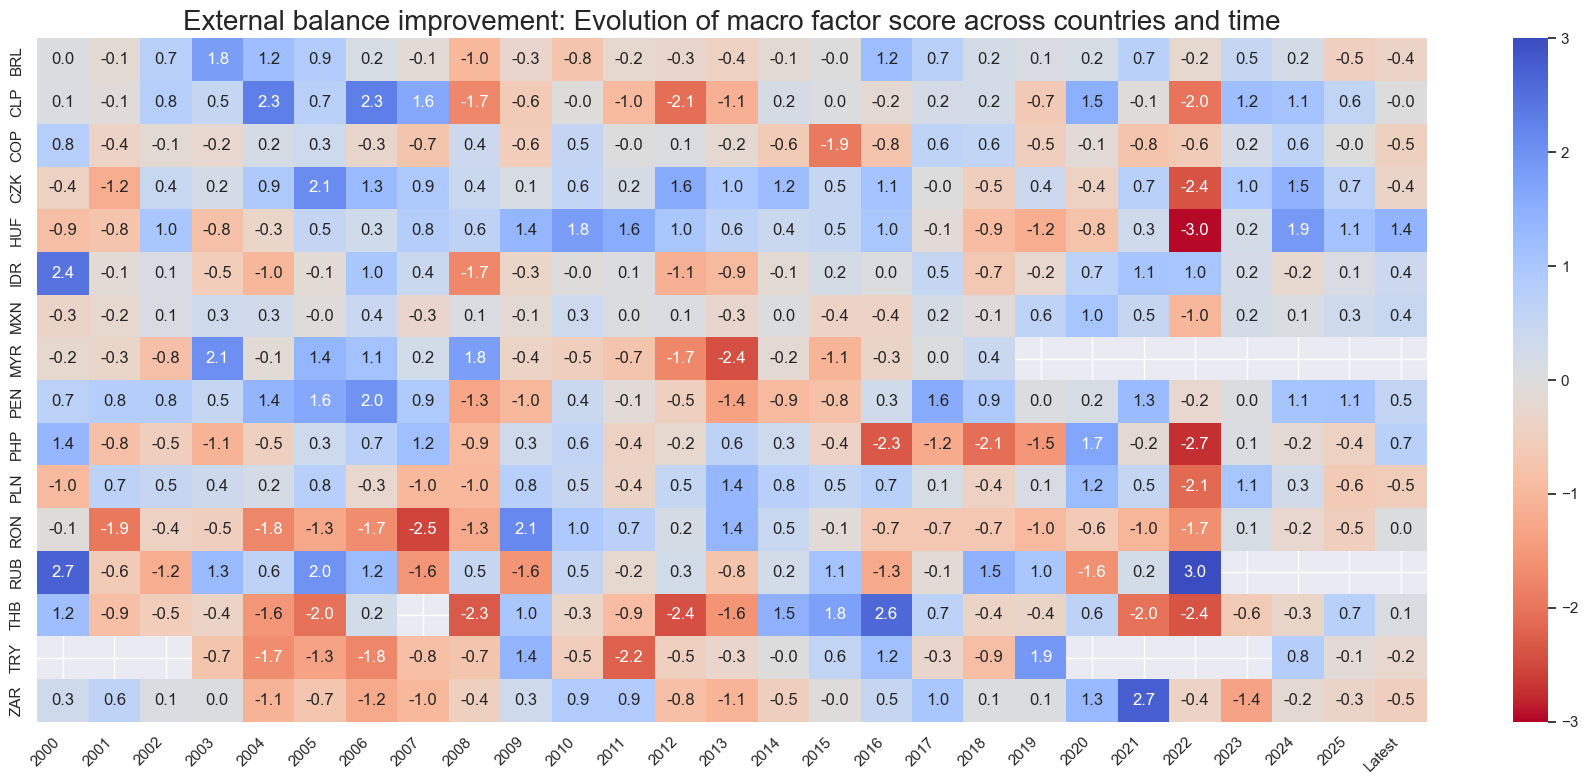
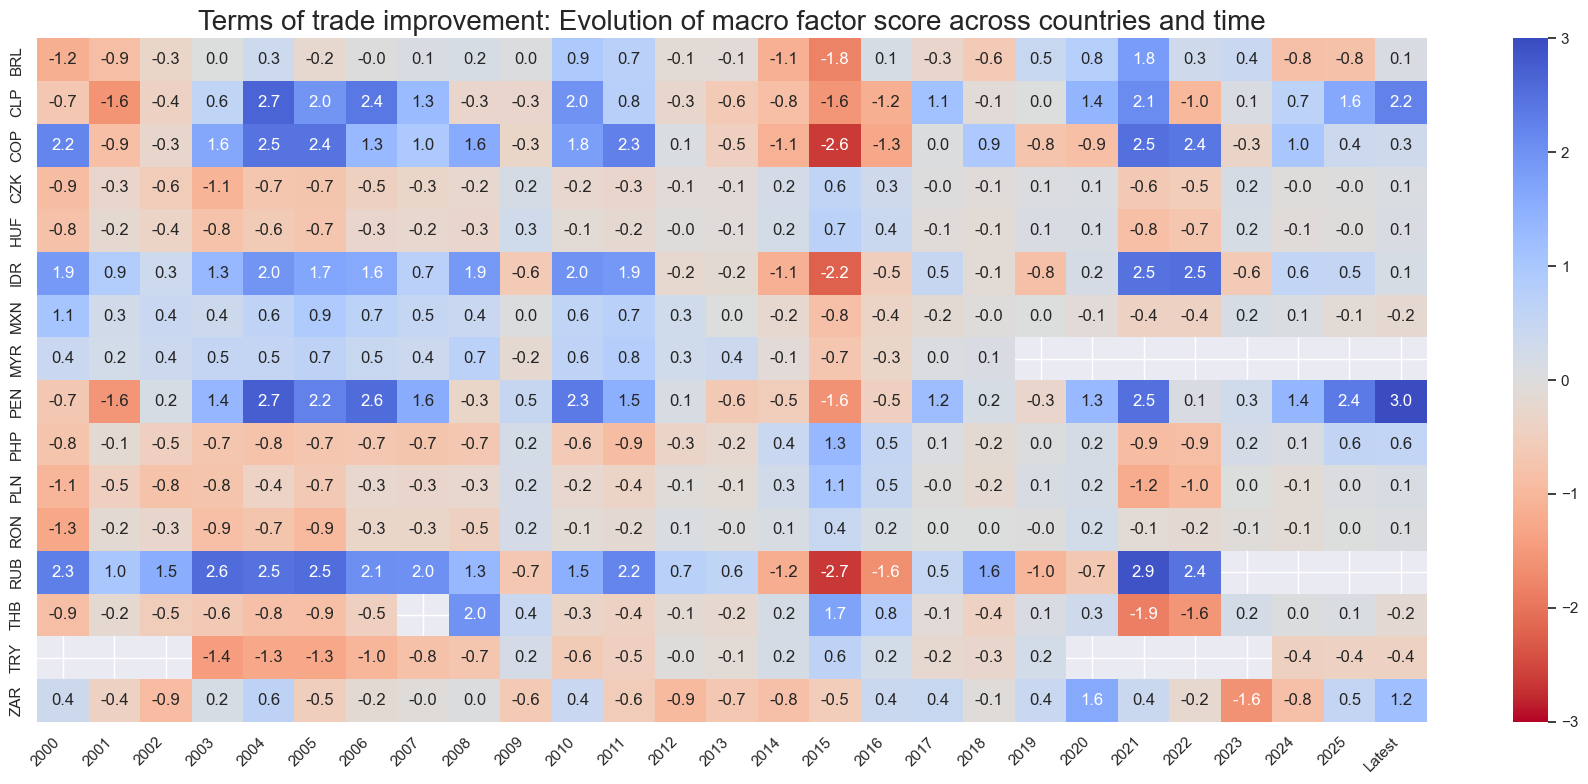
The history of macro factor scores can also be shown thematically by focusing on a specific macro factor score. This is useful if the overall market focus is on a specific subject, such as external vulnerabilities or changes in commodity prices. For example, Turkey would score low on both accounts. However, Turkey’s scores are not dramatically bad by the standards of its own and others’ history.
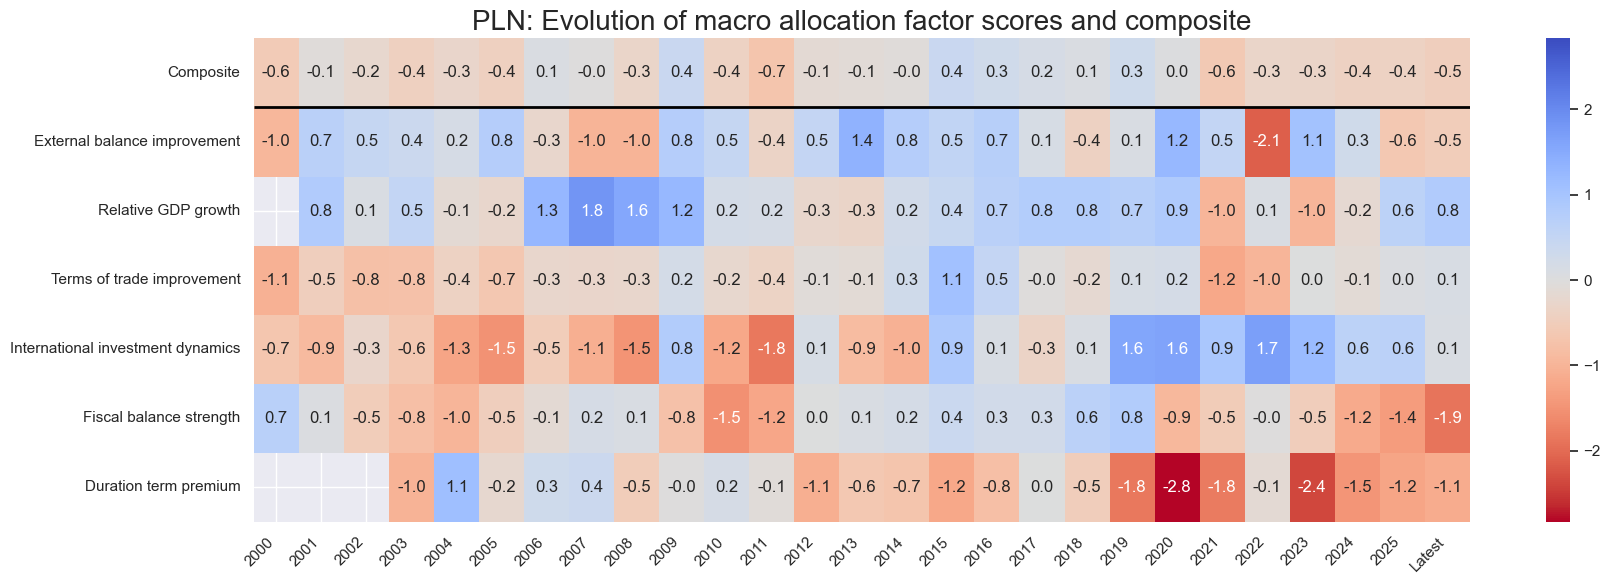
Finally, macro score history can also be viewed country by country. This can be done with the view_cid_evolution method of the ScoreVisualisers class for all cross sections of the emerging market panel. The country view can be useful as due diligence for large concentrated risk exposure in a single local market and for a comparison of a country’s position with general market perception. In the examples below, we see that Brazil’s macroeconomic conditions for local markets deteriorated in the 2010s and 2020s relative to the 2000s, mainly due to larger fiscal deficits, rising international liabilities, and weaker economic growth. In the case of Poland, conditions turned unfavorable in the 2020s due to larger fiscal deficits, negative term premia, and, recently, deteriorating external balances.
Evidence of systematic value generation
This section examines the empirical evidence for the predictive power of the selected macro-quantamental factors since 2000. Demonstrating empirical validity enhances confidence in the systematic application of this type of macroeconomic information. It also helps establish realistic expectations and benchmarks for the practical use of scorecards in live trading
Test 1: Predictive linear correlation
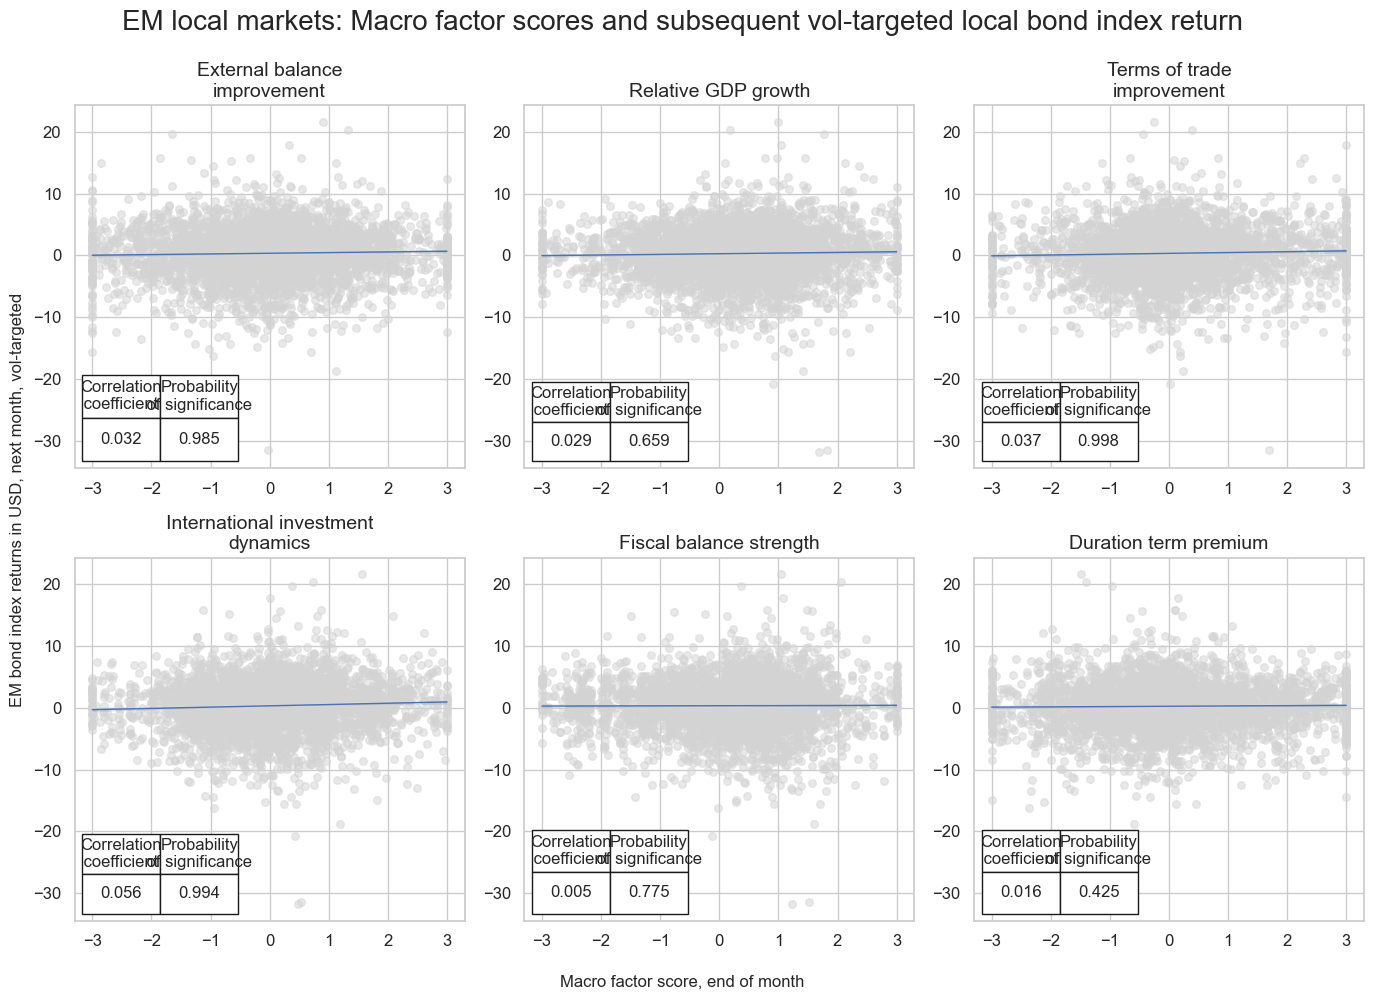
The scatterplot panel below displays regression lines, one-month-ahead correlation coefficients, and significance tests for the proposed relationships between the six macro-quantamental factors and volatility-targeted local EM bond returns. All results are based on panel regression analysis, incorporating 16 cross-sections and time-series data extending back to 2000 or the earliest available observations.
The underlying hypothesis is that variations in these factors are linearly and positively correlated with subsequent returns across both time and countries. A relationship is deemed statistically significant if the factors predict returns in a way unlikely to occur by chance—a determination verified using the Macrosynergy panel test. The analysis shows positive predictive relationships for all six macro factors, with high statistical significance for half of them. The strongest predictive power has been observed for the international investment dynamics factor.
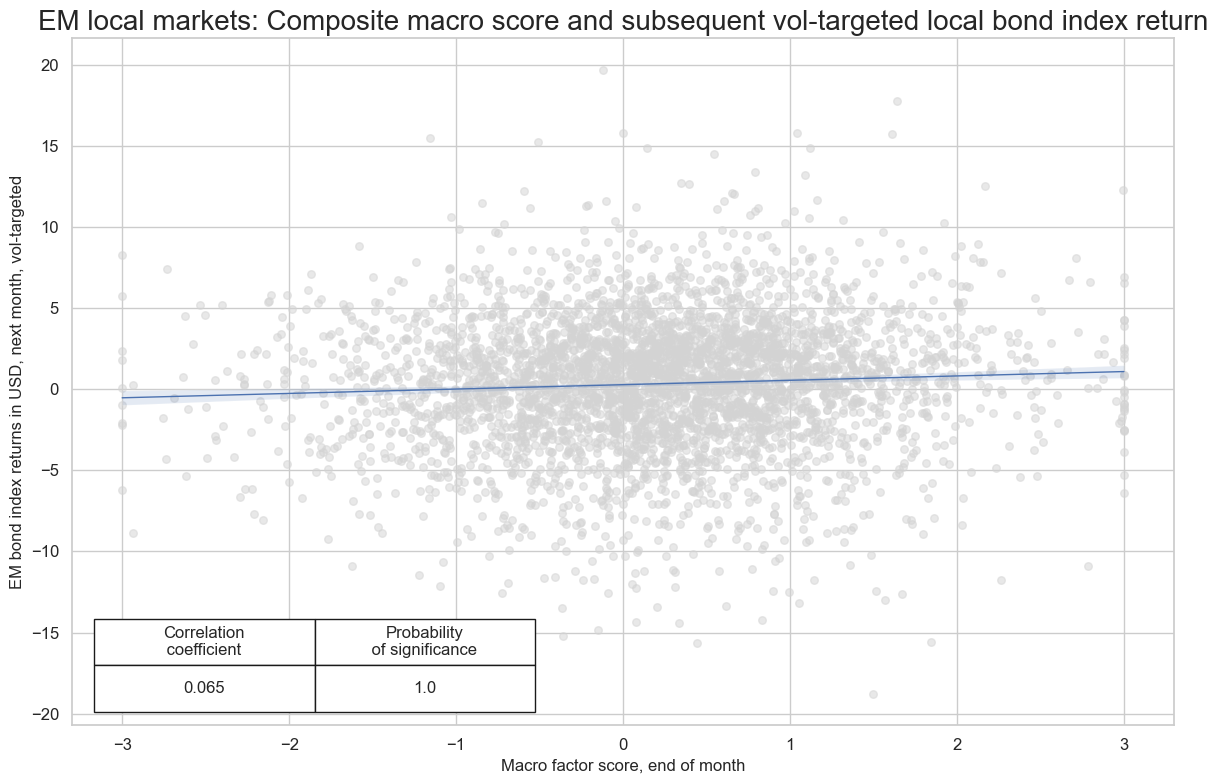
The composite macro factor exhibits a stronger and more statistically significant predictive relationship with subsequent monthly U.S. dollar EM bond returns than any of the individual factor scores. Similarly, the composite factor shows a highly significant predictive relation for week-ahead and quarter-ahead EM bond returns.
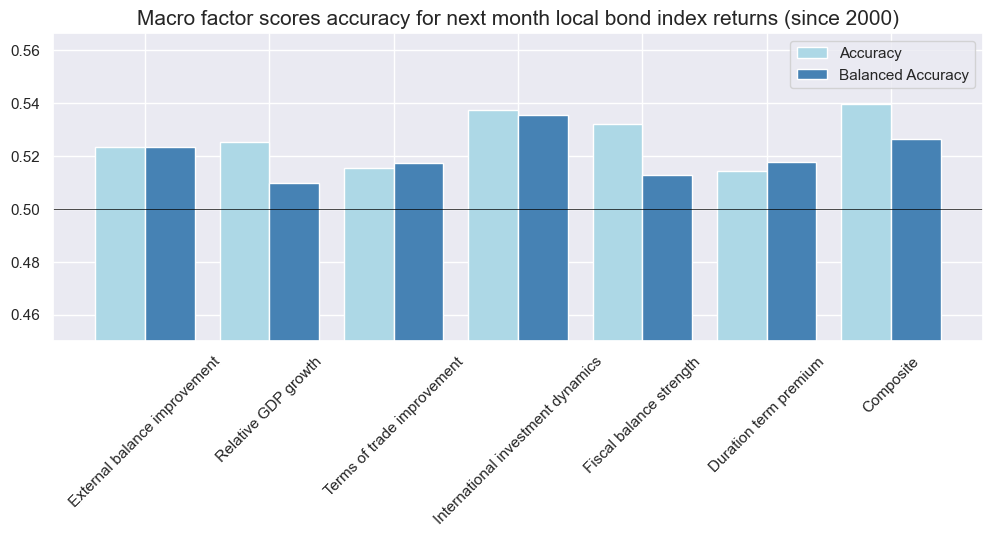
Test 2: Prediction accuracy
Accuracy measures the ratio of correctly predicted direction of period returns. Similarly, balanced accuracy measures the average ratio of correctly predicted positive and negative returns. The graph below shows monthly accuracy metrics for the six thematic factors and the composite macro factor score. For all scores and all metrics, the ratios have been above 50%. For the composite factor, monthly accuracy since 2000 has been 54%, while balanced accuracy has been 52.7%. Above-50% accuracy metrics are also recorded for all cases at a weekly or quarterly frequency. Quarterly accuracy is even higher than monthly accuracy, but naturally produces fewer trades.
Test 3: Simulated naïve PnLs
Finally, we assess the economic value of following the macro scores through a naïve PnL simulation, applying the standard rules used in Macrosynergy research. It is important to note that if macro factor scores have been selected or optimized with the benefit of hindsight, the resulting backtested PnLs are invalid. A fully valid backtest requires factor construction and selection through sequential machine learning or, as in the present case, the use of a simple equally weighted set of plausible factors.
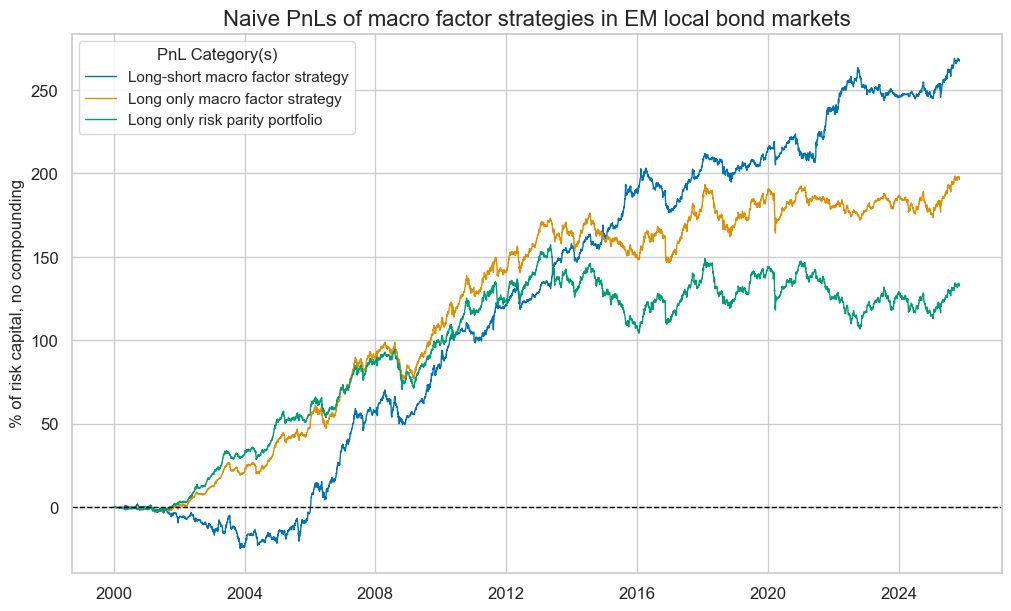
Naïve profit and loss series take positions in accordance with composite scores and regular rebalancing. In the present case, rebalancing occurs at a monthly frequency, which means that the end-of-month score determines the position of the next month, subject to a 1-day slippage for trading. A naïve PnL does not consider transaction costs or other risk management rules. Here we compare three PnLs.
- The first pertains to a long-short strategy that adjusts volatility-targeted positions based on the composite macro factor signal, with standard “winsorization” (capping and flooring) at two standard deviations.
- The second PnL applies to a long-only strategy that converts the factor score into a weight or leverage score for each tradable country. Specifically, scores are first capped and floored at one standard deviation, then increased by one. Consequently, volatility-targeted positions can range from zero to twice their usual size, but short positions are not allowed.
- Finally, as a benchmark, we display the PnL of a risk parity portfolio, which allocates equal volatility-based positions across all tradable countries.
The long-term Sharpe and Sortino ratios of a risk parity portfolio in EM local markets since 2000 would have been 0.5 and 0.7, respectively, comparable to international equity portfolios. Correlation with the S&P500 would have been 26%. Performance has been highly seasonal, with strong returns from 2000 to 2012 and no profits thereafter.
The consideration of macro scores in a long-only portfolio would have lifted the Sharpe and Sortino ratios to 0.8 and 1.1, respectively, i.e., increased risk-adjusted returns by over 50%. Also, seasonality was mitigated. A long-short portfolio would have produced performance ratios of 1.0 (Sharpe) and 1.5 (Sortino), while reducing S&P correlation to just 8% and showing much less seasonality.
Basic quantamental terminology
The following terms are used for quantamental data types:
- A macro-quantamental indicator is a metric that combines quantitative and fundamental analysis of the macroeconomy, such as an inflation trend or a government balance-to-GDP ratio. Values must be point-in-time information states, i.e., reflect that state of public knowledge at a timestamp. Here, public knowledge does not mean that everybody actually did know, but that everybody could have known what the data said.
- A macro-quantamental category is a time series panel of a macro-quantamental indicator for a set of countries and markets. For example, real-time annual GDP growth estimates across countries constitute a category. Validation of trading strategy principles often relies on categories rather than single indicators to enhance, drawing on the diverse experiences of multiple countries.
- A macro-quantamental factor is a combination of macro-quantamental indicators or categories. The combination is presumed to serve as a predictor of financial contract returns. For example, growth rates of various measures of economic activity may be combined into an “excess activity growth” factor, which is relevant to the performance of fixed-income or equity markets.
- Finally, a macro-quantamental signal is a combination of macro-quantamental factors and possibly other types of factors. The signal is designed to govern risk and positioning in a specific market. For example, an excess activity growth factor and an excess inflation factor in conjunction with real interest rates may be combined into a fixed-income trading signal.


