Terms of trade measure an economy’s ratio of export prices to import prices. Changes in these ratios drive divergences in economic performance across currency areas and influence foreign exchange and other asset market returns. Consequently, timely estimates of terms-of-trade dynamics, often derived from commodity prices, have long been valued as leading indicators by investors. Today, point-in-time versions of these measures provide a robust foundation for statistical analysis and backtesting of systematic strategies.
This post illustrates the trading value of real-time terms-of-trade changes through five simple strategies. Individually, such single-signal strategies yield only modest standalone performance ratios. However, their profit-and-loss streams are largely uncorrelated with major market benchmarks and only moderately correlated with each other. This suggests that, when applied systematically and across a broad set of markets, terms-of-trade dynamics can serve as a significant and independent source of true alpha in systematic macro trading.
The post below is based on Macrosynergy’s proprietary research. Please quote as “Sueppel, Elena and Sueppel, Ralph, ‘Terms of trade as trading signals,’ Macrosynergy research post, September 2025.”
A Jupyter notebook for auditing and replicating the research results is available for download here. The notebook operation requires access to J.P. Morgan DataQuery to download data from JPMaQS. Everyone with DataQuery access can download data except for the latest months. Moreover, J.P. Morgan offers free trials on the complete dataset for institutional clients. An academic support program sponsors data sets for research projects.
The basics of terms of trade
Conceptually, the terms of trade measure the price of a country’s exports of goods and services relative to the price of its imports. A terms of trade index is defined as the ratio of an export price index to an import price index. The sub-indices represent weighted averages of export or import prices relative to a designated base year. An increase in the overall index indicates an improvement in the terms of trade.
Terms of trade improvements (or deteriorations) are consequential for economic dynamics and monetary policy. Thus, by itself, an increase in export versus import prices translates into rising purchasing power of residents, outperformance of economic growth, positive shifts in external trade balances, and a stronger currency. The impact on local inflation and public finances is ambiguous. If the terms of trade increase due to rising export prices, fiscal revenues and inflation also increase, all other things being equal. If terms of trade rise due to declining import prices, fiscal revenues and inflation would diminish.
Terms of trade shocks refer to sudden, large, and unexpected changes in the relative prices of exports and imports. They are typically driven by sharp movements in global commodity prices and can create significant divergences in economic performance between net commodity exporters and net commodity importers. Adverse terms of trade shocks may also destabilize financial systems by eroding business profitability, disrupting capital flows, and forcing abrupt and substantial adjustments in exchange rate regimes.
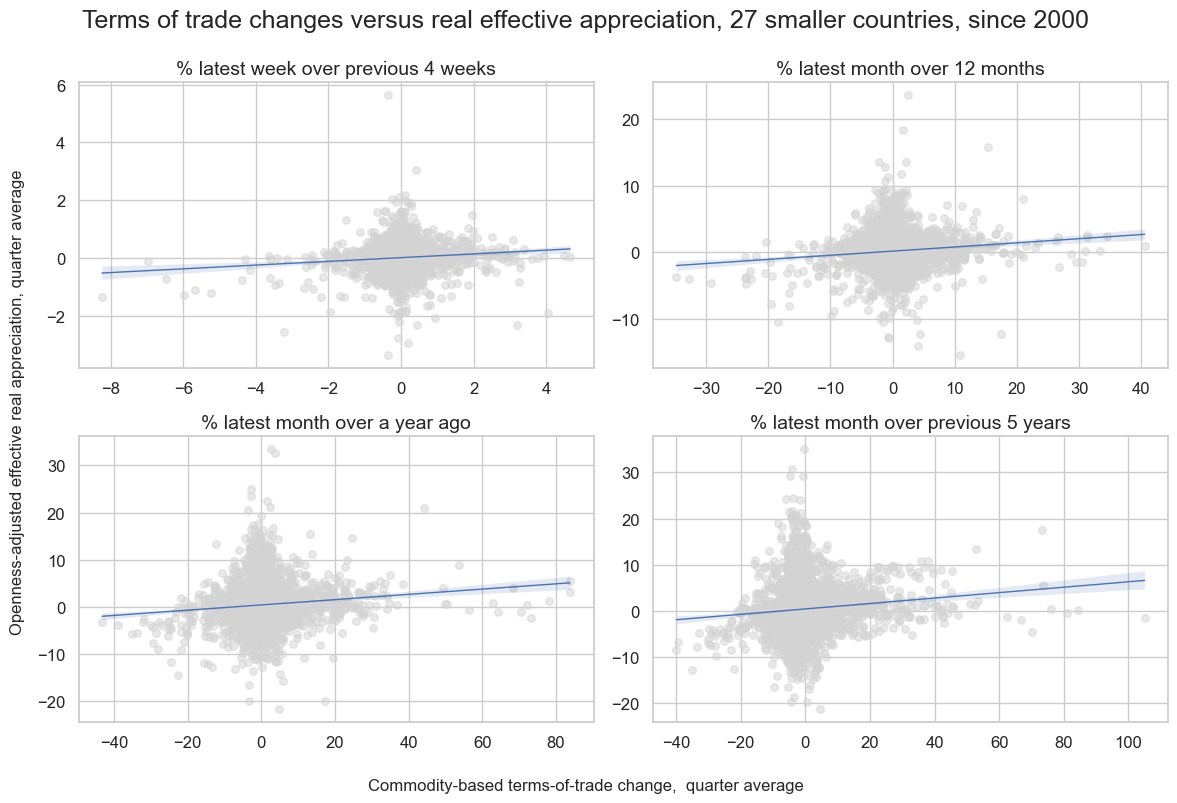
These stylized economic relationships help explain why, in markets characterized by information costs and rational inattention, changes in the terms of trade can predict asset returns. In isolation, an improvement in the terms of trade for a currency area should be associated with higher expected foreign exchange forward returns and stronger local equity market performance. However, there is an inherent positive relationship between terms of trade changes and movements in the real effective exchange rate. Consequently, the impact of terms of trade shifts on local markets is often evaluated in conjunction with effective exchange rate dynamics. As illustrated in the figure below, the correlation between commodity-based terms of trade changes and real effective exchange rate appreciation has been positive across both short- and long-term horizons.
How to use terms of trade data as trading signals
Many market participants already monitor the terms of trade for tactical decision-making. However, to systematically apply and backtest them as trading signals, it is essential to use point-in-time values as historical data. Point-in-time refers to the information actually available to the market on a given date, based on the most recent data series at that time. Economic time series often change over time due to data revisions and extensions, and these evolving datasets are commonly referred to as vintages.
Financial markets primarily focus on commodity-based terms of trade. These measures rely on prices and trade weights of standardized commodities, which can be updated in real time and observed at a daily frequency. In contrast, comprehensive terms of trade data are typically released with publication lags of several months. Moreover, non-commodity prices tend to exhibit much smaller short-term fluctuations.
The market has long relied on commodity-based proxies for terms of trade, such as the Citi Commodities COT Index. However, published series are often subject to revisions, reflecting updates to the weights of commodities in external trade and, at times, changes in the underlying price indices. As a result, terms of trade changes calculated using revised data may differ from those that market participants would have observed at the time of the original publication for a given period.
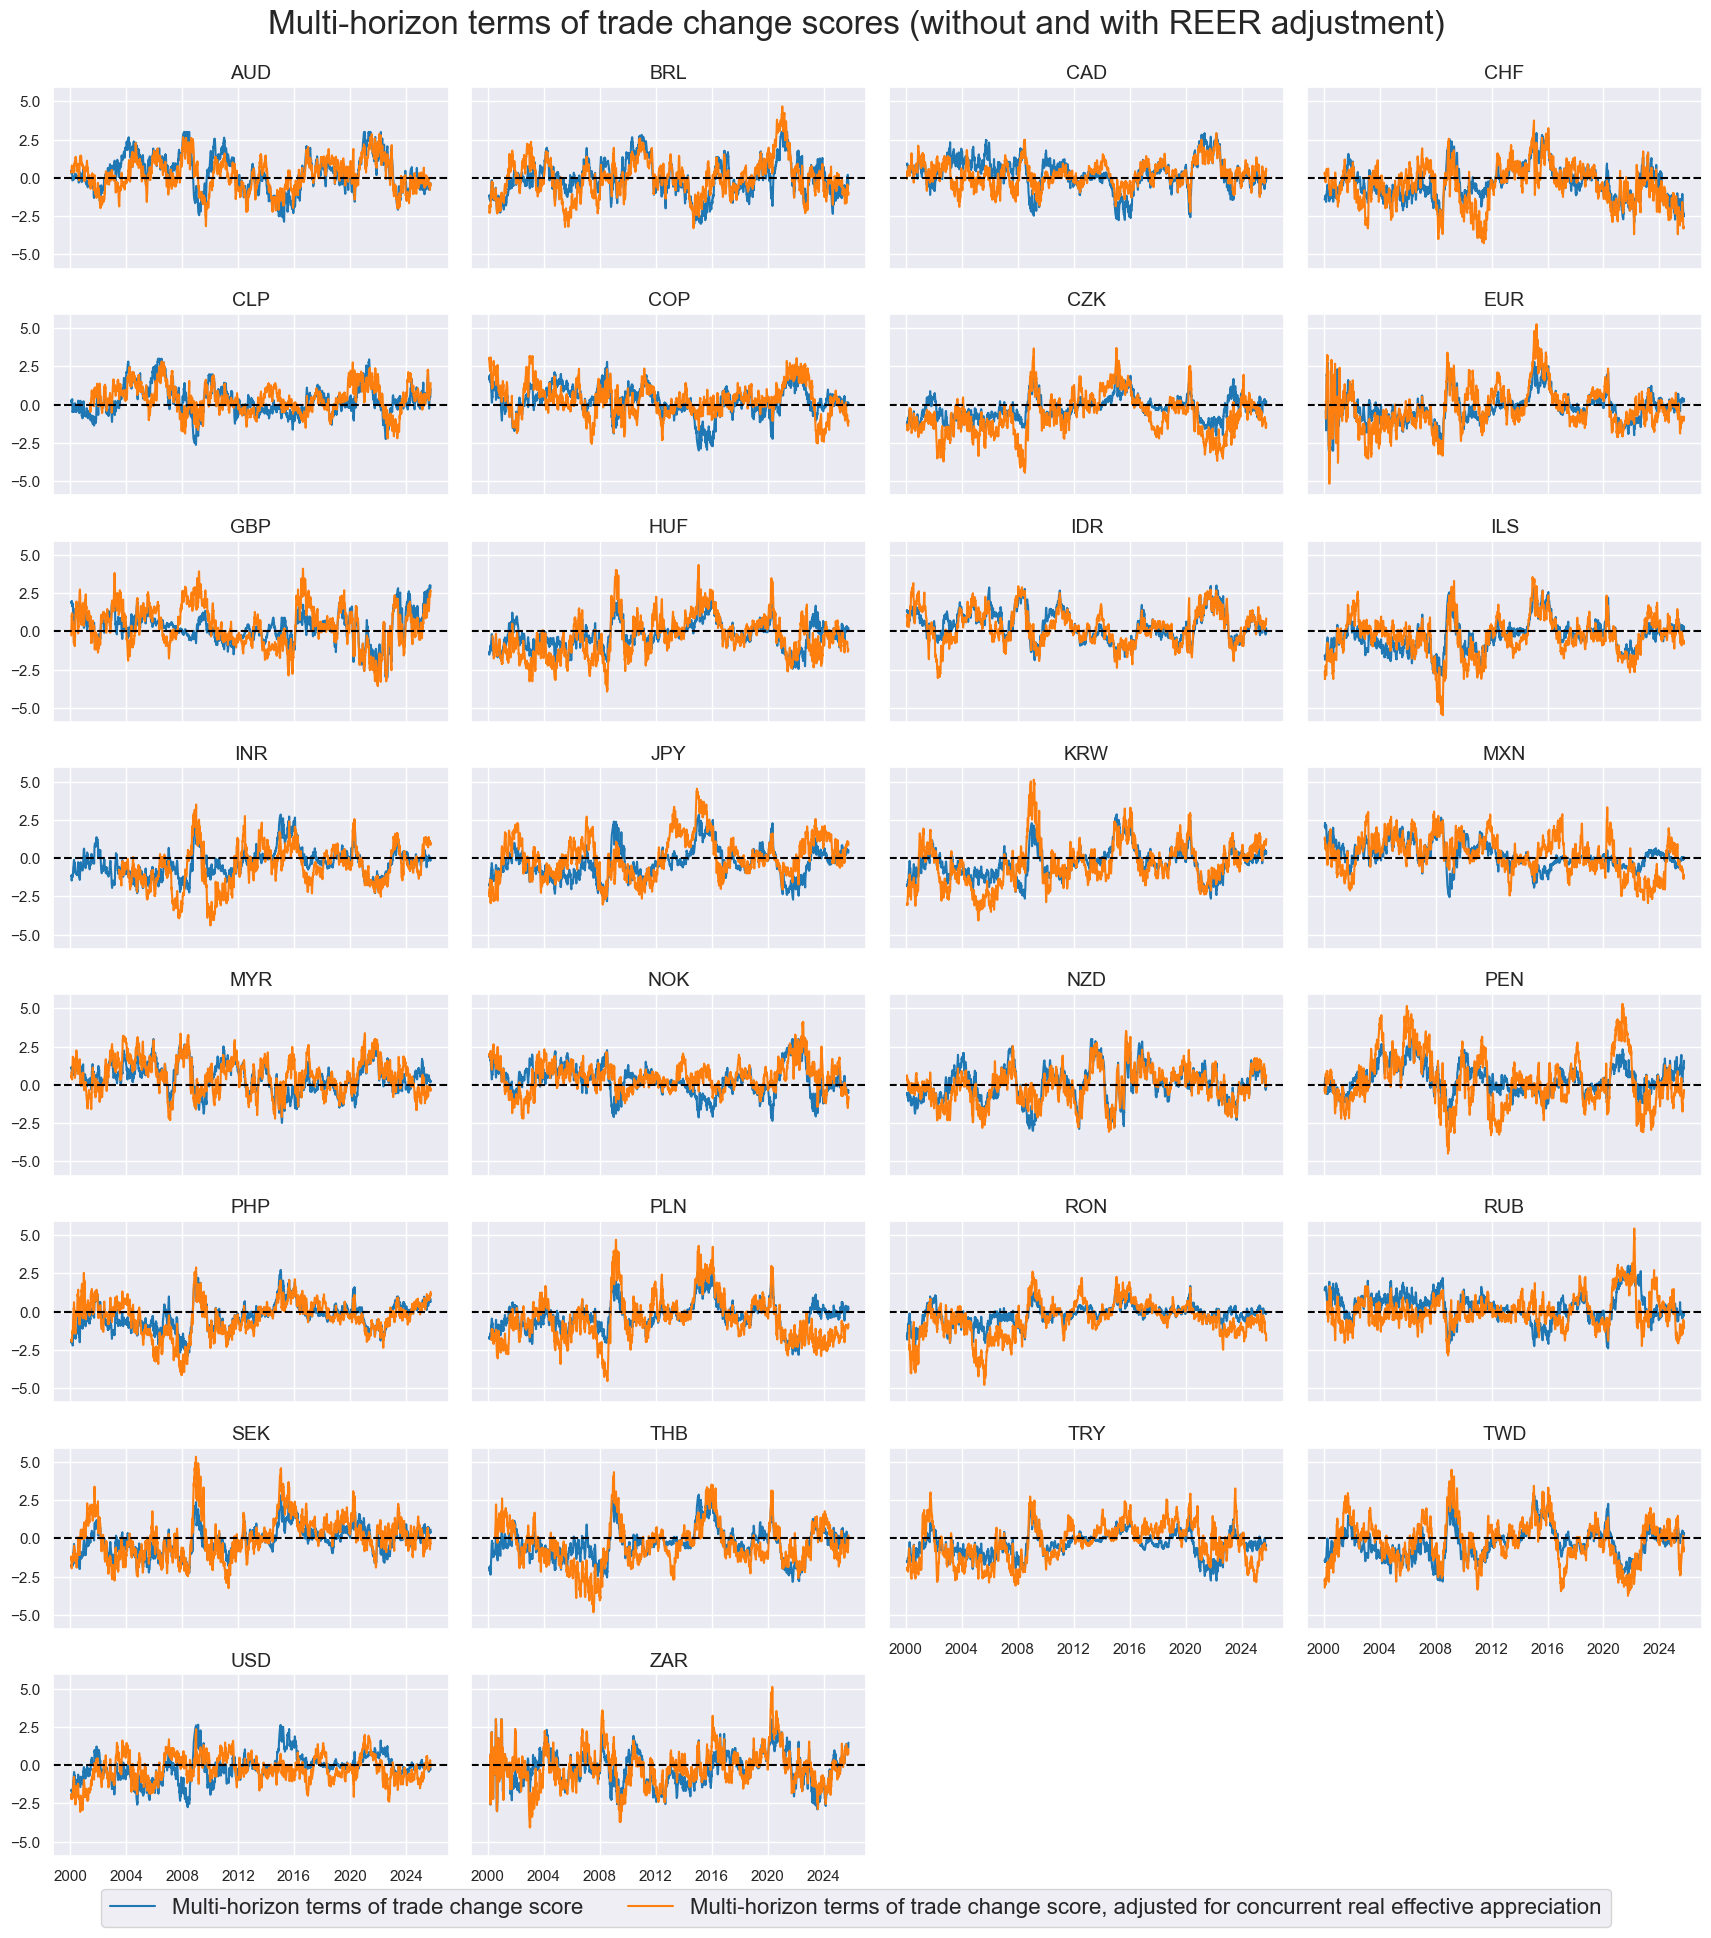
Point-in-time versions of commodity-based terms of trade dynamics are available on the J.P. Morgan Macrosynergy Quantamental system (documentation). They rely on approximate export and import price index dynamics, which are calculated on a daily basis based on concurrent vintages of commodity prices (in USD), commodity trade shares, and (as a non-commodity tradable USD goods’ price proxy) the U.S. core producer price index. The underlying vintages use commodity trade shares and related prices of liquidly traded commodity contracts. Since the range of traded contracts has broadened over time, so has the range of commodities that are used for point-in-time terms of trade dynamics. For this post, we look at different horizons of commodity-based terms of trade changes:
- Short-term changes are represented by the percentage change of the latest trading week, i.e., a 5-day period, over the previous four trading weeks.
- Medium-term trends are represented by the percentage change of the latest trading month, i.e., 21 days’ average, over the previous trading year average, i.e., 261 days’ average, and, as an alternative convention, the percentage change of the latest trading month over a year ago.
- Long-term shifts are represented by the percentage change of the latest month over the previous 5 years’ average.
For this post, we primarily use a simple average of terms of trade change scores over all the above horizons. This is achieved by first normalizing the percentage changes across all horizons, sequentially and centered around a zero mean, and then averaging the normalized scores. The benefit of using a simple average over all standard lookback horizons offered by JPMaQS is enhanced credibility of empirical results.
However, the multi-horizon signal is not always the most appropriate choice. For instance, when predicting local-currency equity returns, one must account for the offsetting effects of concurrent changes in effective exchange rates, which tend to reduce earnings in local currency terms. In such cases, it is advisable to consider openness-adjusted real effective exchange rate (REER) changes over the same lookback periods as those used for terms-of-trade changes (documentation). Effective exchange rates are trade-weighted indices that capture the impact of currency fluctuations through international trade linkages. The openness adjustment entails multiplying the rate of real appreciation by the ratio of merchandise exports and imports to GDP, reflecting that real appreciation exerts a stronger influence on more open economies. For equity strategy purposes, we define an “adjusted terms-of-trade change” as the difference between the terms-of-trade change score and the corresponding multi-horizon openness-weighted real appreciation score.
Also, for short-term tactical strategies, only a short-term signal is appropriate. This is the case, for example, for a global single position strategy in local equity and duration positions, or a “risk parity long-long” strategy, as described below, because that strategy relies on changes in the growth-inflation trade-off. A terms of trade measure could never predict medium-term or secular changes in that trade-off, as those depend on structural developments, such as economic policies. the exploration of natural resources and the rise and fall of industries.
Some simple trading strategy ideas
The purpose of this section (and the following) is to illustrate how a single type of point-in-time macro inflation can enhance trading value across a range of portfolios or strategies. We present five simple systematic trading ideas based on common sense and using solely terms of trade dynamics. The common origin of all ideas is standard macroeconomics combined with the assumption of some rational inattention of markets to terms of trade changes across multiple countries. For each idea, we present predictive statistics based on the broadest tradable set of markets, followed by stylized backtests in the subsequent section.
Terms of trade dynamics and directional FX forward positions
- Trade idea: The proposition is simply that improving terms of trade positively predict excess FX forward returns of long positions in the local currency one month ahead. This follows from standard economic theory, in conjunction with the market’s lack of systematic attention to terms of trade changes across all countries. The trading factor is the multi-horizon average terms of trade change score. The traded positions are volatility-targeted 1-month FX forwards (documentation) for 27 developed and emerging markets currencies versus their natural benchmarks. See the list of currencies and their benchmarks in Annex 1.
- Evidence: Across countries and time, there has been a positive forward correlation between end-of-month terms of trade change scores and subsequent monthly FX forward returns since 2000. The probability of significance has been 92% according to the Macrosynergy panel test. Monthly accuracy (ratio of correctly predicted direction returns) and balanced accuracy (average ratio of correctly predicted positive and negative returns) have been 51.3% and 51.5% respectively.
Relative terms of trade dynamics and relative FX forward positions
- Trade idea: The concept is similar to the previous strategy, except that this one employs relative terms-of-trade changes, i.e., changes in one currency area’s terms of trade relative to those of all 27 areas, as predictors of relative volatility-targeted FX forward returns. The main advantage of this approach is diversification: relative trades tend to be less correlated than simple directional trades because their common dependence on USD and EUR dynamics is largely removed. The drawback, however, is that expressing terms-of-trade changes in relative form amplifies estimation errors and increases the noise-to-signal ratio.
- Evidence: There has been a positive correlation between end-of-month relative terms of trade change scores and subsequent monthly relative FX forward returns since 2000, with a probability of significance of 91%. Monthly accuracy and balanced accuracy have been 50.6%.
Adjusted terms of trade dynamics and directional equity index future positions
- Trade idea: The hypothesis is that terms of trade improvements positively predict a country’s equity index future return in local currency terms unless there has been a strong concurrent real appreciation of the local currency. The presumed positive effect of terms of trade changes alone and the potential offsetting force of real effective exchange rate changes are both standard economic theories. Market inattention to such dynamics is even more plausible for equity derivatives than for FX. The traded factor is the adjusted terms of trade change score as described above. The traded positions are equity index futures in eight developed and ten emerging markets, as listed in Annex 2.
- Evidence: Across countries and time, there has been a strong positive forward correlation between end-of-month adjusted terms of trade change scores and subsequent monthly equity index future returns since 2000. The probability of significance has been 98%. Monthly accuracy and balanced accuracy have been 51.2% and 52.1% respectively.
Relative terms of trade dynamics and relative equity futures positions
- Trade idea: The rationale is analogous to the directional equity strategy, except that we now use relative adjusted terms of trade changes as predictors of relative local-currency equity index returns. This strategy removes most of the global directional equity risk. The traded futures are listed in Annex 2.
- Evidence: There has been a positive correlation between end-of-month relative terms of trade change scores and subsequent monthly relative equity index futures returns since 2000, with a probability of significance of 98%. Monthly accuracy and balanced accuracy have both been 51%.
Short-term terms of trade dynamics and global equity-duration risk parity returns
- Trade idea: Generally, the improvement of terms of trade should lead to a better growth-inflation trade-off for the local economy. This means that rising export to import prices affords higher economic growth for a certain inflation rate, or lower inflation for a certain economic growth rate. This, in turn, augurs well for returns on equity-duration risk parity “long-long” positions. This position allocates risk equally between equity and fixed income contracts, both in local currency terms. Equity risk can be taken through an index futures contract, and duration exposure can be taken through a fixed receiver position in an interest rate swap or a bond future. Risk parity means that positions in both asset classes are sized to equal expected volatility.
Naturally, returns on such risk parity conditions are highly correlated across countries, and events in larger countries, particularly the U.S., dominate those in smaller countries. Therefore, here we use a single global factor, which is the GDP-weighted average of terms-of-trade changes across all countries, based on USD GDP weights (documentation). Also, we only consider short-term terms of trade changes, i.e., the 1-week versus 4-week change, because terms of trade cannot plausibly explain the medium-term or structural growth-inflation trade-off of an economy. Analogously, this strategy trades a single global basket of equity-duration positions, which includes all the countries traded in the equity strategies (Annex 2). The duration positions are 5-year interest rate swap receivers or payers (documentation). - Evidence: There has been a strong positive correlation between end-of-month short-term terms of trade changes and subsequent monthly equity-duration risk parity returns since 2000, with a probability of significance of 98-99%. Monthly accuracy and balanced accuracy have been 50.8% and 51.1% respectively.
Assessing the broad trading value of terms of trade
Simulated PnLs of strategies with a single macro trading factor usually produce “ugly” backtests when viewed in isolation. “Ugly” here means low Sharpe and Sortino ratios, compared to what one is used to from a successful macro strategy, as well as great seasonality, i.e., concentration of value generation on a few episodes. That is because a single type of information is only sporadically the dominant force of a large liquid financial market and has to compete with many other influences for attention. In the present context, commodity-based terms trade changes can plausibly only produce value when commodity prices do post large changes and when they are not overshadowed by other powerful drivers.
However, the focus on performance ratios of a single strategy for a single factor misses the key criteria of the latter’s value. A factor’s general trading value depends on its scope of application and the uncorrelatedness of the generated returns. The key questions to ask are therefore the following:
- Can the factor be applied to multiple markets in a form that is additive to overall trading value?
- Is the stylized backtested PnL value generated by the factor correlated with major benchmarks or other factors?
By reviewing the five strategy ideas listed above, it is possible to address these questions regarding terms of trade factors.
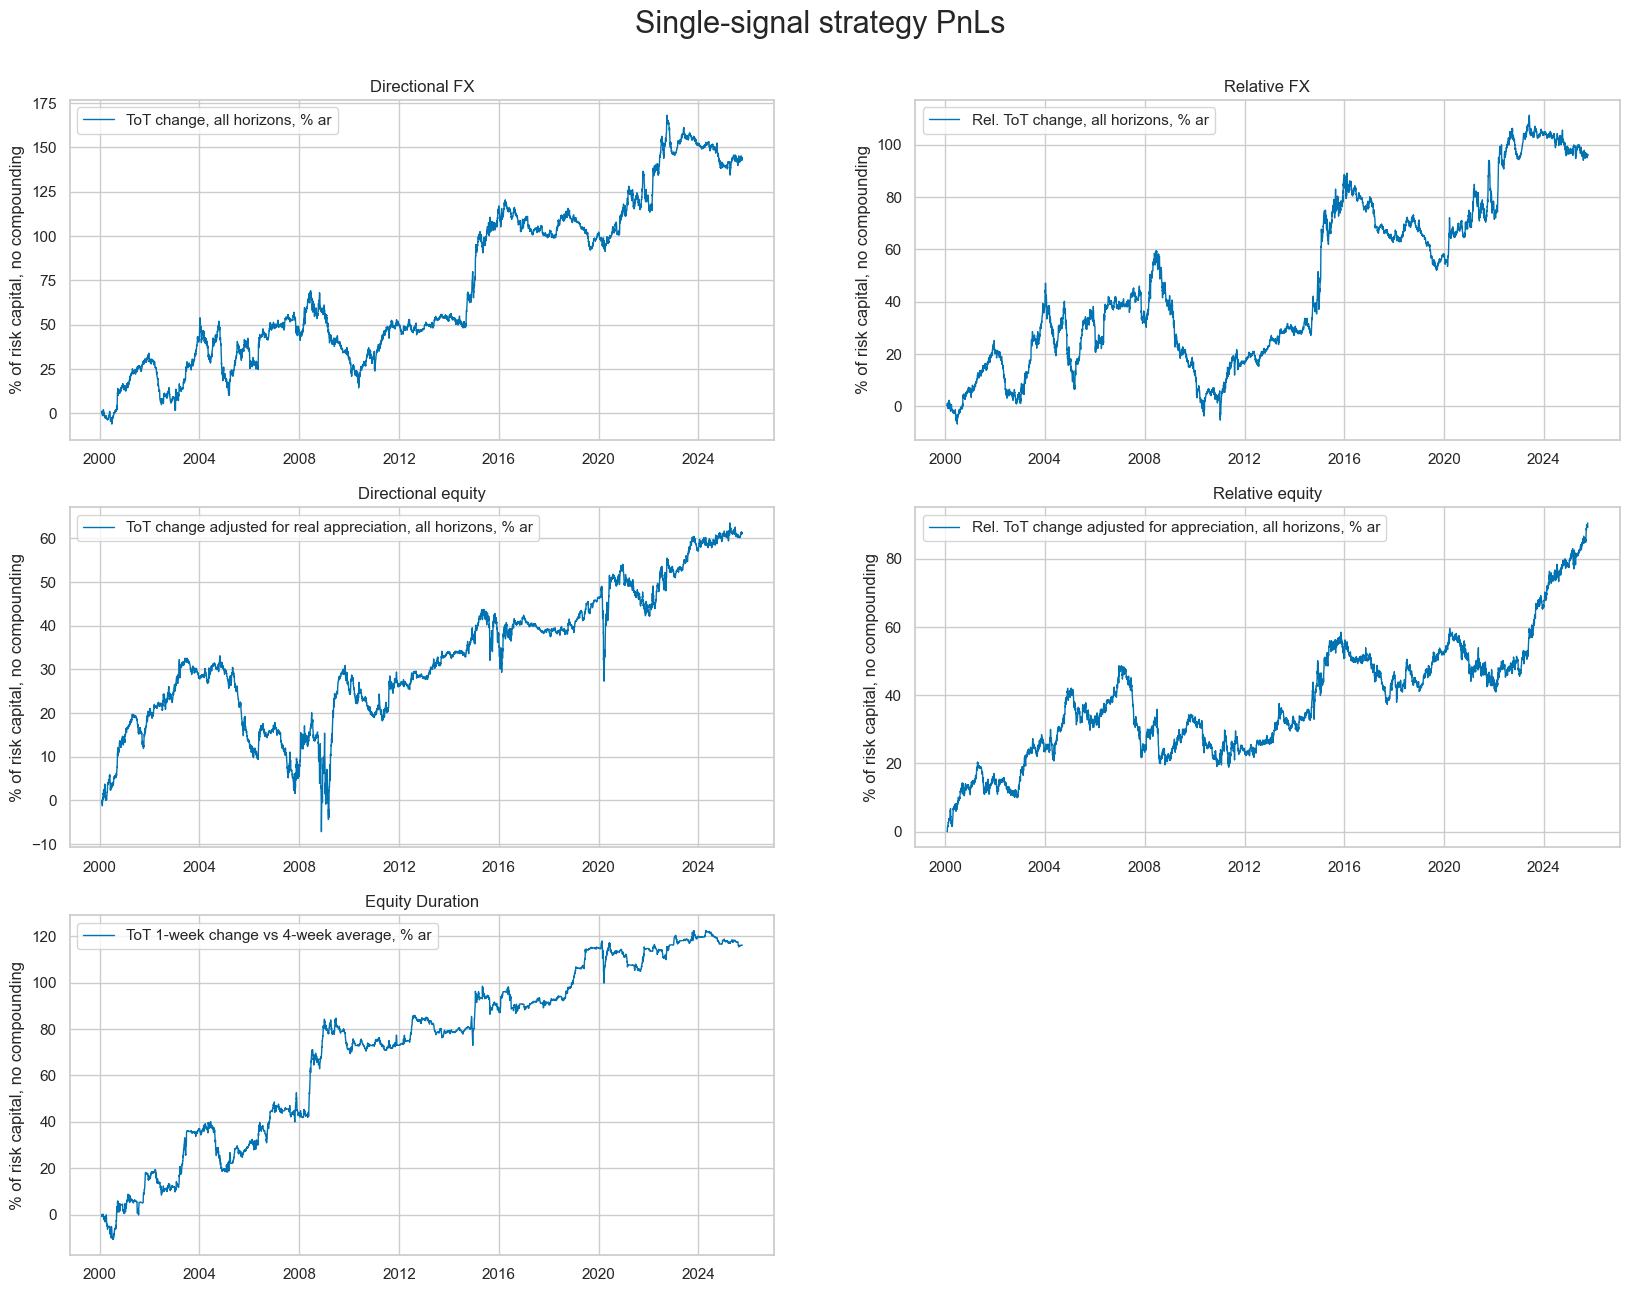
First, we create simply stylized PnLs according to the standard rules of Macrosynergy research posts. The terms of trade change score at the end of each month is re-normalized and used as a positioning signal for the following month. The normalization uses standard deviations estimated solely from past data, and caps values at ±2 to limit the impact of outliers. Positions are adjusted on the first trading day of each month and become effective after one trading day. This naïve PnL does not incorporate transaction costs or risk management rules.
Position sizes are determined by a leverage factor that translates normalized signals into USD positions for each market. Leverage here means the USD (million) position per unit signal per market. To make the PnL of different types of strategies comparable, leverage is set inversely to the number of markets that are traded, so that the expected USD amount is roughly equal. To be exact, the leverage factor is the square root of one divided by the number of traded markets for all strategies, except for the directional equity strategy, where we do not take the square root. That is because the equity positions are highly correlated. Altogether, the objective is to equalize the risk allocation to the different strategies without hindsight.
The 25-year risk-adjusted return ratios for all five strategies have been positive. Sharpe ratios have been modest and ranged from 0.3 for the relative FX strategy to 0.6 for the equity duration strategy. Sortino ratios ranged from 0.4 to 0.9. Importantly, none of the five strategies posted a strong correlation with the returns of any of the major market benchmarks, i.e., the S&P500, the 5-year USD duration return, or the EURUSD FX forward return. The highest correlation was between the directional equity strategy return and the S&P500 at 13%. All others are in a range of +/- 6%.
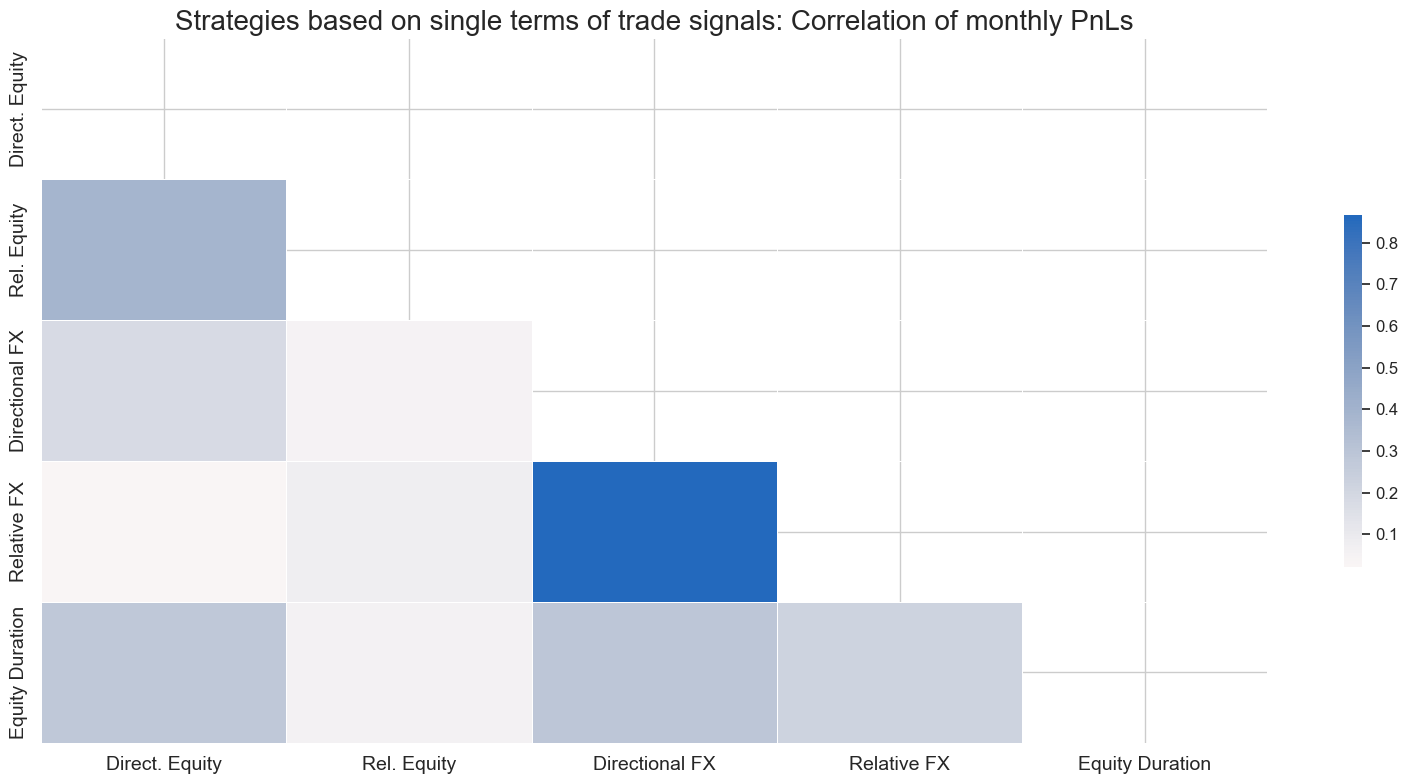
Moreover, correlations between strategy returns have been modest, given that they are based on very similar signals. Most linear coefficients have been well below 50%, with the notable exception of the two FX strategies. This suggests that material diversification benefits arise from the use of terms-of-trade-based signals across different strategies.
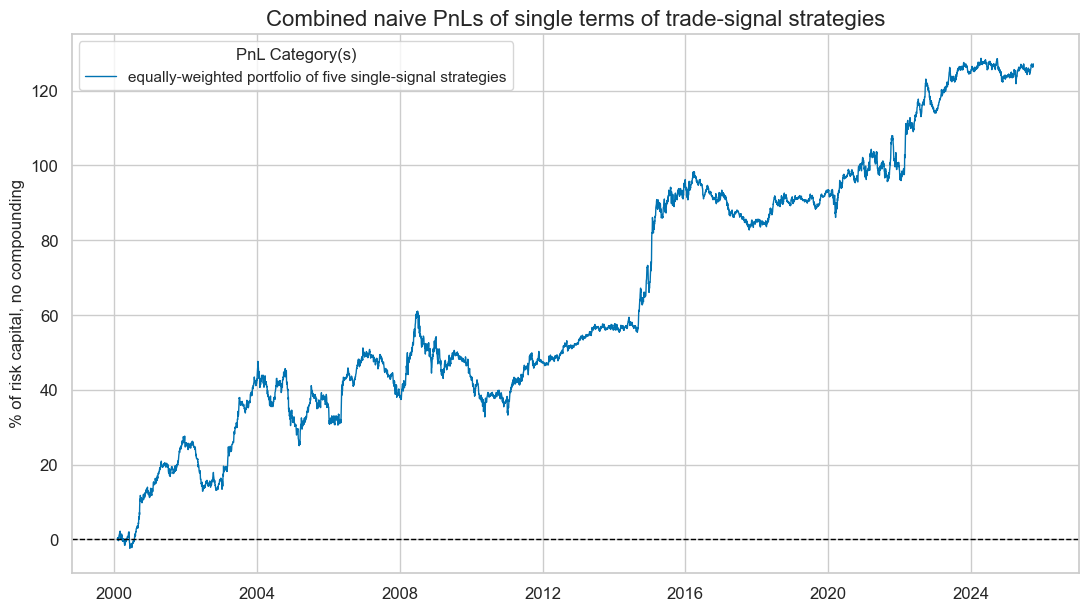
The chart below shows a composite PnL a book that allocates capital equally to all five strategies. To be sure, the composite PnL is not a valid backtest due to a selection bias; we have not considered potential failed strategies. A more scientific approach would have to be based on sequential machine learning. However, we have also disregarded other possible applications of terms of trade factors, such as for CDS trading or local-currency EM bond trading. Thus, it should be considered as a plausible simulation of the long-term trading value of terms of trade scores, if they are based on sound theory.
The long-term Sharpe ratio of the composite PnL has been 0.6, and the Sortino ratio 0.9. This is not negligible for a single factor, but also not impressive on its own. However, importantly, the correlation of the composite terms of trade returns with major FX equity and duration benchmarks has been near zero. This supports the hypothesis that terms of trade-based trading is additive to standard market risk and a true source of alpha.
Annex 1: Traded currencies in the FX strategies
The FX strategies trade 1-month forwards in the below currencies versus their natural benchmarks:
- DM currencies: the Australian dollar (AUD), the Canadian dollar (CAD), and the New Zealand dollar (NZD), against the U.S. dollar; the Swiss franc (CHF), the Norwegian krone (NOK), and the Swedish krona (SEK), against the euro; and the British pound (GBP) against an equally weighted basket of dollar and euro.
- EM currencies: the Brazilian real (BRL), the Chilean peso (CLP), the Colombian peso (COP), the Indonesian rupiah (IDR), the Israeli shekel (ILS), the Indian rupee (INR), the Korean won (KRW), the Mexican peso (MXN), the Malaysian Ringgit (MYR), the Peruvian sol (PEN), the Philippine peso (PHP), the Thai baht (THB), the Taiwanese dollar (TWD) and the South African rand (ZAR), all against the U.S. dollar; the Czech koruna (CZK), the Hungarian forint (HUF), the Romanian leu (RON), and the Polish zloty (PLN), against the euro; and the Russian ruble (RUB) and Turkish lira (TRY) against an equally weighted basket of dollar and euro.
Annex 2: Traded index futures in the equity-related strategies
The FX strategies trade eight developed market local-currency index futures and ten emerging market local-currency index futures. The developed market indices are (in alphabetical order of currency symbol):
- AUD: The S&P/ASX 200 is the primary index for the Australian equity market. It measures the performance of the 200 largest companies by market capitalization listed on the Australian Stock Exchange (ASX).
- CAD: The S&P/TSX 60 Index is designed to represent the large-cap segment of the Canadian equity market. It includes 60 of the largest and most liquid companies listed on the Toronto Stock Exchange (TSX).
- CHF: The Swiss Market Index (SMI) is Switzerland’s premier stock market index, representing the 20 largest and most liquid companies listed on the SIX Swiss Exchange.
- EUR: The EURO STOXX 50 Index is a leading stock market index for the euro area, representing the 50 largest and most liquid blue-chip companies from 11 Eurozone countries.
- GBP: The FTSE 100 Index is a stock market index representing the 100 largest publicly listed companies by market capitalization on the London Stock Exchange (LSE).
- JPY: The Nikkei 225 Stock Average Index is a prominent stock market index in Japan, representing 225 of the largest and most liquid companies listed on the Tokyo Stock Exchange (TSE).
- SEK: The OMX Stockholm 30 (OMXS30) Index is a major stock market index in Sweden, representing the 30 most traded large-cap companies listed on the Nasdaq Stockholm exchange.
- USD: The S&P 500 Composite Index is one of the most widely followed stock market indices in the world, representing 500 of the largest publicly traded companies in the United States. (Note that even though the U.S. is about twice the size of the euro area, the market capitalization of the S&P500 has been roughly ten times that of EURO STOXX.)
The emerging market indices are:
- BRL: The Brazil Bovespa Index, also known as the Ibovespa is the main stock market index in Brazil, representing the performance of the most actively traded companies on the B3, the São Paulo Stock Exchange.
- INR: The CNX Nifty (50) is the flagship stock market index of the National Stock Exchange of India. It represents the weighted average of 50 of the largest and most actively traded stocks spanning 13 sectors of the Indian economy.
- KRW: The KOSPI 200 Index is a major stock market index in South Korea, representing the performance of the 200 largest and most liquid companies listed on the Korea Exchange (KRX).
- MXN: The Mexico IPC, often referred to as the Bolsa Index, is the main stock market index in Mexico. It tracks the performance of the 35 largest and most liquid companies listed on the Mexican Stock Exchange.
- MYR: The FTSE Bursa Malaysia KLCI (Kuala Lumpur Composite Index) is the main stock market index in Malaysia. It tracks the performance of the 30 largest companies by market capitalization listed on the Bursa Malaysia
- PLN: The Warsaw General Index 20 comprises the 20 largest and most liquid companies listed on the Warsaw Stock Exchange (WSE) in Poland.
- SGD: The MSCI Singapore (Free) Index represents the performance of the Singapore equity market through a free float-adjusted market capitalization-weighted index.
- THB: The Bangkok SET 50 Index is a major stock market index in Thailand, representing the 50 largest companies listed on the Stock Exchange of Thailand.
- TWD: The Taiwan Stock Exchange Weighted Index (TAIEX) is the main stock market index in Taiwan. It tracks the performance of all listed companies on the Taiwan Stock Exchange.
- TRY: The BIST 30 Index is one of the leading stock market indices of Turkey, tracking the 30 largest and most liquid companies listed on Borsa Istanbul.
- ZAR: The FTSE/JSE Top 40 Index is a key stock market index in South Africa, representing the 40 largest companies listed on the Johannesburg Stock Exchange (JSE) by market capitalization.


