Macro risk premia compensate investors for bearing broad economic uncertainty. For systematic strategies, these premia can be approximated by the difference between market-implied risk and risk implied by fundamental macroeconomic data. In the emerging market sovereign credit space, market-implied risk is represented by credit spreads and ratings, while fundamental risk factors may include government finances, external and investment balances, foreign-currency debt, political stability, medium-term economic growth, and inflation.
Macro risk premium scores, derived from this comparison, capture variations in premia paid across time and countries. Applied to 24 sovereigns over the past 25 years, these scores show significant positive predictive power for volatility-targeted returns on U.S. dollar-denominated bond indices. Compared to strategies based solely on market risk metrics, those guided by macro risk premia de-emphasize “reach for yield” behavior and deliver superior risk-adjusted returns. Moreover, the long-term performance of relative cross-currency allocations suggests that sovereign risk premia could serve as a robust foundation for adjusting bond index weights.
The post below is based on Macrosynergy’s proprietary research. Please quote as “Regis, Glenn and Sueppel, Ralph, ‘Estimating emerging markets sovereign risk premia,’ Macrosynergy research post, July 2025.” The post extends and complements the research of a previous article (“EM sovereign bond allocation with macro risk premium scores“).
A Jupyter notebook for auditing and replicating the research results can be downloaded here. The notebook operation requires access to J.P. Morgan DataQuery to download data from JPMaQS. Everyone with DataQuery access can download data except for the latest months. Moreover, J.P. Morgan offers free trials on the complete dataset for institutional clients. An academic support program sponsors data sets for research projects.
Practice and theory of macro risk premia
A risk premium refers to the excess expected returns that compensate investors for bearing uncertainty regarding their payoff. A macro risk premium compensates investors for the losses that arise from macroeconomic risks. These risks are pervasive but are not often systematically monitored or traded. Practically, a macro risk premium can be estimated as the difference between macroeconomic risk as priced in markets and its representation in the form of point-in-time economic indicators. A helpful concept for this purpose is macro risk premium scores, which are normalized differences between market-implied risk scores and macro-quantamental risk scores.
- Market-implied risk scores are normalized indicators of financial market assessments of risk, such as sovereign credit spreads or ratings. Normalization—adjusting for historical means or medians and standard deviations—must be performed sequentially to ensure that only information available up to the real-time date is used, thereby avoiding look-ahead bias.
- Macro-quantamental risk scores represent normalized point-in-time information states of economic indicators related to the probability of fundamental losses, such as a creditor’s default. The term “quantamental” refers to meaningful quantitative-fundamental indicators whose relevance is supported by theory and experience. “Point-in-time” means that for each day in history, the indicator displays the latest publicly available updated value of the underlying concept. Such data are available from the J.P. Morgan Macrosynergy Quantamental System (“JPMaQS”).
Macro risk premium scores estimate the price-value gaps of financial contracts, both relative to historical benchmarks and in comparison with one another. Combining market and macroeconomic information offers a structured, intelligent approach to leveraging quantitative date, often yielding more substantial and reliable value than unstructured uses of the individual data sets. The importance of clear theoretical priors is illustrated by the simple credit risk model presented below.
We assume that the expected annualized loss of default or restructuring of a credit contract over a specific forward period is a linear function of fundamental risk factors:
- Et means rational expectation formed based on public information at the end of period t,
- LossiT means annualized default-related loss on contract i until a future maturity date (T),
- RFit is a vector of default risk factors of contract i, and
- b is a corresponding vector of strictly positive coefficients translating risk factors into annualized expected losses.
Further, we assume that the compensation for default risk in the market depends not only on expected losses but also on specific premia for individual types of risk and a general excess premium for the contract.
![]()
- RCit is the market-implied annual compensation for default risk at the end of period t. In credit markets, these could be indicated by credit spreads or ratings indices.
- rpit is a vector of risk premia associated with the set of default risk factors, whereby premia are time-variant and can principally be positive or negative. Risk premia can change over time depending on investor risk aversion or salience of information, i.e., exaggeration or underestimation of specific risk factors as a consequence of fluctuations in fears and attention.
- eit is a positive or negative contract-specific premium that is not related to the default risk factors but represents influences such as financial regulation or market liquidity.
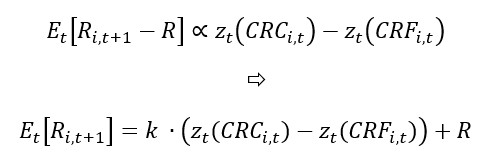
This implies that the expected excess return of a credit contract i (Rit), which is the difference between annual risk compensation and default-related losses, is equal to factor risk premia times risk factor values, and the general premium charged by creditors of the contract:
![]()
Naturally, risk premia are not directly observable. However, the above reasoning implies that, over the long run and across various contracts, excess risk premia should be proportionate to the differences between the normalized scores of market-implied compensation and those of the underlying risk factors. Here, ‘excess’ refers to values that exceed the long-term average premia for the asset class. Intuitively, a high market compensation score combined with a low risk factor score suggests an elevated risk premium and a positive expected return. Conversely, a low market compensation score alongside a high risk factor score indicates a low or even negative risk premium.
for
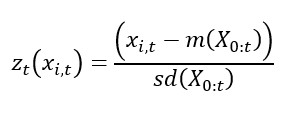
- zt is a function that returns normalized values of risk compensation metrics and risk factors based on information available up to period t,
- CRCit is a composite metric of market risk or market compensation,
- CRFit is a composite metric of default (macro) risk factors,
- R is a long-term average premium paid for normal risk levels,
- m() and sd() are mean (or median) and standard deviation functions, and
- X0:t is a full data panel of composite market or macro risk indicators, across contracts and time up to the current period.
Using the difference between market and macro risk scores offers a practical approach to estimating macro risk premia. However, this simplicity comes with limitations. Most notably, the method relies on a representative and sufficiently long history of risk indicators for both market-implied and macro-based risks. Without this, estimates may be skewed or dominated by omitted factors. Additionally, a zero score difference is not necessarily a neutral signal for investment. If “normal” macro risk carries a positive risk premium—as is likely for contracts exposed to undiversifiable risk—then a zero in the score difference could still imply positive expected returns. Therefore, the score difference is best interpreted as a measure of excess risk premium, rather than an exact threshold between positive and negative expected returns. The latter would require an estimate of the long-term average risk premium, which will be addressed in a future post.
Sovereign credit risk scores for emerging markets
Here, we calculate macro risk scores related to foreign currency-denominated sovereign credit in emerging markets. This is done for 24 countries that are a subset of the EMBI global and have been eligible for the index for at least part of the sample period 2000-2025.
- Latin America: Brazil (BRL), Chile (CLP), Colombia (COP), Dominican Republic (DOP), Mexico (MXN), Peru (PEN), and Uruguay (UYU).
- Emerging Europe: Hungary (HUF), Poland (PLN), Romania (RON), Russia (RUB), Serbia (RSD), and Turkey (TRY).
- Middle East and Africa: United Arab Emirates (AED), Egypt (EGP), Nigeria (NGN), Oman (OMR), Qatar (QAR), South Africa (ZAR), and Saudi Arabia (SAR).
- Asia: China (CNY), Indonesia (IDR), India (INR), and the Philippines (PHP)
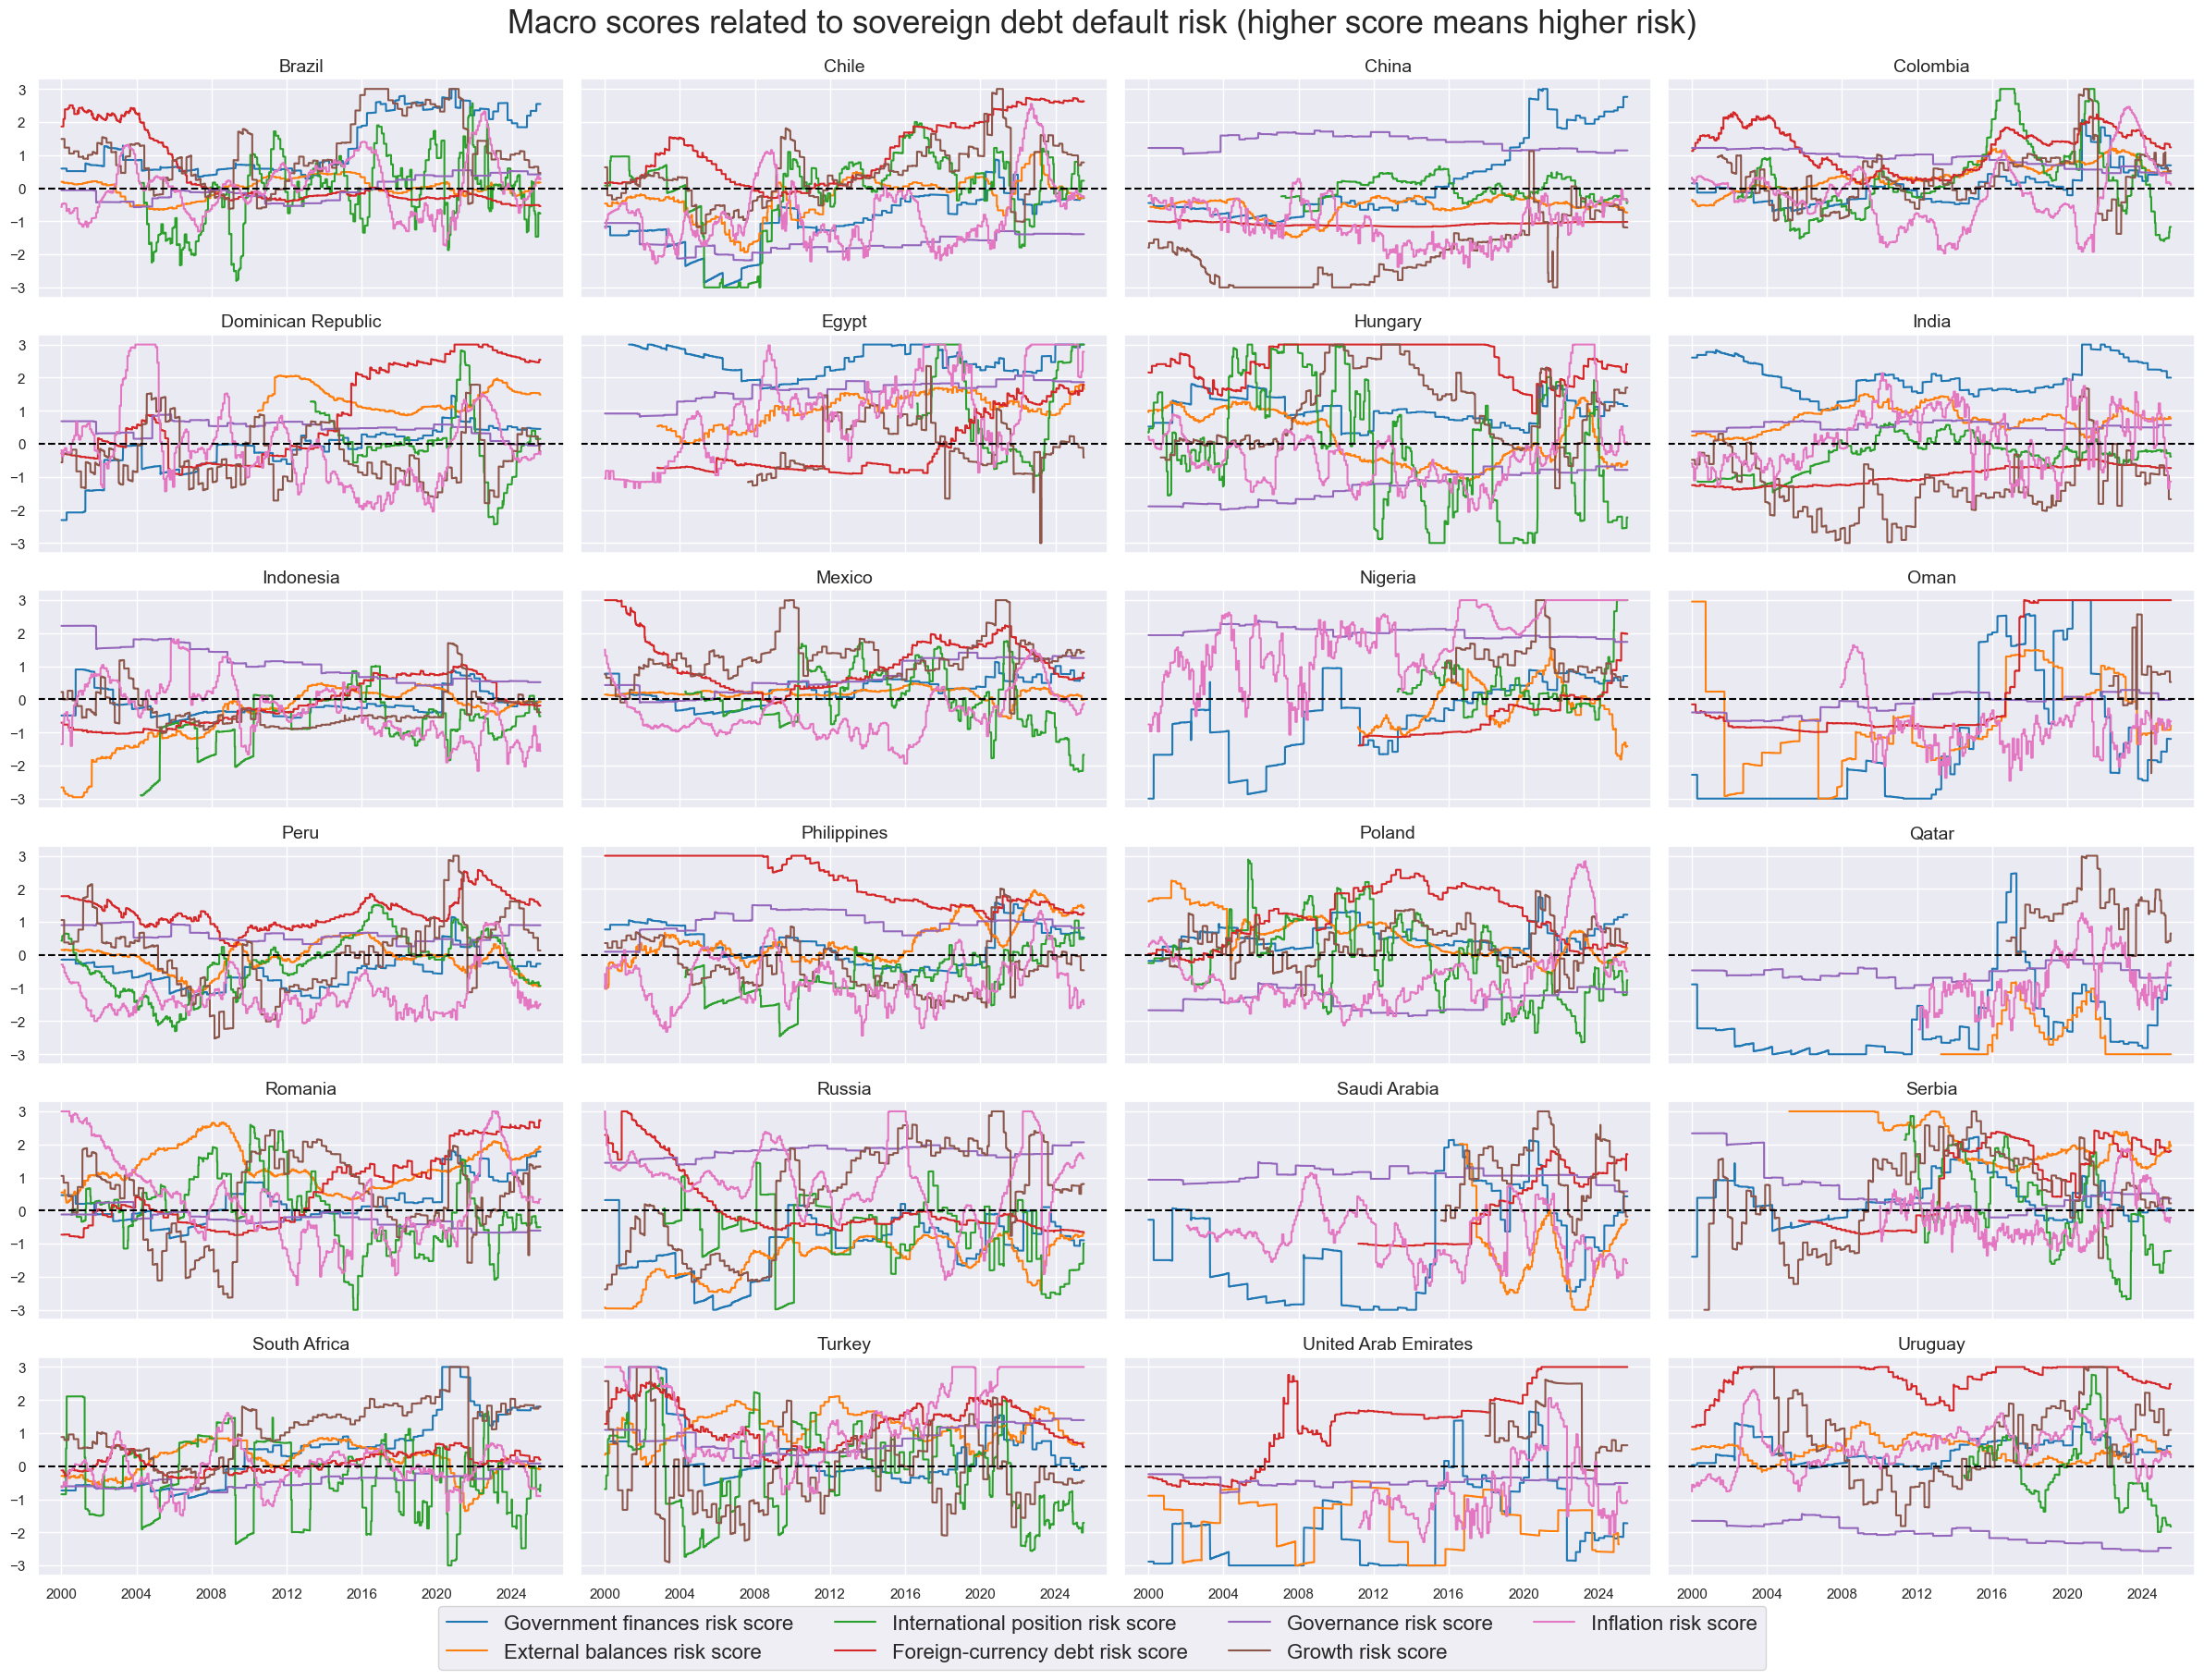
As macro risk factors, we consider seven types of quantamental categories that are often monitored by EM sovereign debt investors:
- For general government finance risk, we use the general government balance as % of GDP for the current and next year, as well as the general government debt of the current year as % of GDP (documentation here). All else equal, lower balances, i.e., lower surpluses or higher deficits, and higher debt ratios imply a higher debt servicing burden and increase sovereign default risk.
- For external balance risk, we use the merchandise trade balance and the broader external current account, both as % of GDP and 12-month average (documentation here). All else equal, lower balances, i.e., smaller external surpluses or higher external deficits, increase the risk of currency depreciation and related surges of external debt servicing costs relative to local-currency tax revenues. Thereby, lower external balance ratios translate into higher sovereign default risk.
- For international investment risk, we observe medium-term trends in cross-border investment positions. These include the difference between the latest net international investment position as % of GDP and its 2-year and 5-year moving averages, and the difference between the latest international liabilities ratios to GDP and their 2-year and 5-year moving averages (documentation here). Declining net investment positions and rising liabilities point to growing dependence on foreign funding and rising vulnerability to sudden stops or reversals. Such vulnerability increases the risk of default across the economy.
- For foreign debt sustainability, we look at the foreign-currency debt of all issuers of a country as % of GDP and at the foreign-currency debt of the general government as % of GDP. Here, foreign-currency debts are liabilities denominated in a currency other than the domestic currency (documentation here). The higher the foreign-currency debt stock, the greater the vulnerability to exchange rate fluctuations and the cost of debt servicing. Both factors increase the risk of debt distress or default.
- For political stability and governance risk, we look at the governance scores of Transparency International and World Bank surveys. As a representative set we use indicators of government accountability, political stability and corruption control (documentation here). The poorer the governance of a country the higher the risk of instability and default.
- For economic growth-related risk, we use 5-year moving averages of real GDP growth. Persistently weaker growth typically translates into greater financial, economic, and political risk (documentation here).
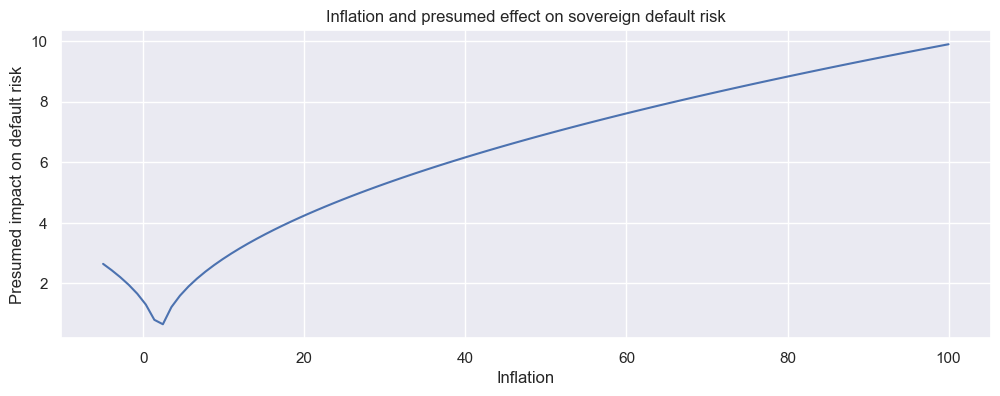
- For inflation-related risk, we monitor core and headline CPI inflation (documentation here). To account for the two-sided and non-linear impact of inflation on financial stability—where incremental changes have diminishing marginal effects at higher inflation levels—we use the square root of the deviation of inflation rates from the conventional 2% target of developed markets. Both elevated inflation and deflation are considered sources of financial instability and, consequently, contribute to increased sovereign default risk.
To compute macro risk scores, all indicators are first normalized sequentially using the median and standard deviation of the full panel—that is, all country time series values available up to a given point in time. To reduce the influence of outliers, values are capped at three standard deviations in both directions. Subsequently, indicator signs are adjusted so that a higher score consistently reflects higher macroeconomic risk.
The panel below displays the evolution of the seven macro risk scores over time, with higher values indicating higher fundamental risk. All factor scores are highly autocorrelated, and some more structural factors maintain positive or negative values for a decade or longer. Missing timelines reflect that non-disclosures and poor data quality exist for some countries and periods. For interpretation, consider the example of India: government finance risk has been exceptionally high throughout the past 25 years. Additionally, governance and external balance-related risks have been mostly on the high side. By contrast, the country’s high economic growth and low foreign-currency debt ratios have produced low risk scores in these categories. Finally, the net international investor positions and inflation performance have shown a changing risk contribution over time.
 A composite macro risk score is a re-normalized average of the seven conceptual risk factor scores. If some factors are missing, the composite is formed from the remaining ones, regardless of the number of factors present. This can lead to breaks in series and differences in content across countries, but principally replicates the information state of the market. When faced with missing indicators, investors must assess risk based on the available ones.
The panel below displays composite sovereign credit risk scores. A score of 1 indicates that, based solely on available macro indicators, a country’s sovereign risk is one standard deviation above normal, i.e., on the riskier side by historical and international standards. For example, in the case of India, composite macro risk has generally remained close to normal, with notable elevations during periods following the Global Financial Crisis, the European sovereign debt crisis, and the COVID-19 pandemic.
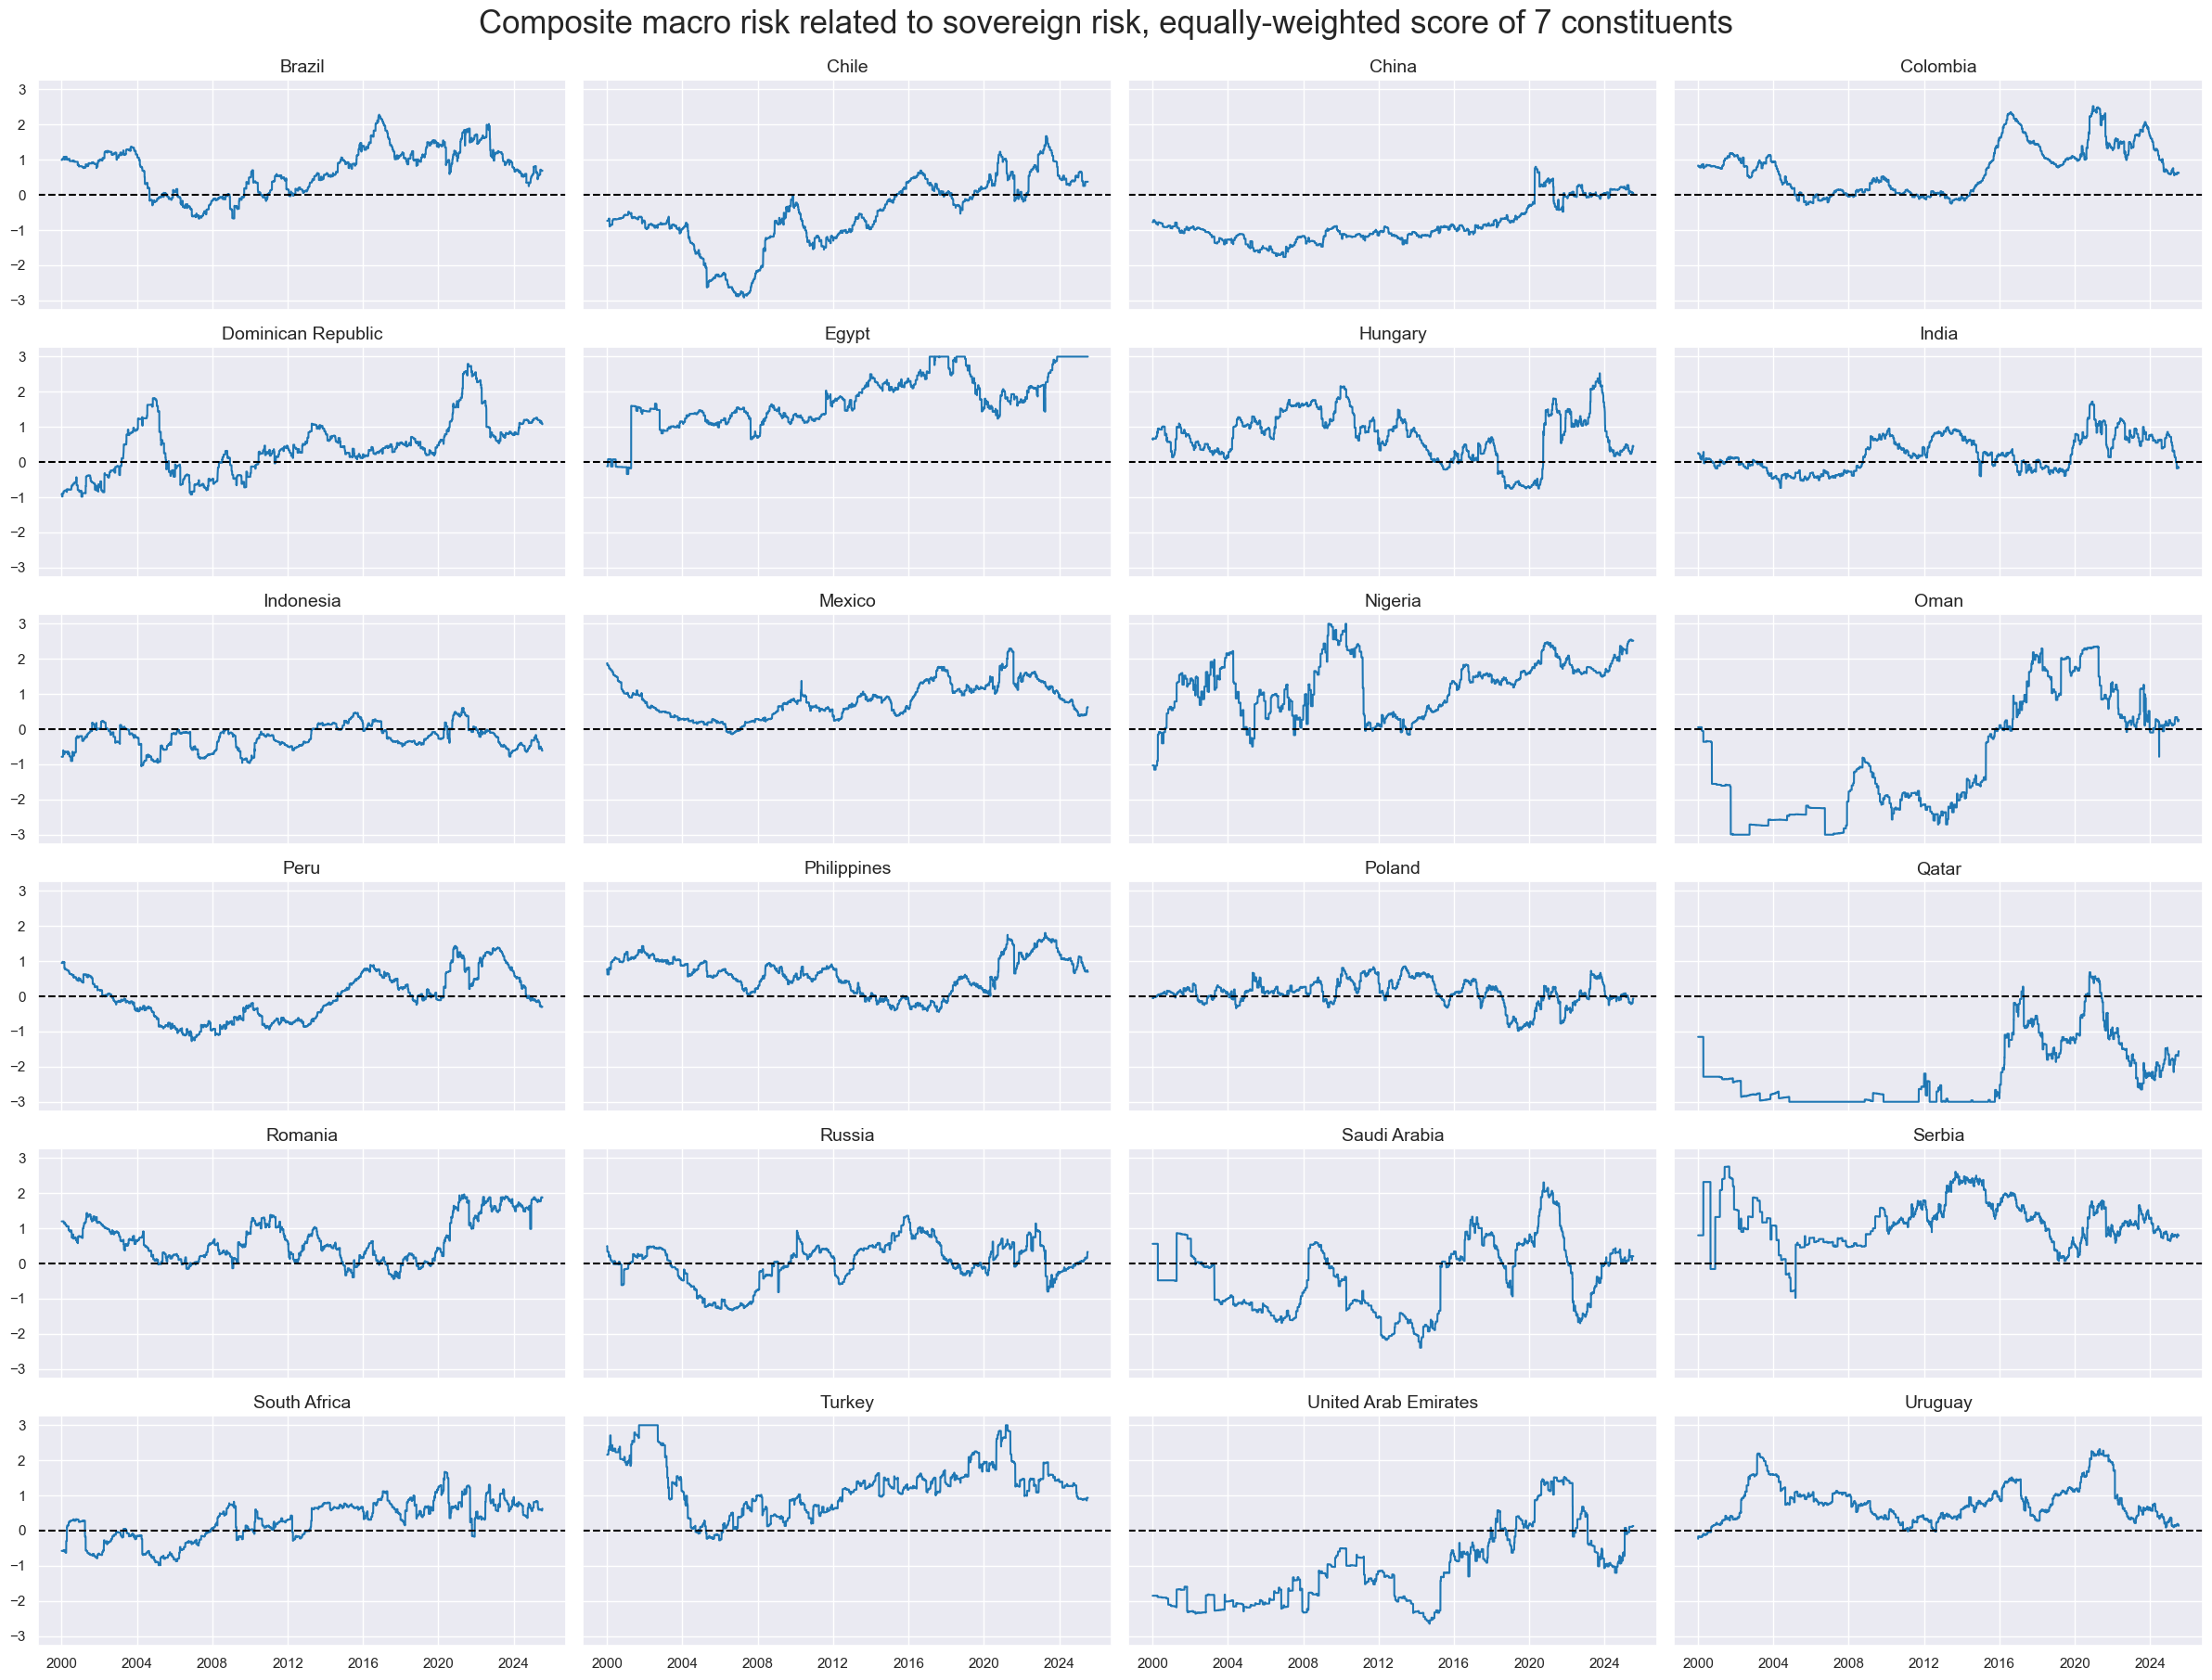
A notable feature of the macro risk scores is their long bias, reflected in a high proportion of positive values. From 2000 to mid-2025, nearly two-thirds of the scores across 24 countries have been positive. This pattern arises from two key factors. First, macro risks have generally trended higher over time in several categories, causing z-scores—calculated using expanding samples—to be biased upward. Second, there is a mathematical effect: when averaging several independent variables with high positive ratios, the resulting average tends to have an even higher positive ratio than the individual components.
Market risk scores
We approximate the market’s required compensation for sovereign credit risk by two metrics, with complementary strengths:
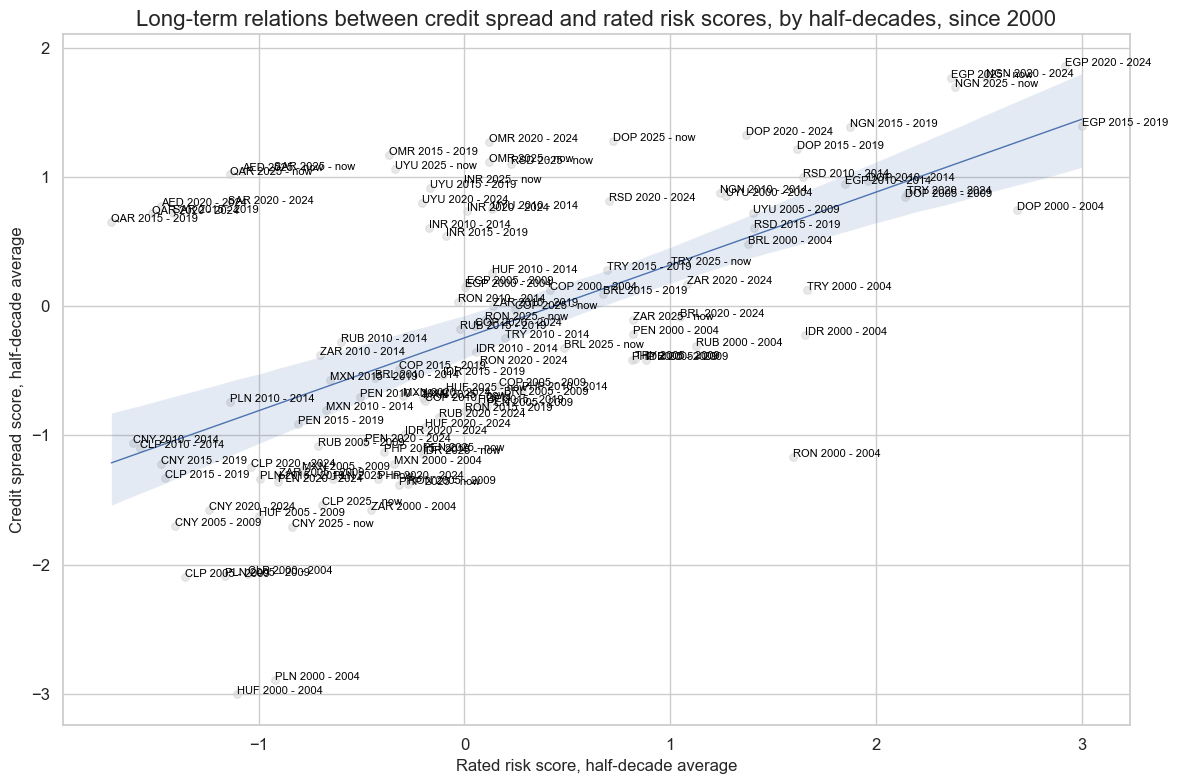
- Log sovereign spread scores are normalized natural logarithms of 5-year credit default swap (CDS) spreads (documentation here) using medians and standard deviations of the 24-country panel up to each point in time. As for macro factors, the scores are winsorized at three standard deviations. For the ten sovereigns without a liquid CDS market, spreads are approximated by the foreign-currency bond index carry (documentation here). Logarithms are used because credit spreads tend to increase more than proportionally with rising default probability. This is due to the convex relationship between spreads and default risk, and is akin to option pricing. The non-linearity is also evident in the empirical relationships between sovereign credit spreads and both ratings and macro risk indices in our 24-country data panel.
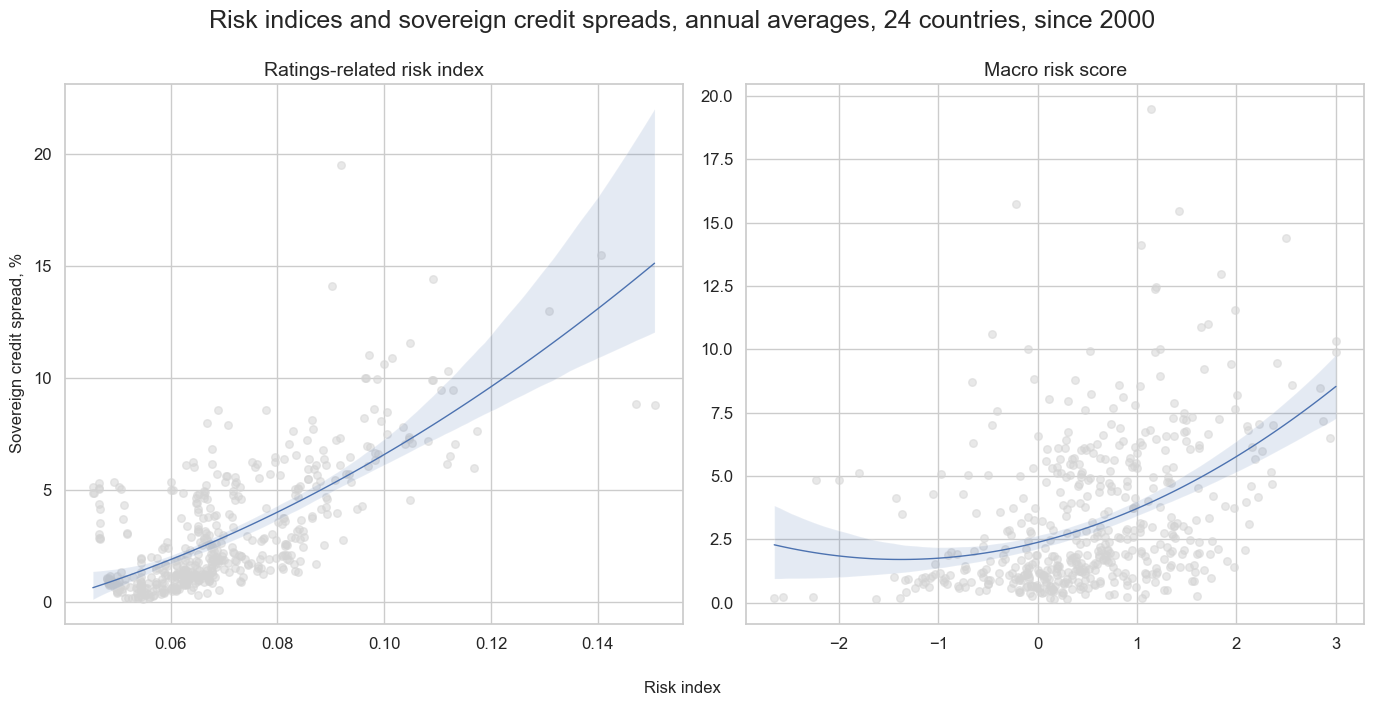
- Ratings scores are based on long-term foreign-currency sovereign credit rating indices. These indices are calculated as weighted averages of ratings and outlook data of Fitch, S&P, and Moody’s (documentation here). The values go from 1 to 23, with a higher value indicating a better rating. However, for the purpose of risk scores, we have inverted numeric values so that higher values indicate higher risk, analogously to spreads.
Spread- and ratings-based market risk scores offer complementary strengths. Spreads are more reflective of absolute risk premia and are responsive to short-term market dynamics. However, they are not always based on equivalent instruments across countries, and their reliability can be affected by liquidity constraints. In contrast, credit ratings are highly standardized and comparable across countries, but they tend to adjust to market developments very slowly. This distinction suggests that spread-based scores are better suited for directional trading, while ratings-based scores are more appropriate for cross-country relative positioning. Notably, over the long term, there has been a strong, nearly linear relationship between log-transformed spread scores and ratings scores.
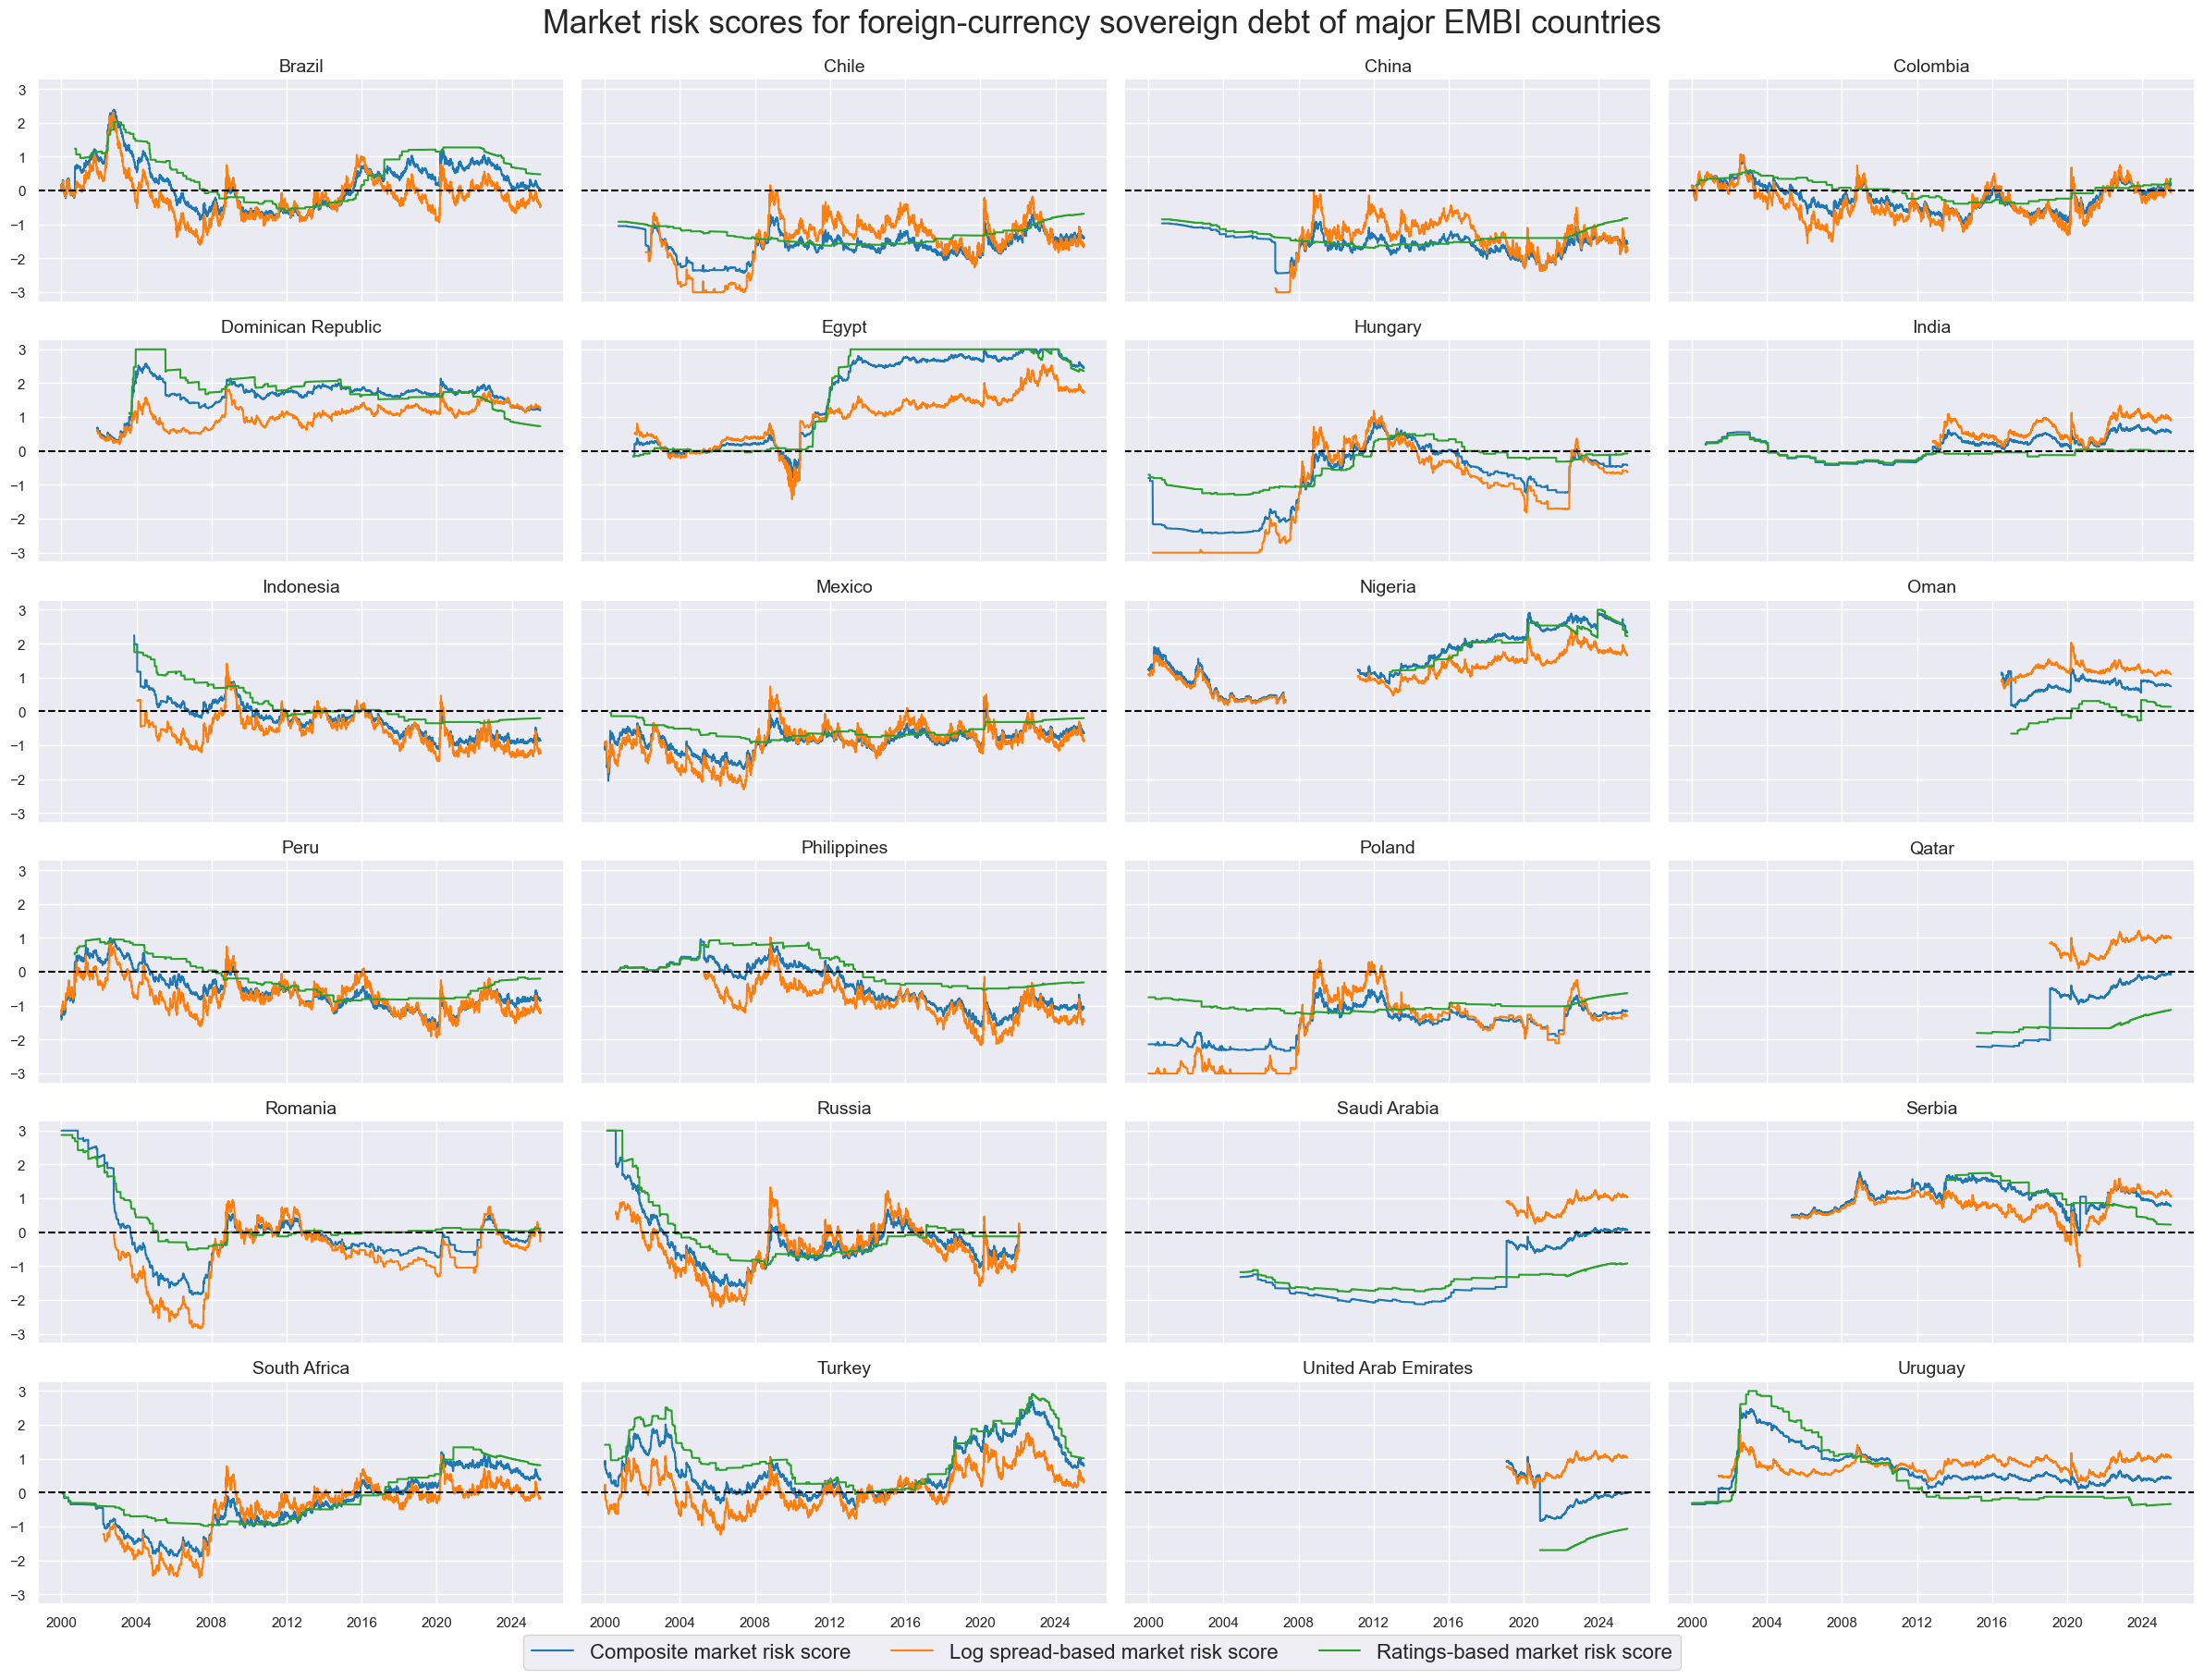
We calculate composite market risk scores as re-normalized averages of spreads and ratings-based macro risk scores. They are displayed in the panel below. Some countries only have shorter or interrupted histories. When only one of the two sub-scores was available, the other would have been used to represent the composite. This has led to jumps, particularly in some Middle East credits. Generally, market risk scores have been highly autocorrelated and posted long periods of positive or negative values, emphasizing their semi-structural nature.
Risk scores, reach for yield, and fake alpha
Theory and empirical evidence suggest that credit markets compensate investors with a premium that is proportionate to the value at (default) risk. In other words, weaker credits must not only offer higher spreads but also tend to deliver higher returns per unit of invested capital, at least over the long run. This default risk premium enables investment managers to enhance portfolio returns simply by tilting allocations toward lower-rated sovereigns. Such behavior exemplifies the well-known phenomenon of “reaching for yield.”
Naturally, this strategy comes with heightened exposure to defaults and the potential for sharp mark-to-market drawdowns during credit crises. However, since defaults and major crises are relatively rare, this form of “reach for yield” primarily generates what can be described as “fake alpha”—that is, returns arising from systematic risk exposure that is not fully captured by broad market benchmarks (view post here).
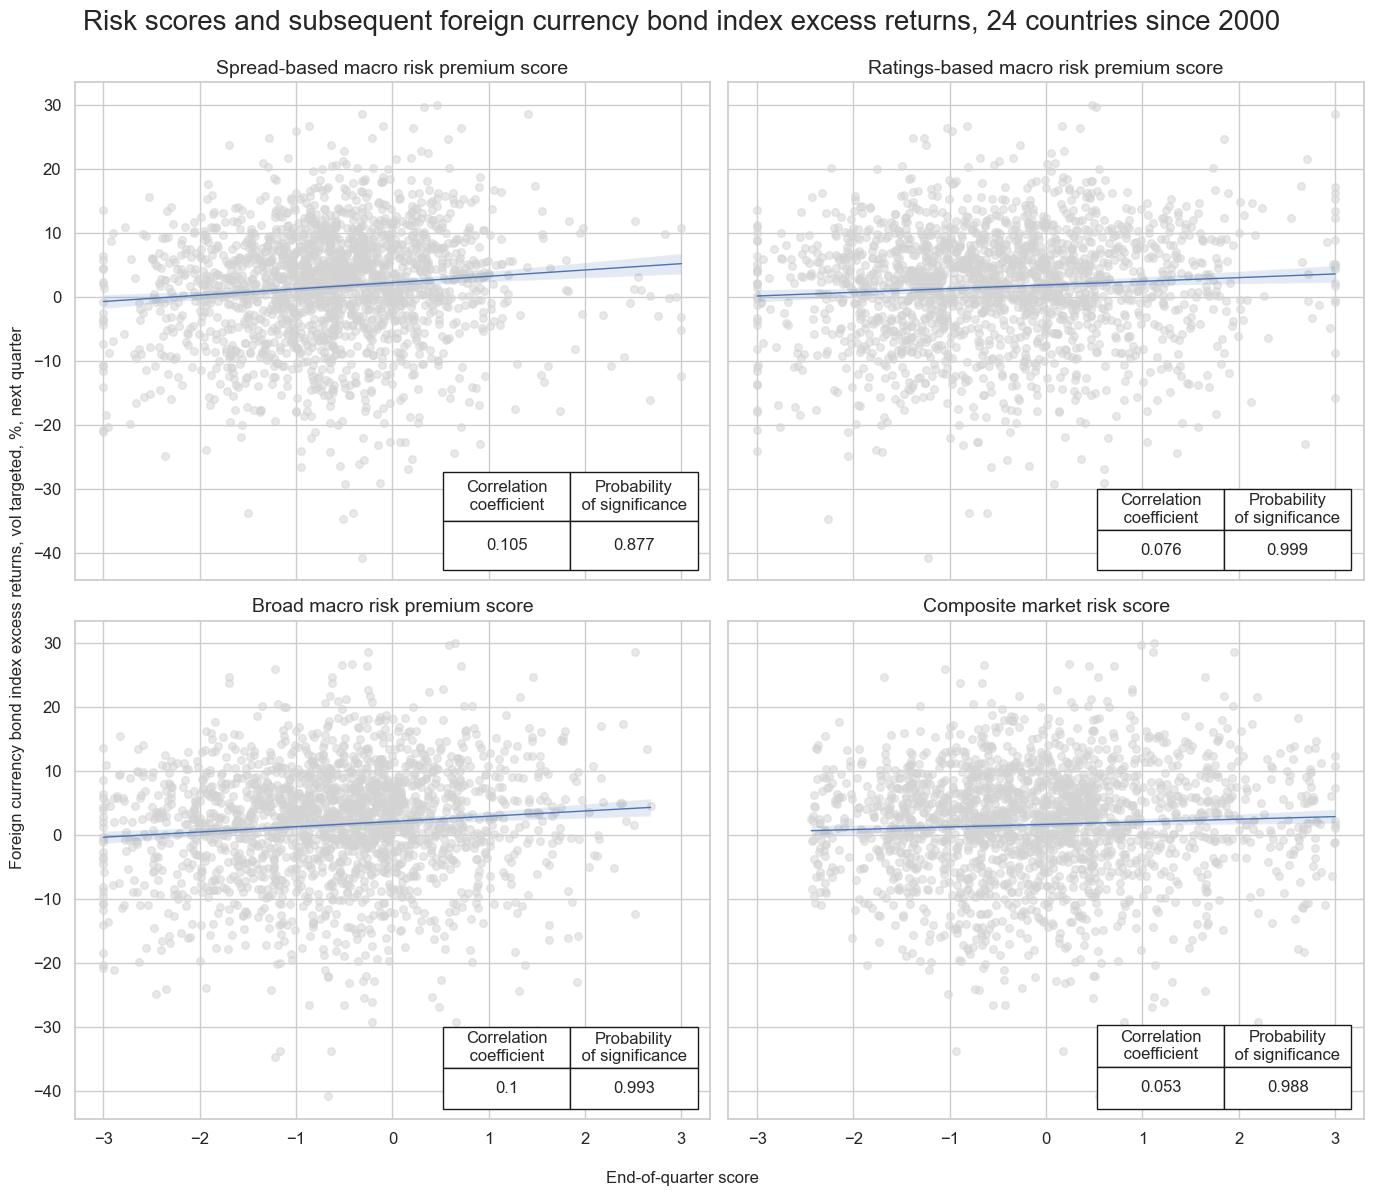
Fake alpha is not only a moral hazard for asset managers but also impedes the understanding and implementation of true value generation in systematic sovereign credit strategies. This is illustrated by the below set of regression scatterplots.
- The top-left regression plot shows that, for the panel of 24 emerging market sovereigns, there has been a highly significant positive correlation between market risk scores and sovereign bond index returns since 2000. No consideration of actual economic risk is required to obtain good predictions of returns on notional positions. In fact, the bottom-left plot shows that there has even been a significant positive relationship between macro risk scores and subsequent returns. Bad credits, by the standards of macro indicators, have yielded higher notional annual returns. This relation is at the heart of moral hazard.
- The empirical findings change, however, when we examine the right-hand regression plots, which illustrate the relationships between risk scores and volatility-adjusted returns. Volatility adjustment scales positions by statistical risk and diminishes the advantage of reaching for the worst credit, thereby increasing exposure during crisis times. There is still positive predictive power of market risk scores, as the risk premium is pervasive, but the correlation has dropped by more than half. More importantly, the macro risk score now has a negative predictive relation with subsequent returns.
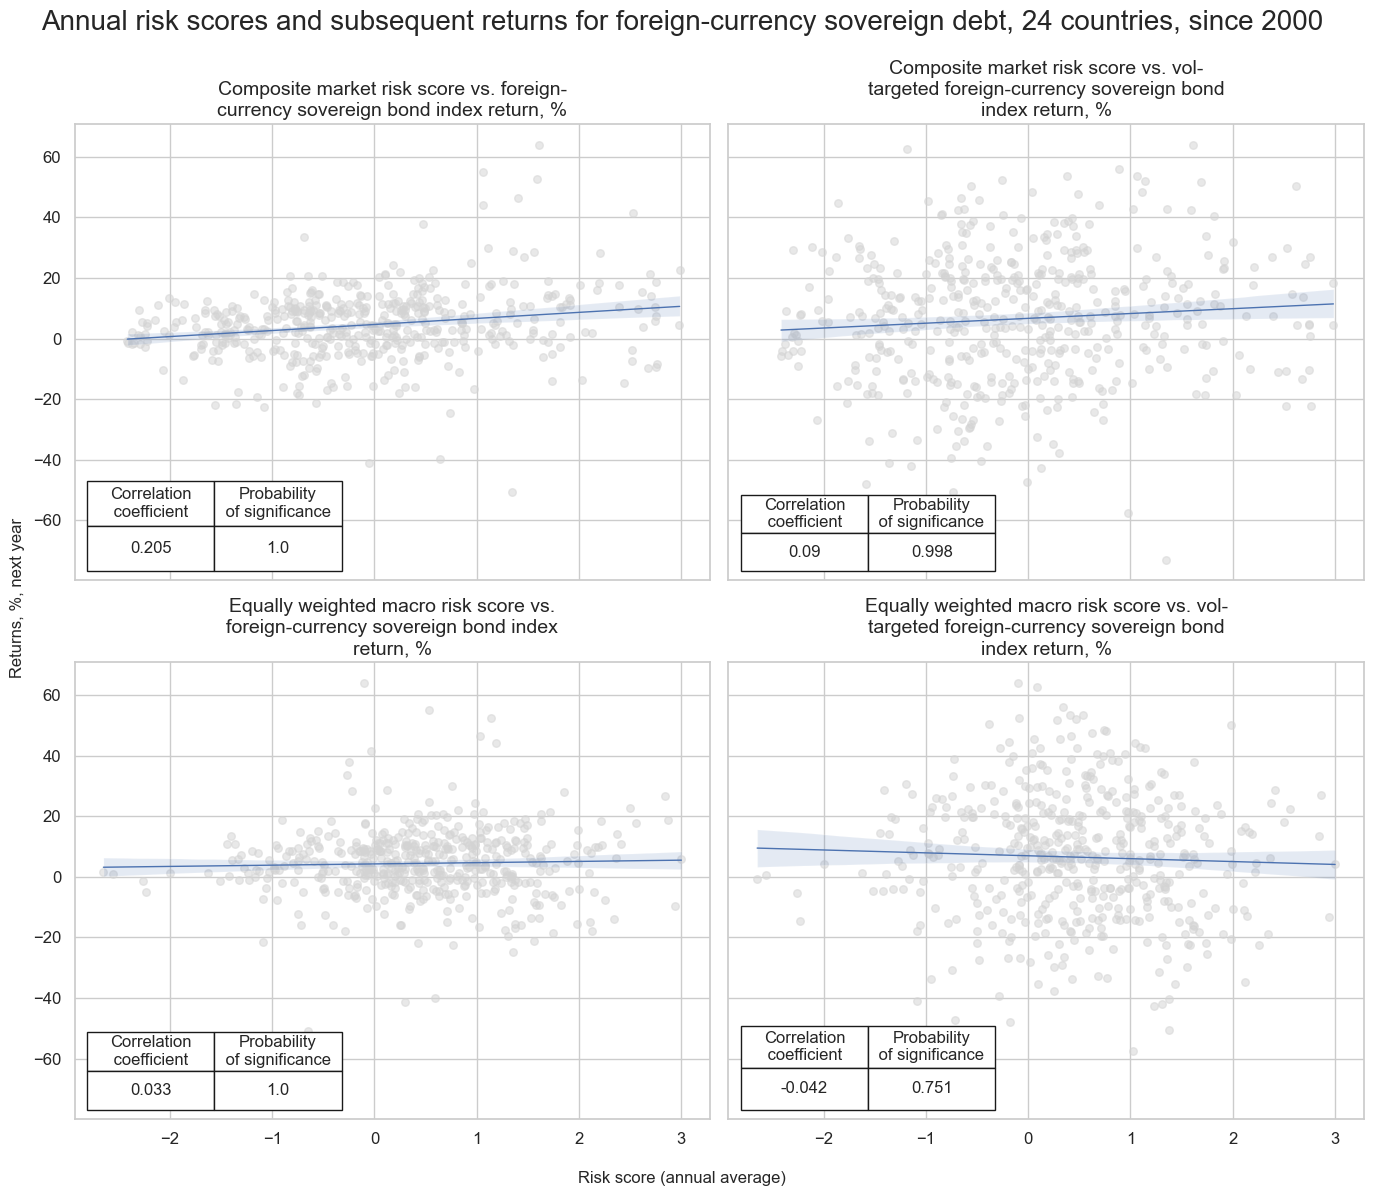
Simply put, when exposures adhere to a statistical risk budget, the moral hazard is largely mitigated. Systematic strategies will then focus on true value generation. In fact, as will be shown, risk-adjusted returns based solely on market risk scores are significantly lower than those attainable through macro risk premium scores.
Sovereign credit-related macro risk premium scores
Macro risk premium scores represent the differences between the market risk scores and the macro risk scores discussed above. In the case of foreign-currency sovereign credit, they subtract the 7-factor macro risk scores from the individual or combined spread and ratings scores. Subsequently, the differences are re-normalized.
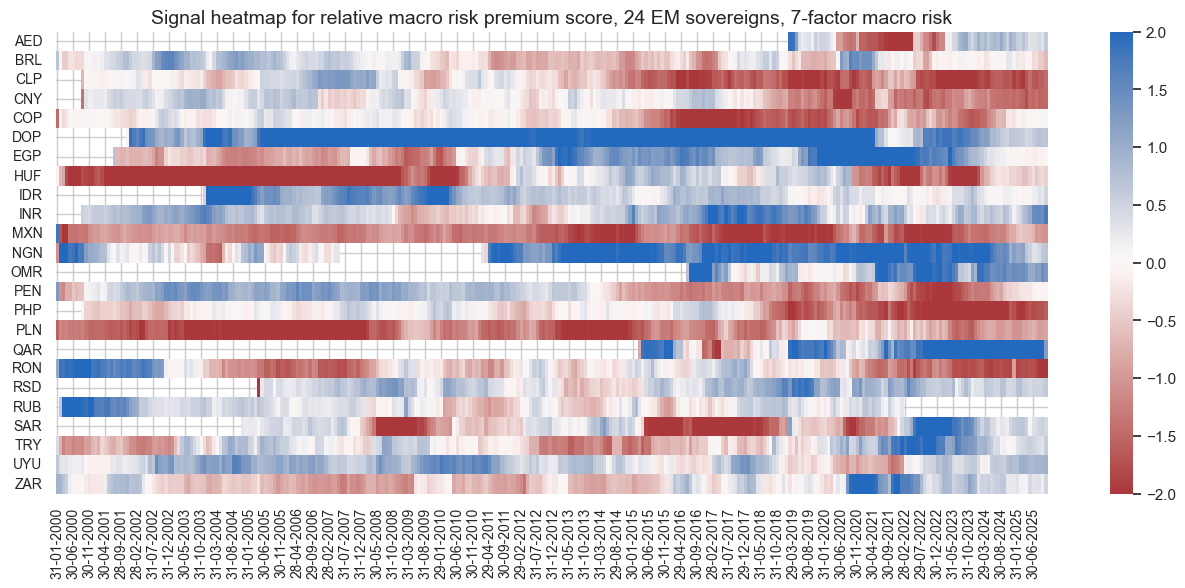
The evolution of the macro risk premium scores is displayed in the line charts below. Higher scores indicate that higher estimated sovereign credit risk premia are paid to investors, and units represent the standard deviations of the premia, as determined by the panel, up to the recorded point in time. Risk premium scores are highly autocorrelated and often exhibit long-term trends, similar to those of their constituents. They can also display large jumps, such as the one for Russia after the country’s invasion of Ukraine.
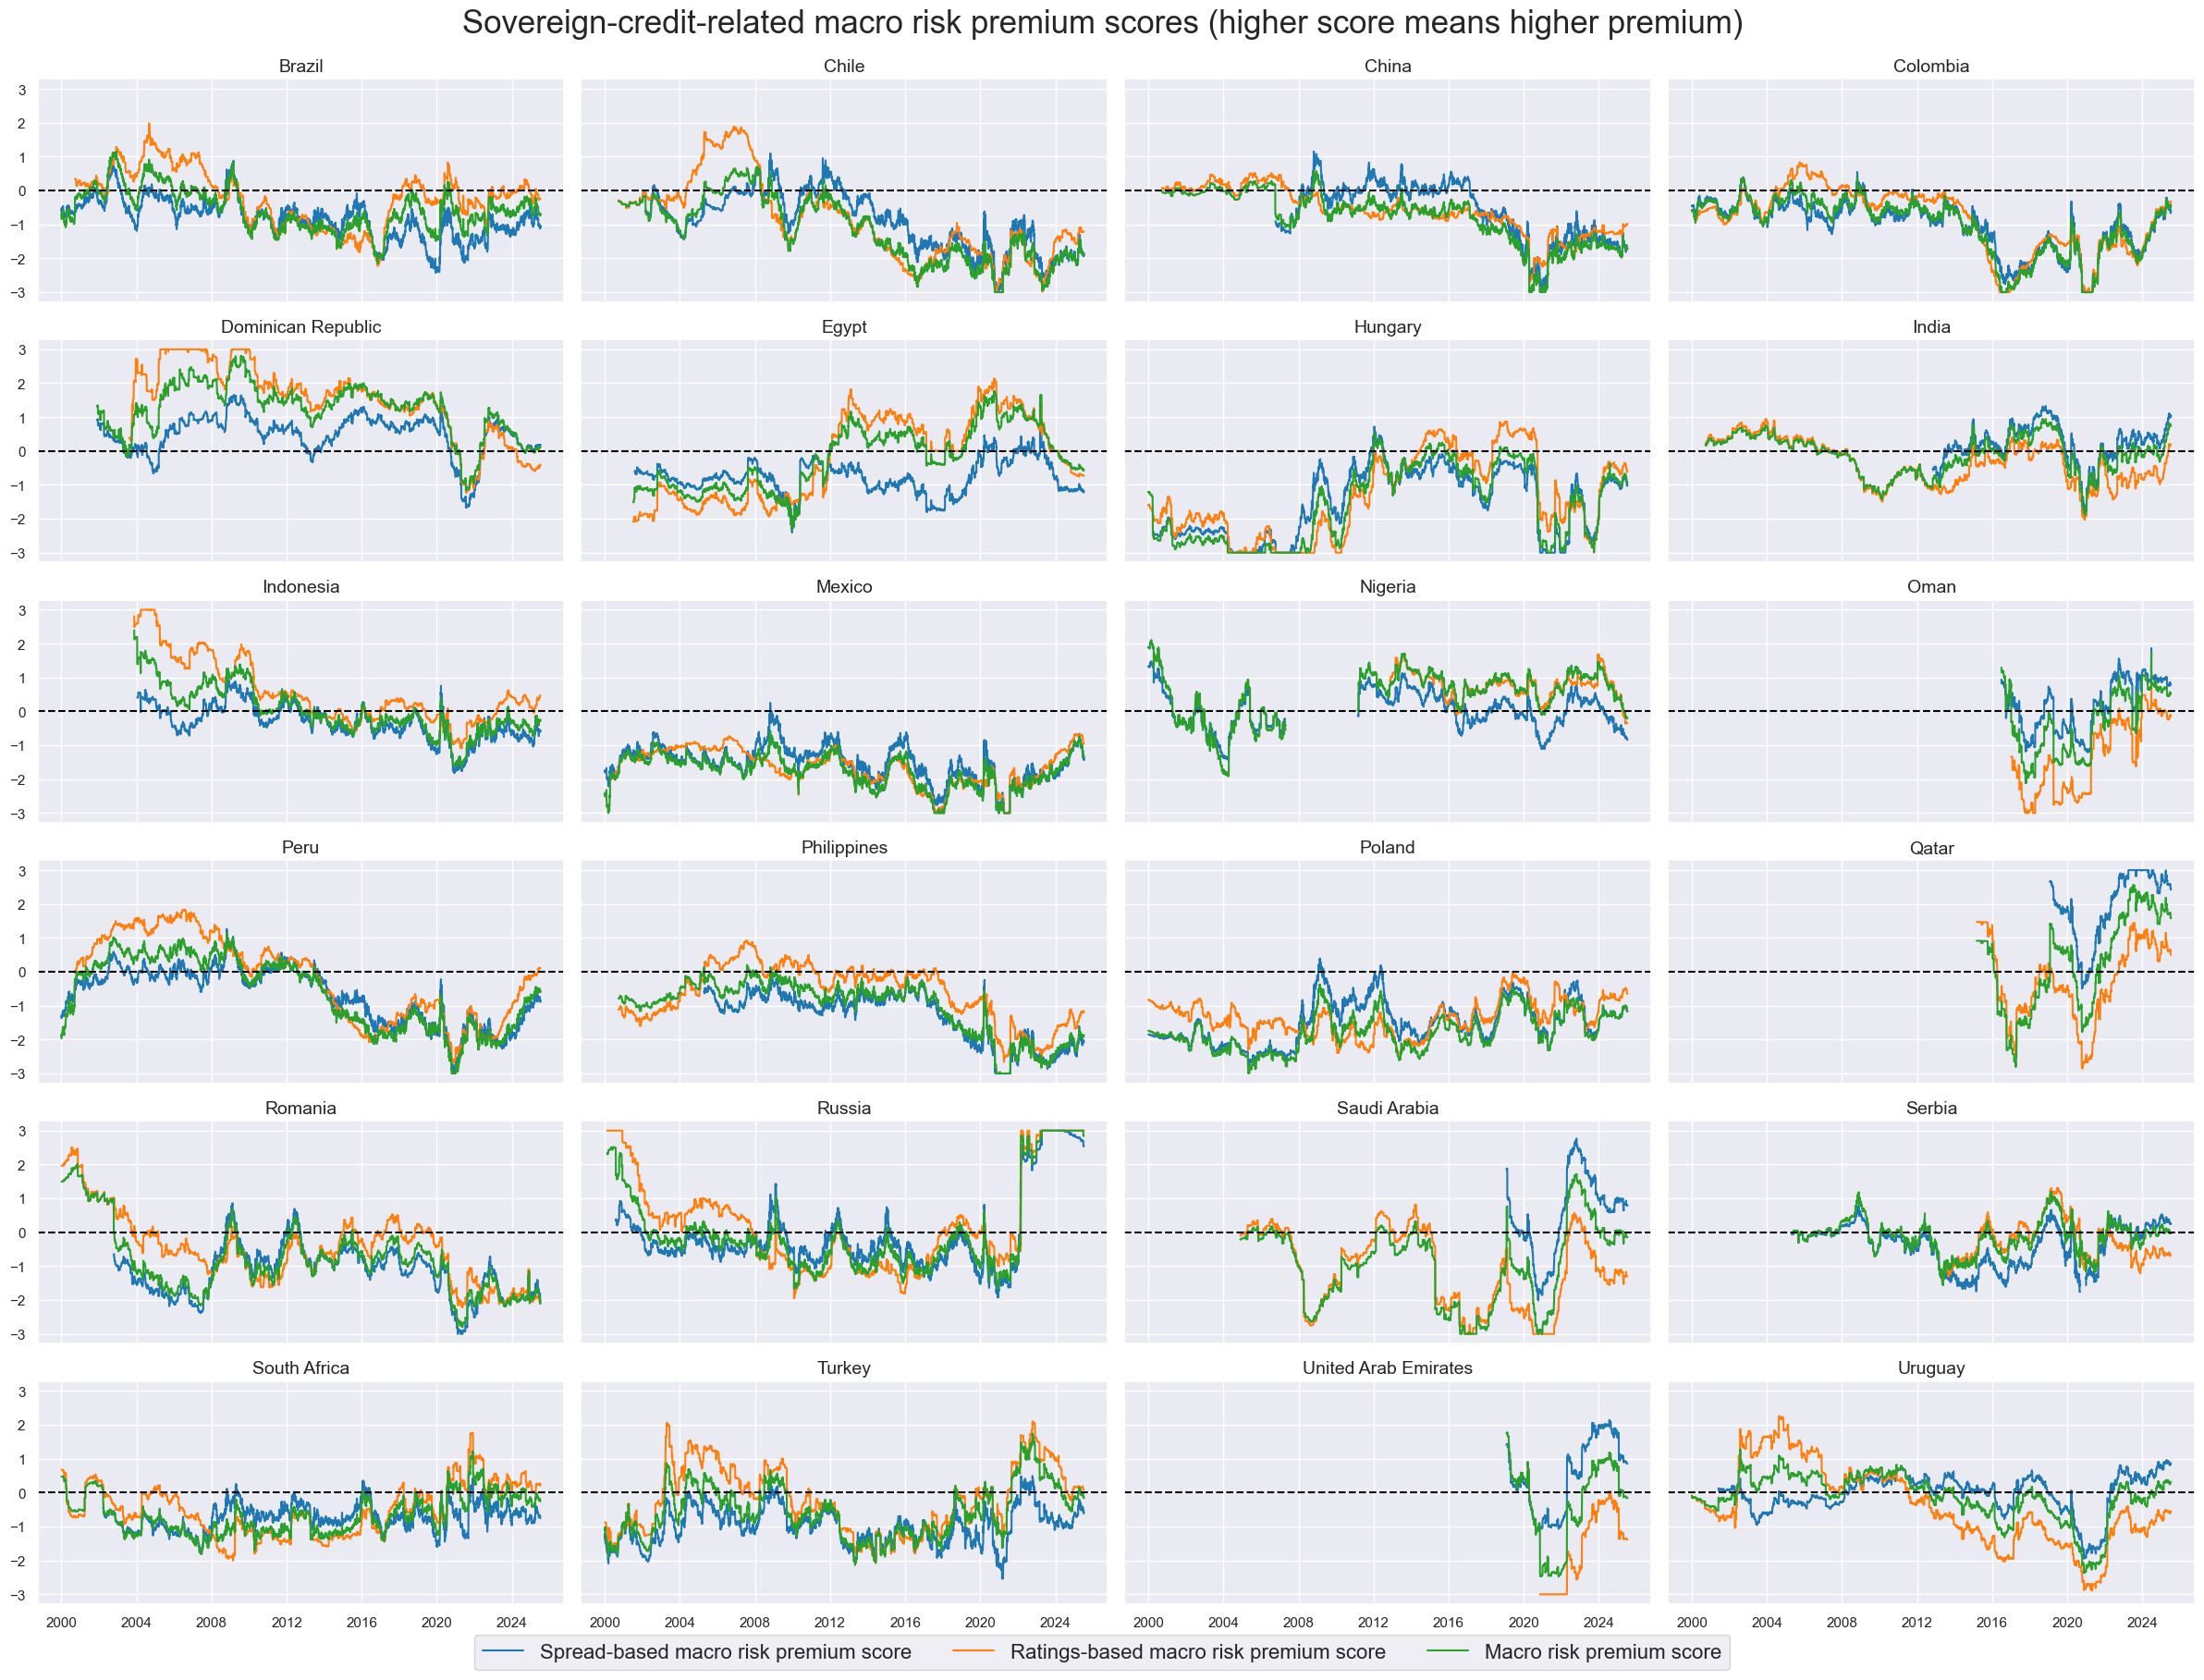
An important feature of the sovereign credit-related macro risk premium scores, as calculated here, is their short bias. This bias arises from the predominance of positive macro risk scores, as previously discussed. Since these scores effectively measure excess premia—i.e., the amount by which current premia exceed long-term norms—their sign should not be interpreted directly as a dividing line for long and short positions. In particular, a score of zero likely still reflects a positive risk premium, meaning that a clear signal for a short position would require the score to fall well below zero.
Evidence of directional predictive power
Did sovereign credit-related macro risk premium scores predict subsequent returns? We investigated this for month-end and quarter-end scores, as well as for subsequent volume-targeted monthly and quarterly EMBI country excess returns. Excess here means dollar index returns minus dollar funding costs. The significance of relations is assessed based on panel regressions and the Macrosynergy panel test, which adjusts returns and predictive scores of the regression for common (global) influences and thereby avoids the pseudo-replication of information of cross-country time series with correlated variations (view methodological post here).
Empirically, the composite macro risk premium scores have predicted subsequent vol-targeted index returns positively and significantly at both monthly and quarterly frequencies. The set of regression scatter plots below illustrates the relationships and tests for the quarterly frequency. Ratings-based premium scores exhibit a lower correlation but higher significance than spread-based scores, reflecting the greater suitability of ratings for cross-country comparisons. Macro risk premium scores post double the correlation coefficients of market risk scores alone and greater significance.
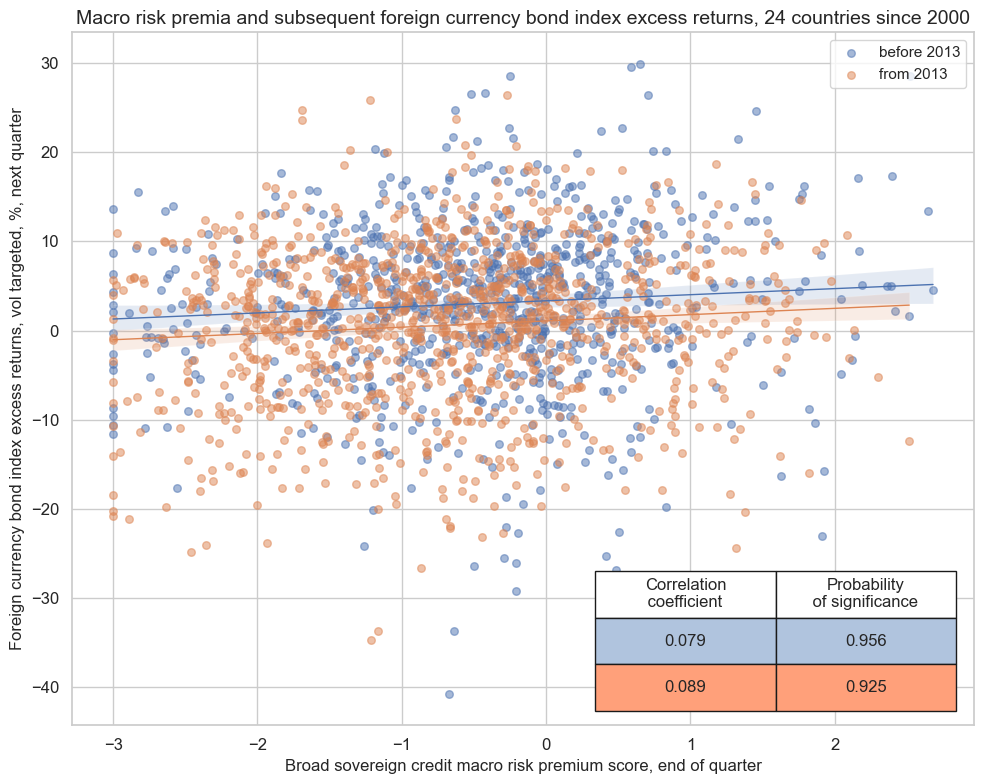
The positive and significant predictive power of sovereign credit-related macro risk premia has prevailed both in the earlier and later halves of the sample.
To assess the economic value of sovereign risk premium scores, we simulate a naïve PnL according to standard rules. We use risk premium scores (alongside simple market risk scores) to produce signals for a long-biased portfolio that can be compared to a long-only risk parity book. This means we normalize the country scores and add one standard deviation. We also floor negative values at -1 and positive values at 2. The resulting signals will all be between -1 and 2. Positions are taken based on month-end signals at the beginning of the following month, with a one-day delay for trading. One unit of signal translates into one unit of vol-targeted exposure. Returns are calculated net of funding costs and are not compounded. We compare macro risk premium signals with similar risk market signals and an equally-weighted portfolio of all countries. All PnLs are normalized at 10% annualized volatility for easy comparison of risk-adjusted returns. We do not include transaction costs, which vary depending on the size of assets under management.
The long-biased macro risk premium-based strategy has produced a 25-year Sharpe ratio of 1.2 and a Sortino ratio of 1.7. Correlation with major benchmarks has been 22% (S&P 500) and 26% (U.S. high-yield CDS index). Seasonality has been limited, due partly to the long bias and related risk premia. The PnL contribution of the best 5% of trading months was less than 50%. The performance metrics materially exceed a strategy based solely on market risk scores and the long-only book. The market risk-based strategy produced Sharpe and Sortino ratios of 0.8 and 1.1, respectively, and the long-only book recorded ratios of 0.7 and 0.9. The market risk strategy also recorded higher correlation with U.S. equity (30%) and high-yield credit (35%). Both the market risk-based strategy and the long-only portfolio have exhibited more seasonal behavior, with the top 5% of traded months accounting for 62% and 76% of their total long-term performance, respectively.
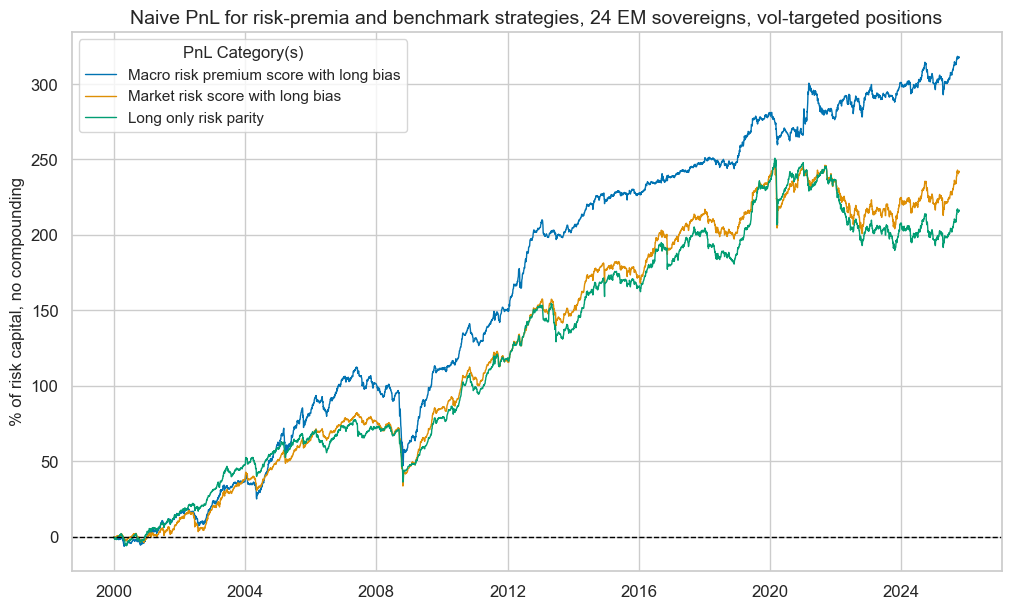
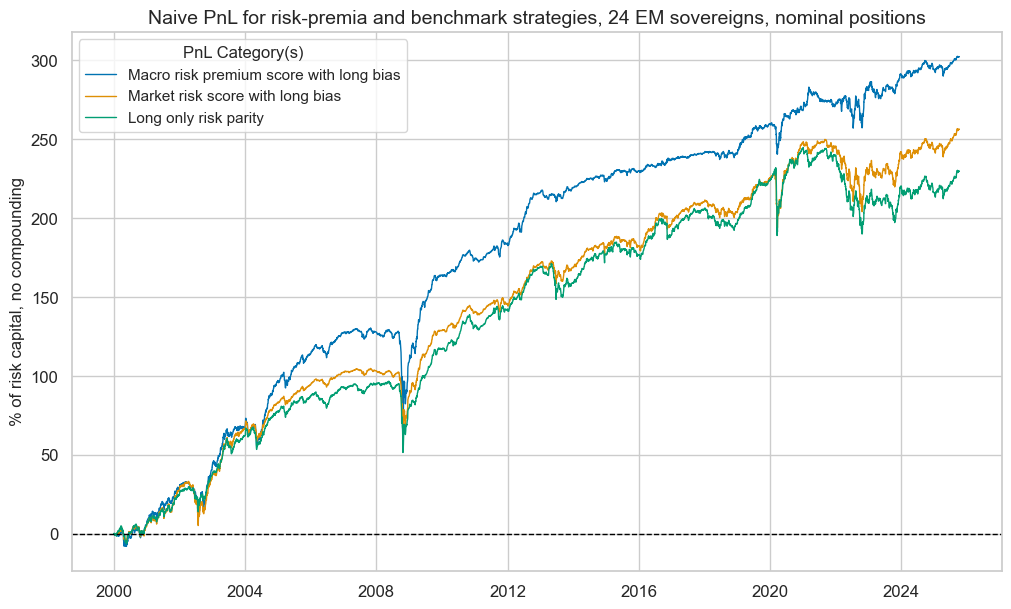
Interestingly, macro risk-premium scores would have even outperformed as signals for notional non-vol-targeted positions. Using the same rules as above but translating one unit of signal to one USD position in the respective credit, would have produced long-term Sharpe and Sortino ratios of 1.1 and 1.6, compared to 0.9 and 1.2 for a strategy of the same form that uses market risk signals alone and that implicitly emphasizes “reach for yield”.
Evidence of cross-country relative predictive power
The above strategies create value through managing sovereign credit risk intertemporally and across countries. However, it is particularly important to assess value generation that relies solely on cross-country allocation. This is because sensible signals of relative cross-country value are a valid basis for modifying government bond indices that produce higher value than standard capitalization-based indices.
The following set of line charts shows the evolution of relative macro risk premium scores. They are similar to the absolute risk-premium scores, except that we subtract at each period and from each sovereign the average of all available countries. Time series properties are similar to absolute risk-premium scores, except that we no longer have a long bias.
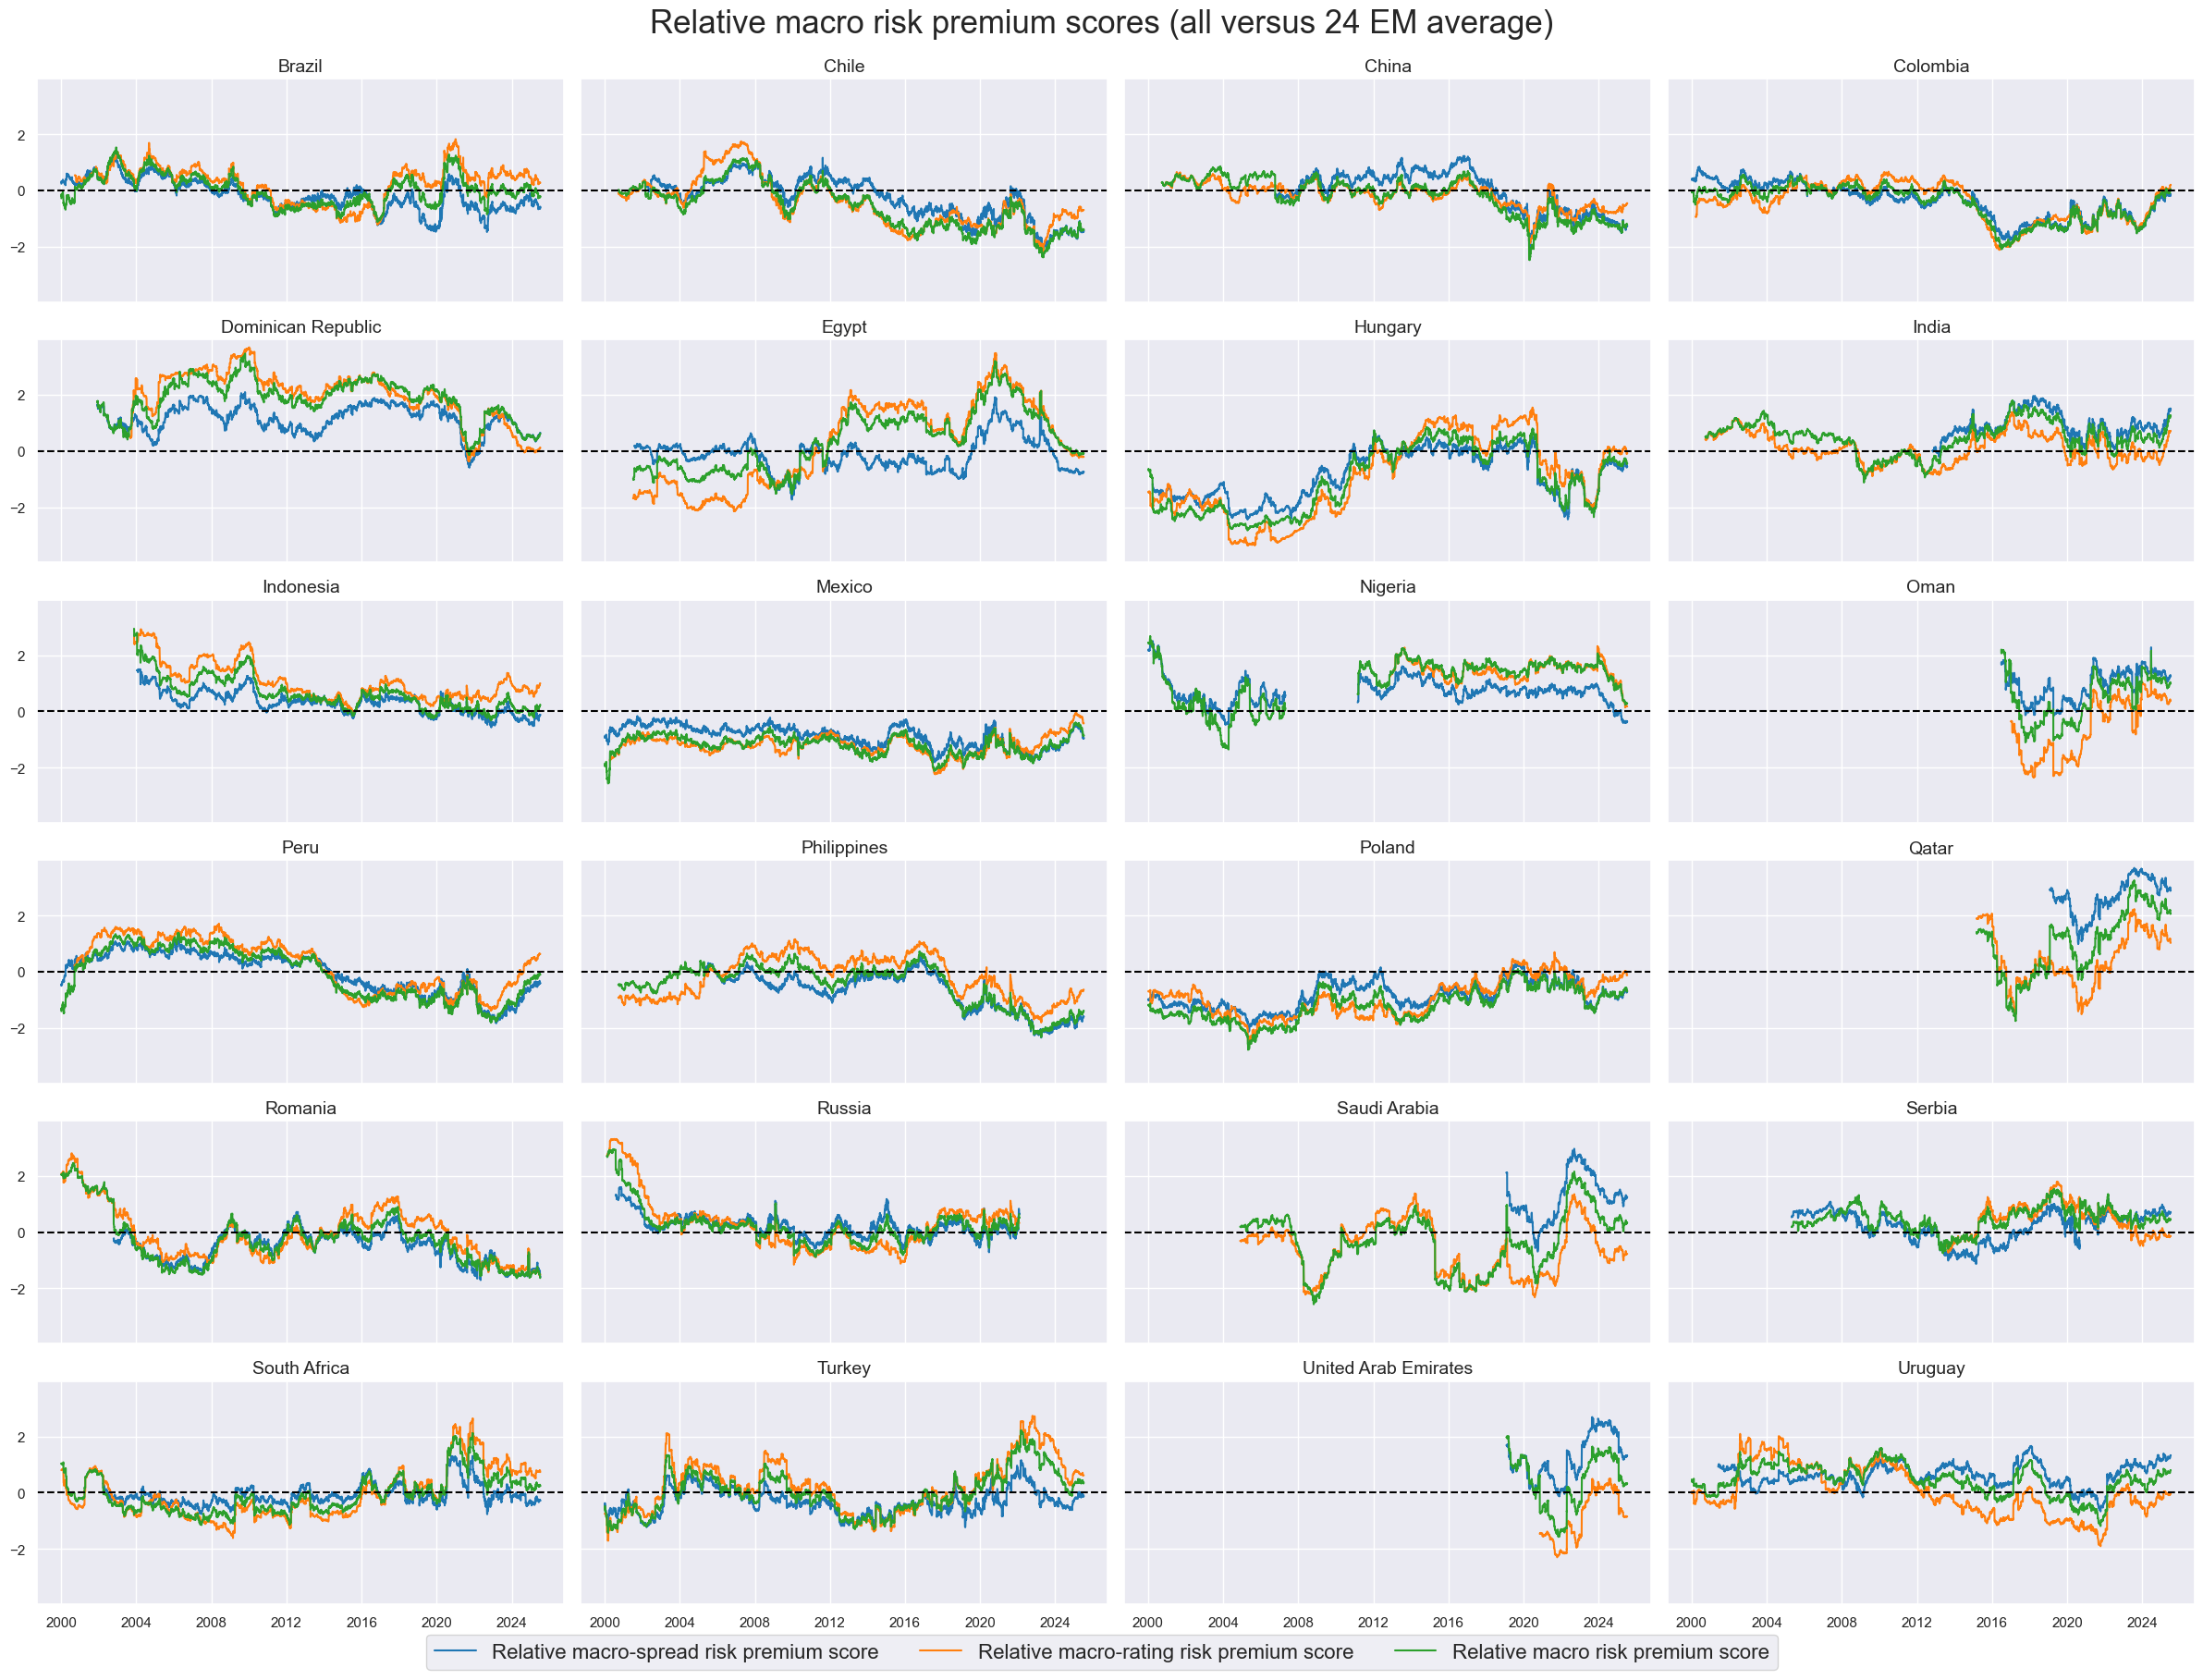
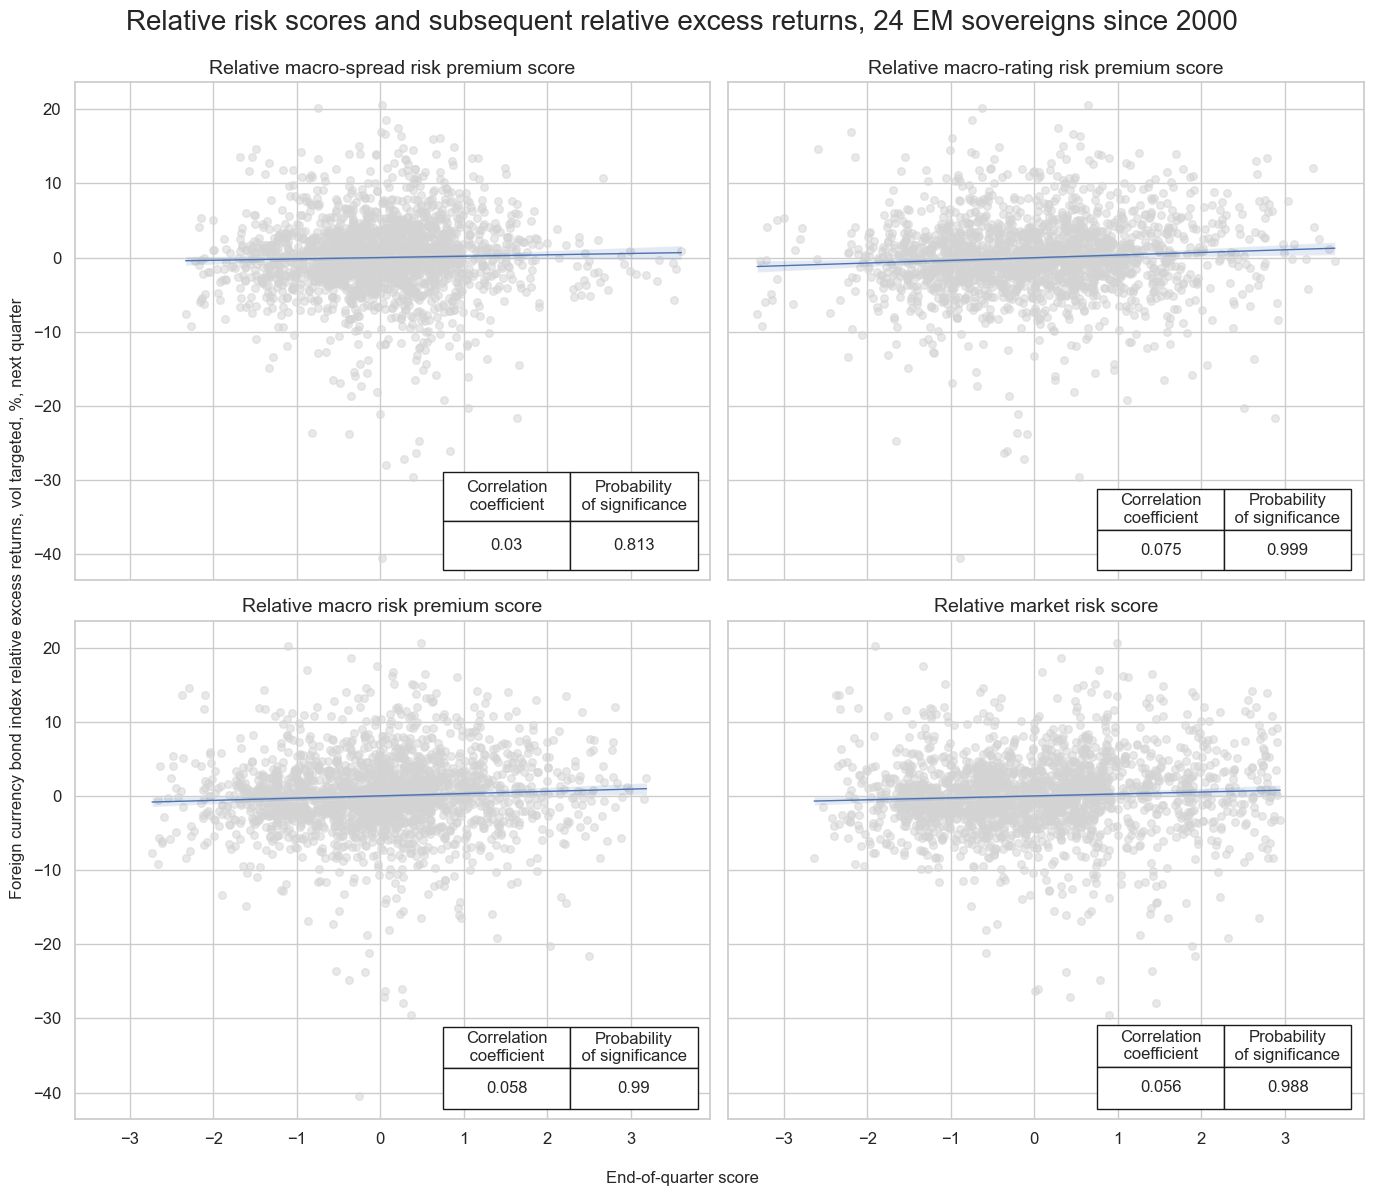
Overall, the correlation between relative risk premium scores and relative volatility-targeted returns has been weaker than that observed for their directional counterparts. This is plausible, as we have forfeited all intertemporal explanatory power and as not all indicators are fully comparable across countries. In particular, the sovereign credit risk implications of factors such as foreign debt levels, consumer price inflation, and economic growth depend heavily on a country’s economic structure and exchange rate regime. Nevertheless, despite these limitations, the positive predictive relationship between relative risk premium scores and subsequent monthly or quarterly relative volatility-adjusted sovereign credit index returns has remained highly statistically significant.
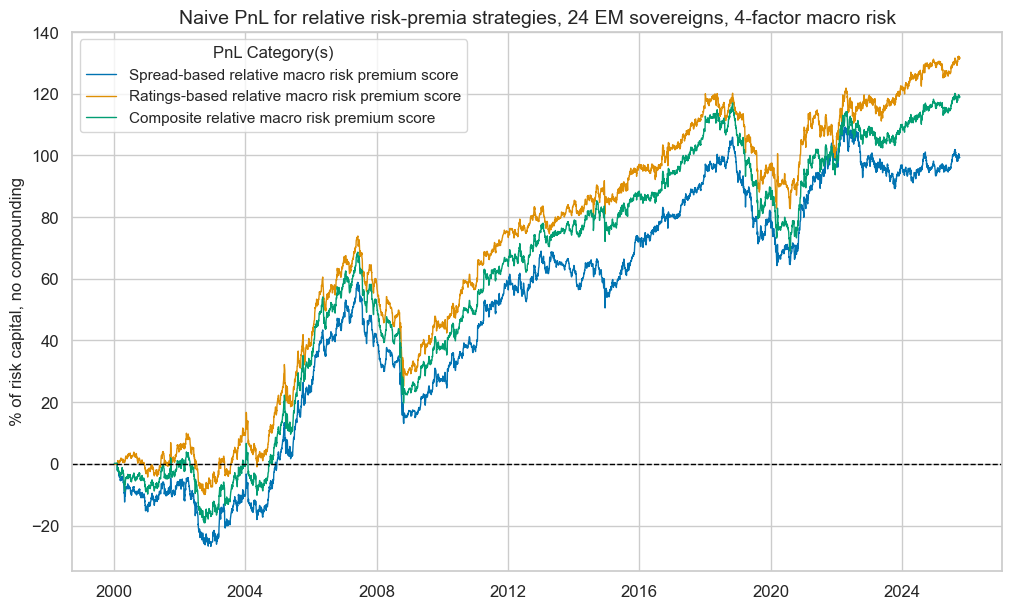
The long-term risk-adjusted value generation of a cross-country relative value strategy would naturally be less than that of a strategy that allows directional exposure. Yet has still been material with a clear long-term drift. The 25-year Sharpe and Sortino ratios of the composite macro risk premium signal were 0.4 and 0.6, with benchmark correlations of less than 10%. For the ratings-based premium scores alone, the ratios would have been 0.5 and 0.7.
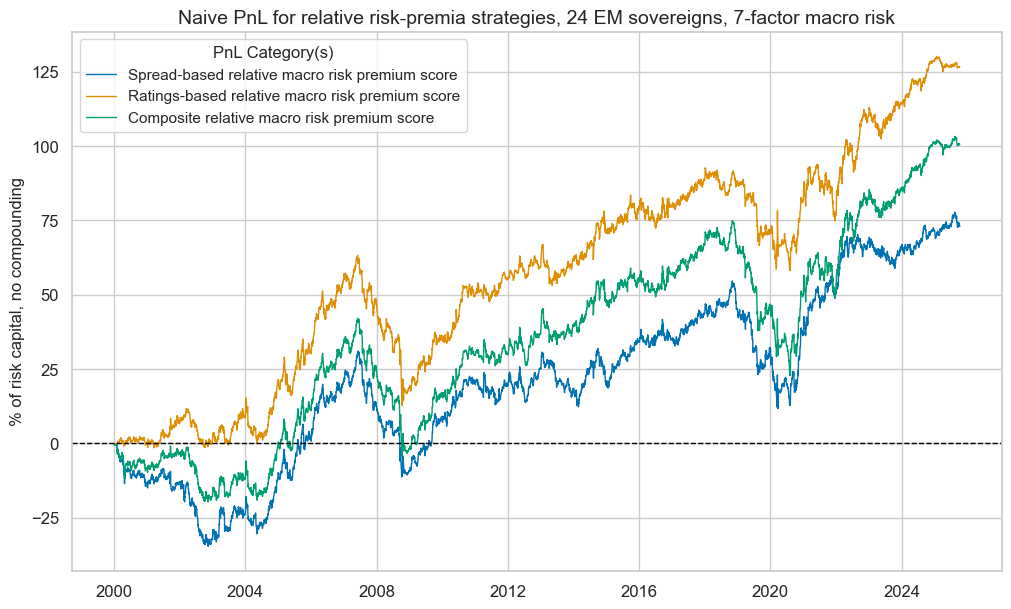
Note that the simulated PnL performance in the early 2000s likely understates the value of the relative premium-based cross-country strategy, as one-third of the countries in our sample only began trading between 2003 and 2016. Typically, value generation from cross-country strategies increases with the number of comparable tradable countries.
We also tested relative PnL generation for a subset of four macro risk factors that are more easily comparable across countries, i.e., general government finance indicators, external balances, net international investment positions, and governance indicators. Relative macro risk premium scores based on the four-factor model have posted slightly stronger predictive power and generated long-term Sharpe and Sortino ratios of 0.5 and 0.8 for the ratings-based signal. This is not a game changer, but it suggests that additional work enhancing the comparability of macro signals may be critical for enhancing relative value.