Macro risk premium scores are differences between market-implied risk and point-in-time quantified macroeconomic risk. Two principal types of scores can be calculated for credit markets: spread-based risk premium scores and rating-based risk premium scores. This post proposes a small set of these scores for EM foreign-currency sovereign debt, targeting 24 country sub-indices of the EMBI Global. The macroeconomic component captures four risk dimensions: general government finance, external balances, international investment flows, and foreign debt sustainability.
Macro risk premium scores are constructed on a point-in-time basis, making them suitable for backtesting. Both individual and aggregated scores have shown strong and statistically significant predictive power for subsequent returns of country indices. Portfolios of EM sovereign bonds weighted by risk premium scores have consistently outperformed those based on equal weights or risk parity. Risk premium scores have also generated material cross-country relative value. Most importantly, macro risk premia offer a responsible and profitable approach to adjusting weights of emerging market bond indices.
The post below is based on Macrosynergy’s proprietary research. Please quote as “Regis, Glenn, Sueppel, Ralph, and Tyagi, Palash, ‘EM sovereign bond allocation with macro risk premium scores,’ Macrosynergy research post, March 2025.”
A Jupyter notebook for audit and replication of the research results can be downloaded here. The notebook operation requires access to J.P. Morgan DataQuery to download data from JPMaQS. Everyone with DataQuery access can download data except for the latest months. Moreover, J.P. Morgan offers free trials on the complete dataset for institutional clients. An academic support program sponsors data sets for research projects.
The concept of macro risk premia and related scores
A macro risk premium score is defined as the difference between a normalized priced or rated risk indicator and a normalized macro-quantamental risk factor. Quantamental risk factor here means a meaningful point-in-time macroeconomic indicator that raises the probability of losses in a financial contract. Point-in-time means that for each day in history, the indicator displays the latest publicly available updated value of the underlying concept. This allows assessing the predictive power of macro risk premium scores and backtesting their value in investment strategies. In the credit market, we can distinguish two types of risk premium scores:
- A spread-based risk premium score represents the difference between a normalized credit spread as priced by the market and a normalized macroeconomic credit risk factor.
- A rating-based risk premium score is the difference between a normalized rating-implied risk score based on ratings and outlooks of major agencies and a normalized macroeconomic credit risk factor.
Macro risk premium scores are an easy and intuitive way to track disparities between market-implied credit risk and related risk fundamentals. For credit markets, the rationale can be illustrated by a most simple linearized model. Here, the model is shown for spreads alone, but the rationale applies analogously to ratings.
The expected loss of a contract related to credit risk is supposed to be associated with a set of macro risk factors:
![]()
- ELOSSi,t is the expected future loss of contract i given information in period t in the form of an annualized premium,
- b is a vector of positive coefficients translating risk factors into expected losses, and
- RFit is a corresponding non-negative vector of default risk factors of contract i known to the market in period t.
The credit spread of the financial contract is assumed to depend on expected losses but modified by salience-dependent risk premia associated with each factor and a residual that represents unobservable premia:
![]()
- SPREADi,t is the credit annualized credit spread priced in contract i in period t.
- spi,t is a vector of (positive or negative) measures of time-variant salience-dependent risk premia associated with the corresponding risk factors, and
- ei,t is a residual value of factors that influence spreads but are not related to default risk, such as liquidity or regulatory influences.
Note that in behavioral finance, salience measures how prominently certain information stands out and captures attention. Salience comes from psychology and explains why people are more likely to focus on vivid, recent, or emotionally charged information. Salience theory suggests that investors overreact to salient information.
From the above simple hypotheses, it follows that the expected excess return on a credit contract (net of funding costs) is equal to risk premia associated with identified risk factors plus the premia charged on non-default factors.
![]()
This, in turn, can be represented by the difference between the credit spread and expected losses arising from default risk factors.
![]()
This simple theoretical rationale has several consequences:
- Since risk premia are mostly positive, both spreads and macro risk factors are positively correlated with subsequent excess returns.
- The positive predictive power of risk factors holds only when salience-dependent risk premia are positive. Predictive power could be negative in times of complacency and negligence. Also, the magnitude of expected excess returns depends on the strength of salience. Alas, neither salience nor risk premia are readily observable.
- The positive predictive power of spreads only holds if either salience and risk premia are positive or if the influence of residual factors is dominant.
- By contrast, differences between spreads and expected losses associated with risk factors are positively related to expected returns, regardless of the salience and premia charged.
- If differences between spreads and risk factors are appropriately scaled and if the observed risk factors capture a large part of the sources of credit-related losses, the resultant scores will have a robust positive relation with subsequent returns. For example, if the credit spreads of a contract are very high by historical standards while fundamental risk factors are very low, the scores would indicate positive expected returns.
This implies that, all other things being equal, higher fundamental risk should reduce exposure to credit risk even if its correlation with expected excess return is positive. Thus, the concept of macro risk premia unlocks the predictive power of macro-quantamental indicators that would otherwise remain undetected by most standard statistical tests.
A simple application to EM foreign currency portfolios
Here, we produce, visualize, and test macro risk premium scores for emerging market foreign-currency bonds in the form of country dollar bond indices. The indices chosen are country sub-indices of J.P. Morgan’s EMBI Global. The EMBI suite of indices contains US dollar-denominated bonds issued by sovereign and quasi-sovereign EM entities that are eligible for inclusion. A country is eligible for inclusion in the EMBI Global if either the GNI per capita is below the Index Income Ceiling (IIC) for three consecutive years or the nation’s cost of living (purchasing power) is below the Index PPP Ratio (IPR) for three consecutive years.
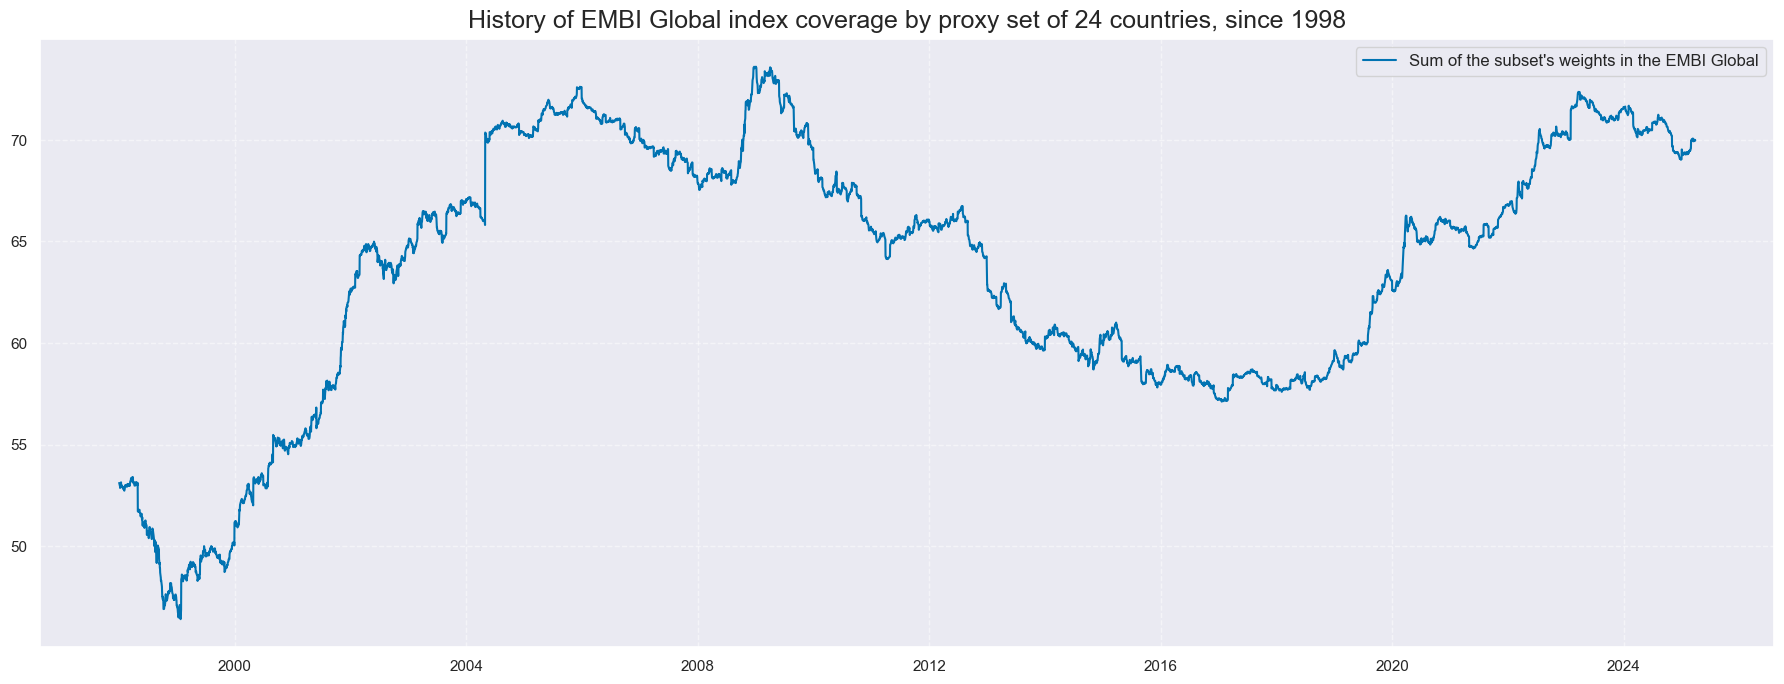
For this post, we consider a subset of EMBI Global sovereign issuers for which at least some history of high-quality point-in-time macro-quantamental indicators is available. This subset features 24 sovereign issuers, which have been eligible for the index for at least part of the sample period 2000-2025.
- Latin America: Brazil (BRL), Chile (CLP), Colombia (COP), Dominican Republic (DOP), Mexico (MXN), Peru (PEN), and Uruguay (UYU).
- Emerging Europe: Hungary (HUF), Poland (PLN), Romania (RON), Russia (RUB), Serbia (RSD), and Turkey (TRY).
- Middle East and Africa: United Arab Emirates (AED), Egypt (EGP), Nigeria (NGN), Oman (OMR), Qatar (QAR), South Africa (ZAR), and Saudi Arabia (SAR).
- Asia: China (CNY), Indonesia (IDR), India (INR), and the Philippines (PHP)
Since 2000, this set of countries has accounted for between 50% and 80% of the EMBI Global.
EMBI country index returns in various forms and all macro-quantamental risk indicators can be downloaded from the J.P. Morgan Macrosynergy Quantamental System (JPMaQS). The analysis below looks at cash returns, excess returns, and volatility-targeted excess returns (view documentation here).
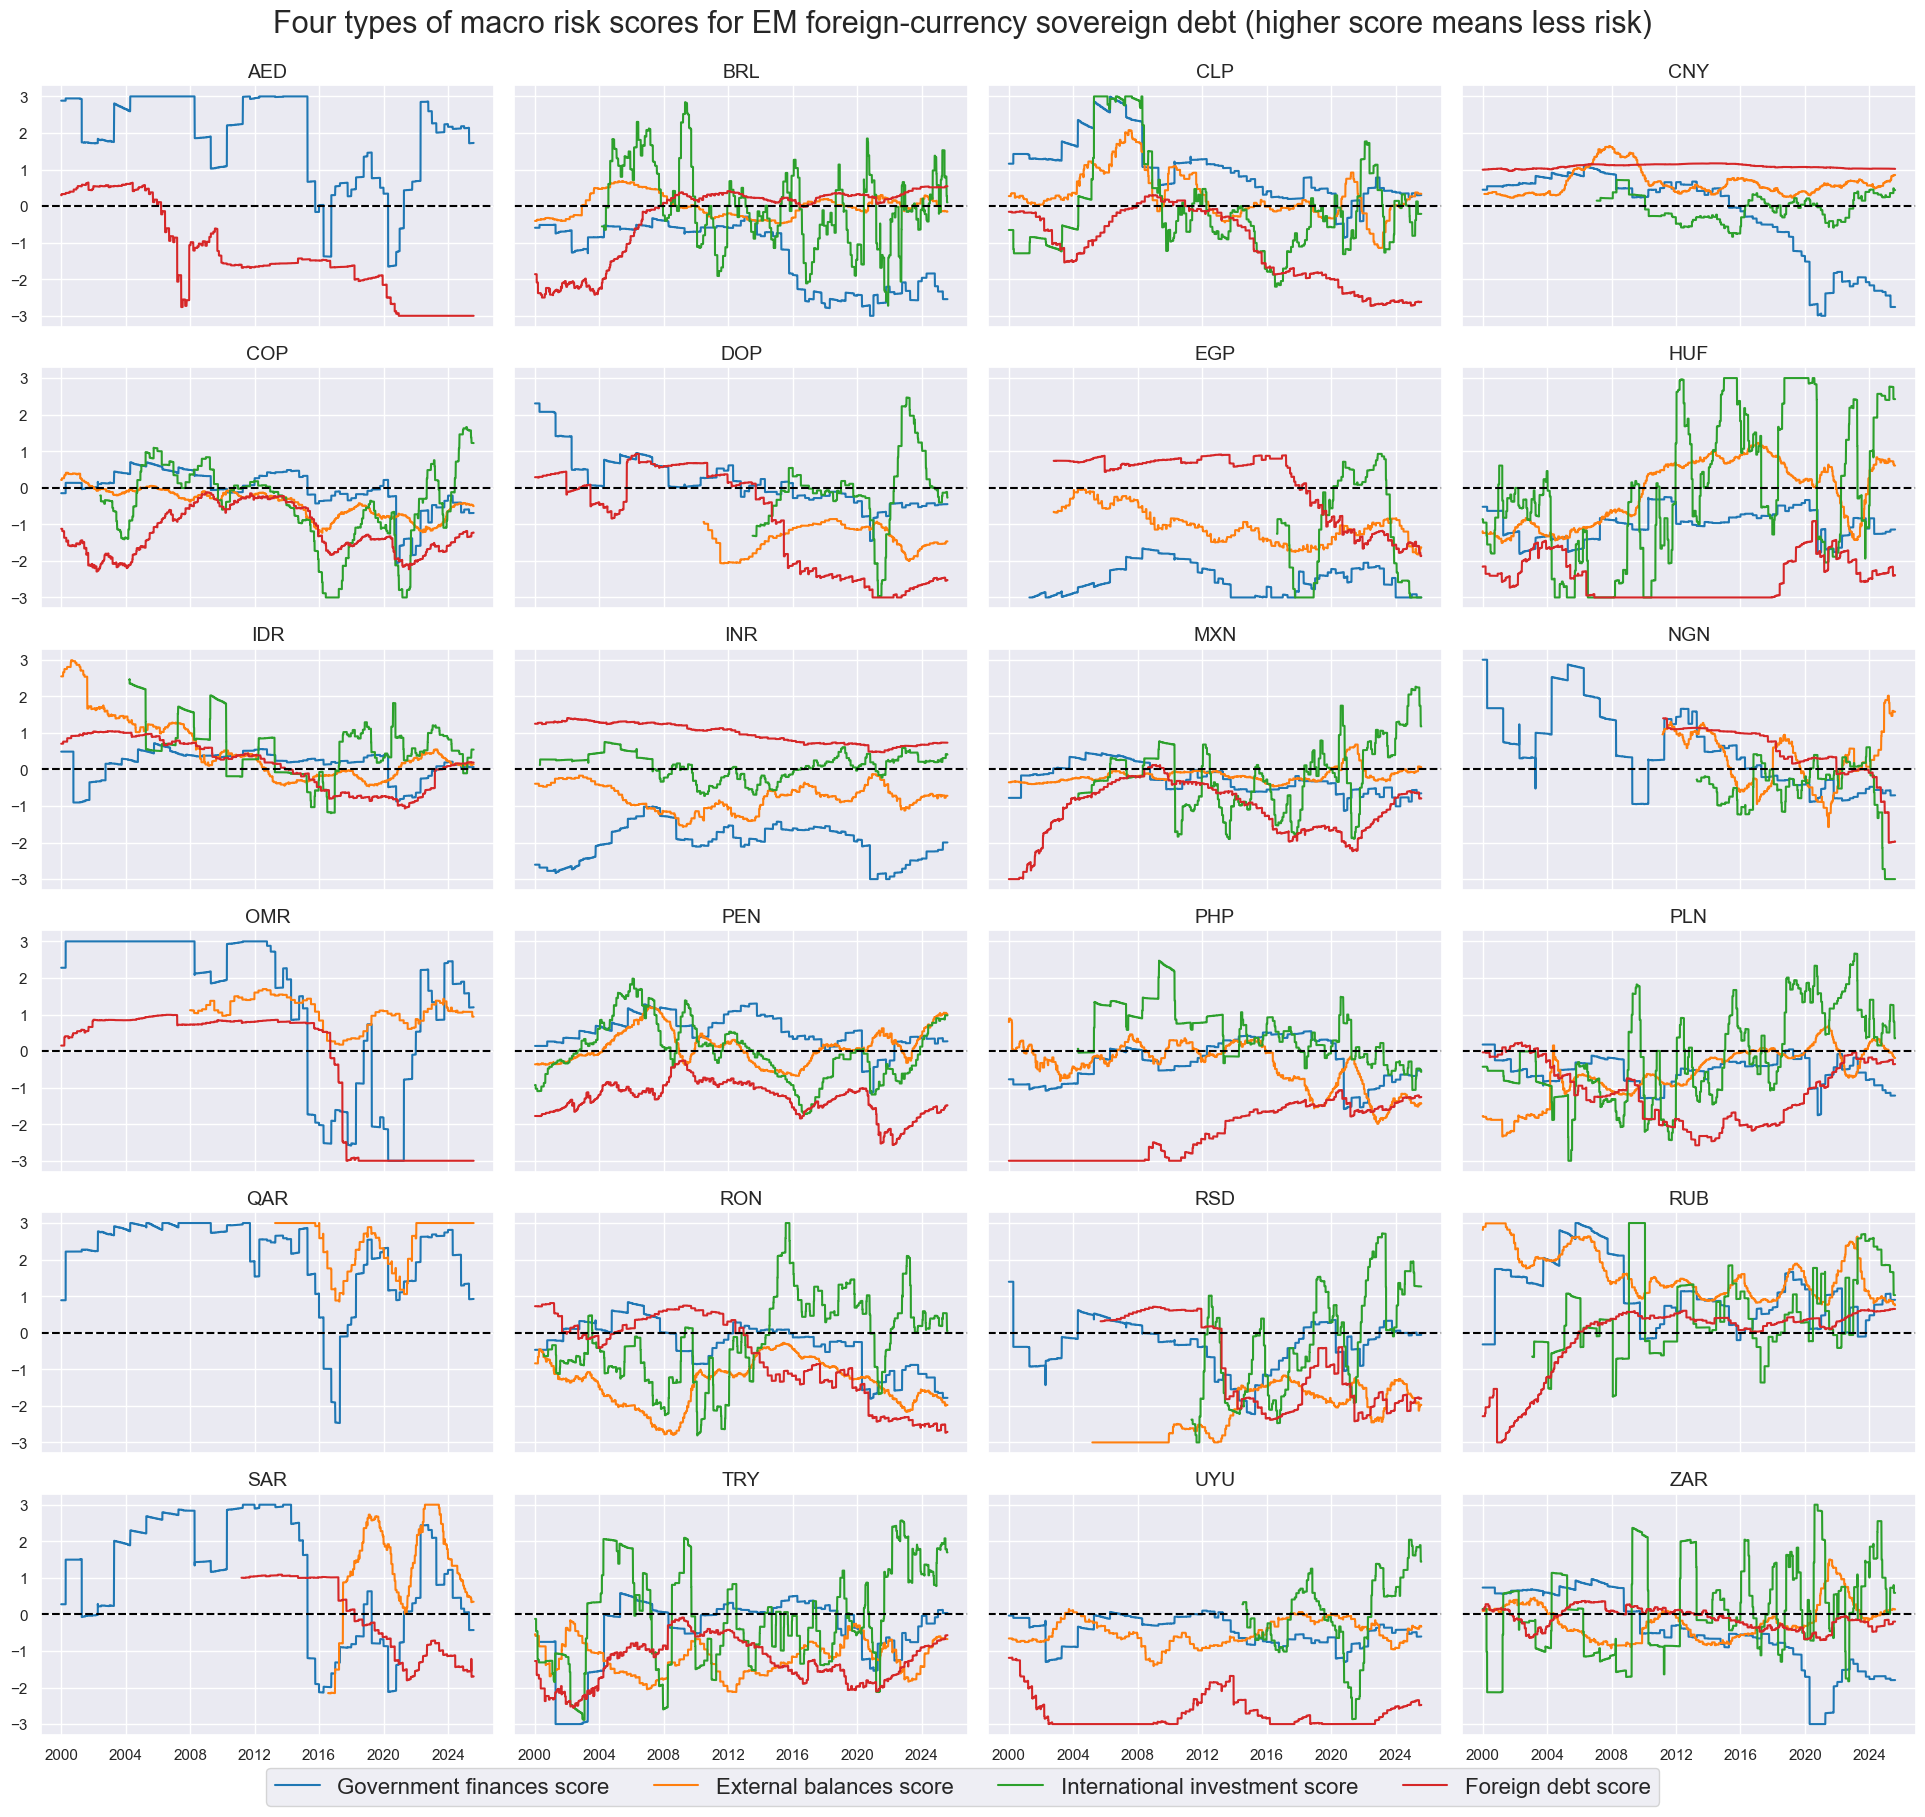
As macro risk factors, we consider four types of quantamental categories that emerging market sovereign debt investors are conventionally monitoring and that can be downloaded in point-in-time format from JPMaQS:
- For general government finance risk, we focus on the general government balance as % of GDP for the current year and the next year and the general government debt of the current year as % of GDP (documentation here). All else equal, lower balances, i.e., lower surpluses or higher deficits, and higher debt ratios imply a higher debt servicing burden and increase sovereign default risk.
- For external balance risk, we use external merchandise trade balance as % of GDP, 12-month average and the broader external current account as % of GDP, also as a 12-month moving average (documentation here). All else equal, lower balances, i.e., smaller external surpluses or higher external deficits, increase the risk of currency depreciation and related surges of external debt servicing costs relative to local-currency tax revenues. Thereby, lower external balance ratios translate into higher sovereign default risk.
- For international investment flow risk, we observe medium-term trends in cross-border investment positions. These include the difference between the latest net international investment position as % of GDP and its 2-year and 5-year moving averages and the difference between the latest international liabilities ratios to GDP and their 2-year and 5-year moving averages (documentation here). Declining net investment positions and rising liabilities point to growing dependence on foreign funding and rising vulnerability to sudden stops or reversals. Such vulnerability increases the risk of default across the economy.
- For foreign debt sustainability, we look at the external debt of all issuers of a country as % of GDP and at the external debt of the general government as % of GDP. Here, external debts are liabilities owed to non-residents by residents of a country (documentation here). The higher the external debt stock, the greater the debt servicing costs and roll-over risk. Both increase the risk of external debt defaults.
To calculate macro risk scores, we first normalize all indicators sequentially using the mean and standard deviation of the entire panel, i.e., the values for all country time series up to a specific point in time. Values are capped at three standard deviations on the positive and negative side to de-emphasize outliers. Then, we adjust signs so that a higher score always means a higher quality of the credit from a macroeconomic perspective. Finally, we linearly combine the scores of each type of indicator to a conceptual risk score and re-normalize sequentially. The conceptual score is calculated based on the available indicators if sub-scores are missing. All scores and sub-scores have been chosen based on availability and theoretical plausibility alone. The scores have not been optimized in any way. For fair evaluation, optimization would require sequential statistical learning as shown elsewhere (view post).
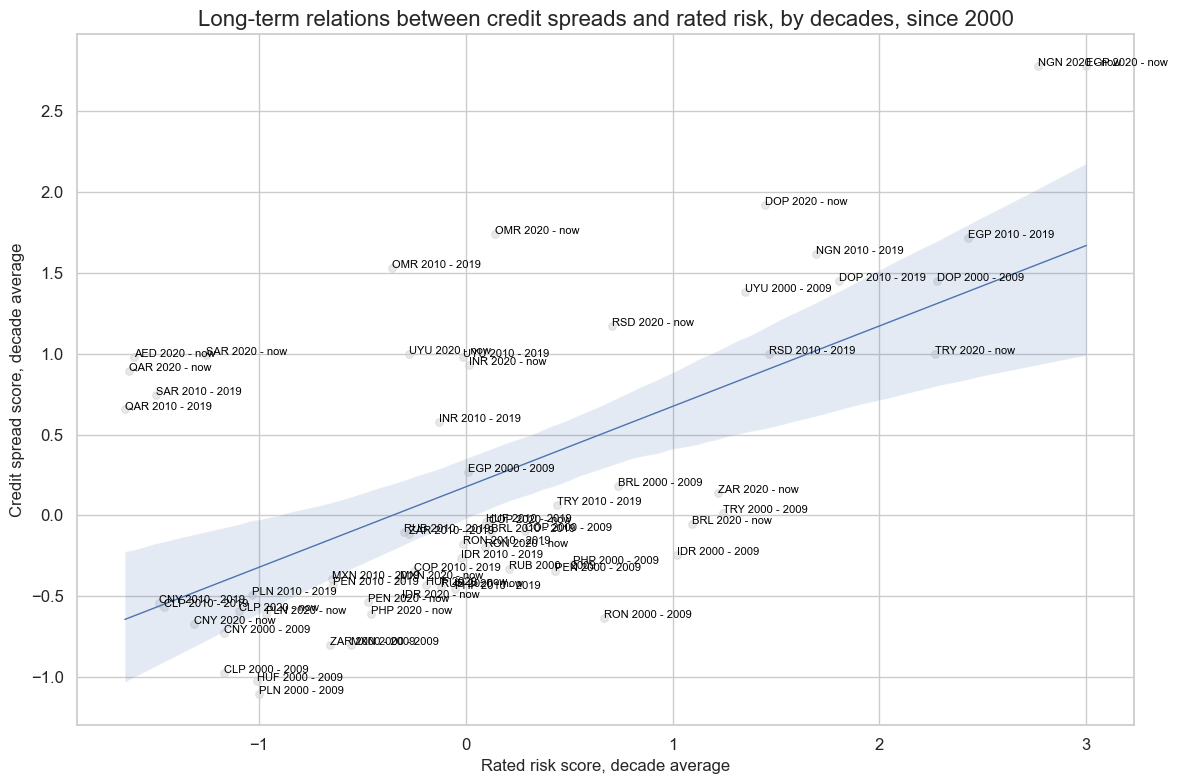
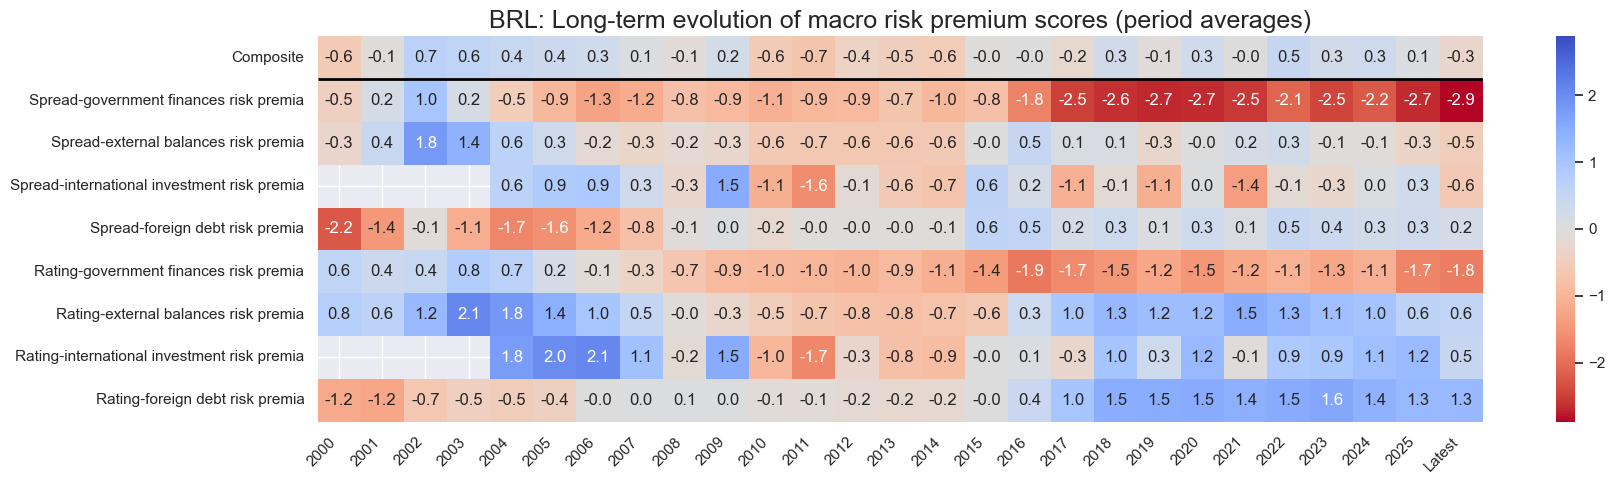
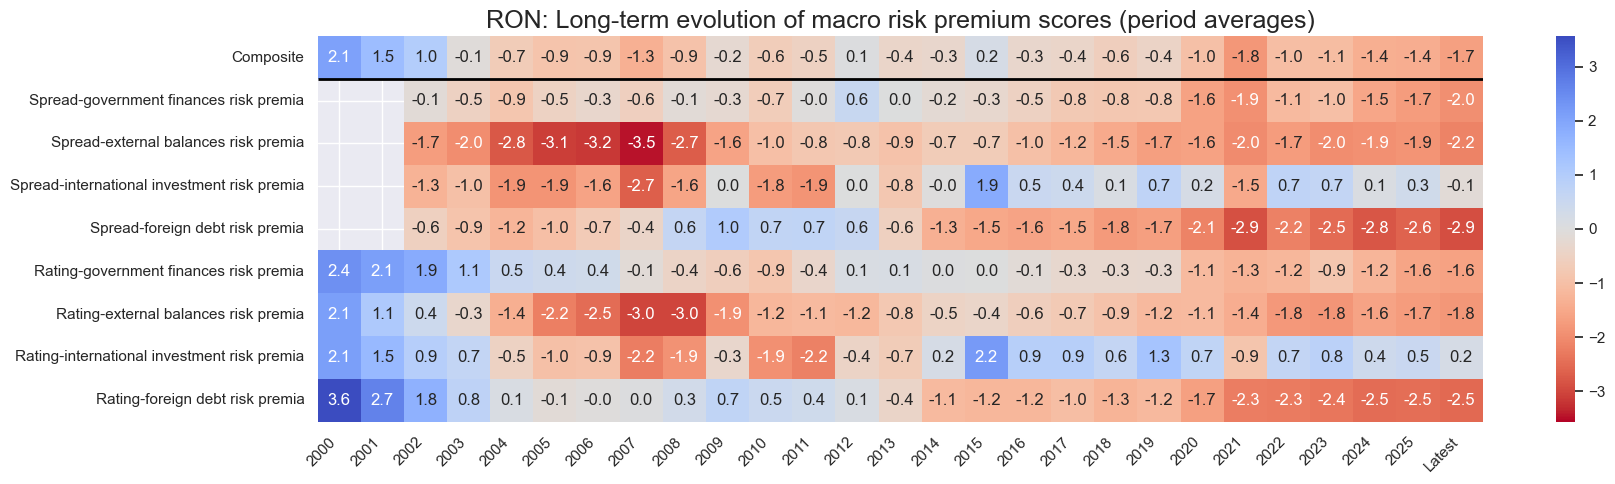
The panel below shows the evolution of macro risk scores over time since 2000, with higher values denoting better fundamental credit quality according to the respective concepts. All scores are highly autocorrelated, and some represent structural features. Also, due to non-disclosures and poor data quality, not all point-in-time scores have been available for all of the past 25 years.
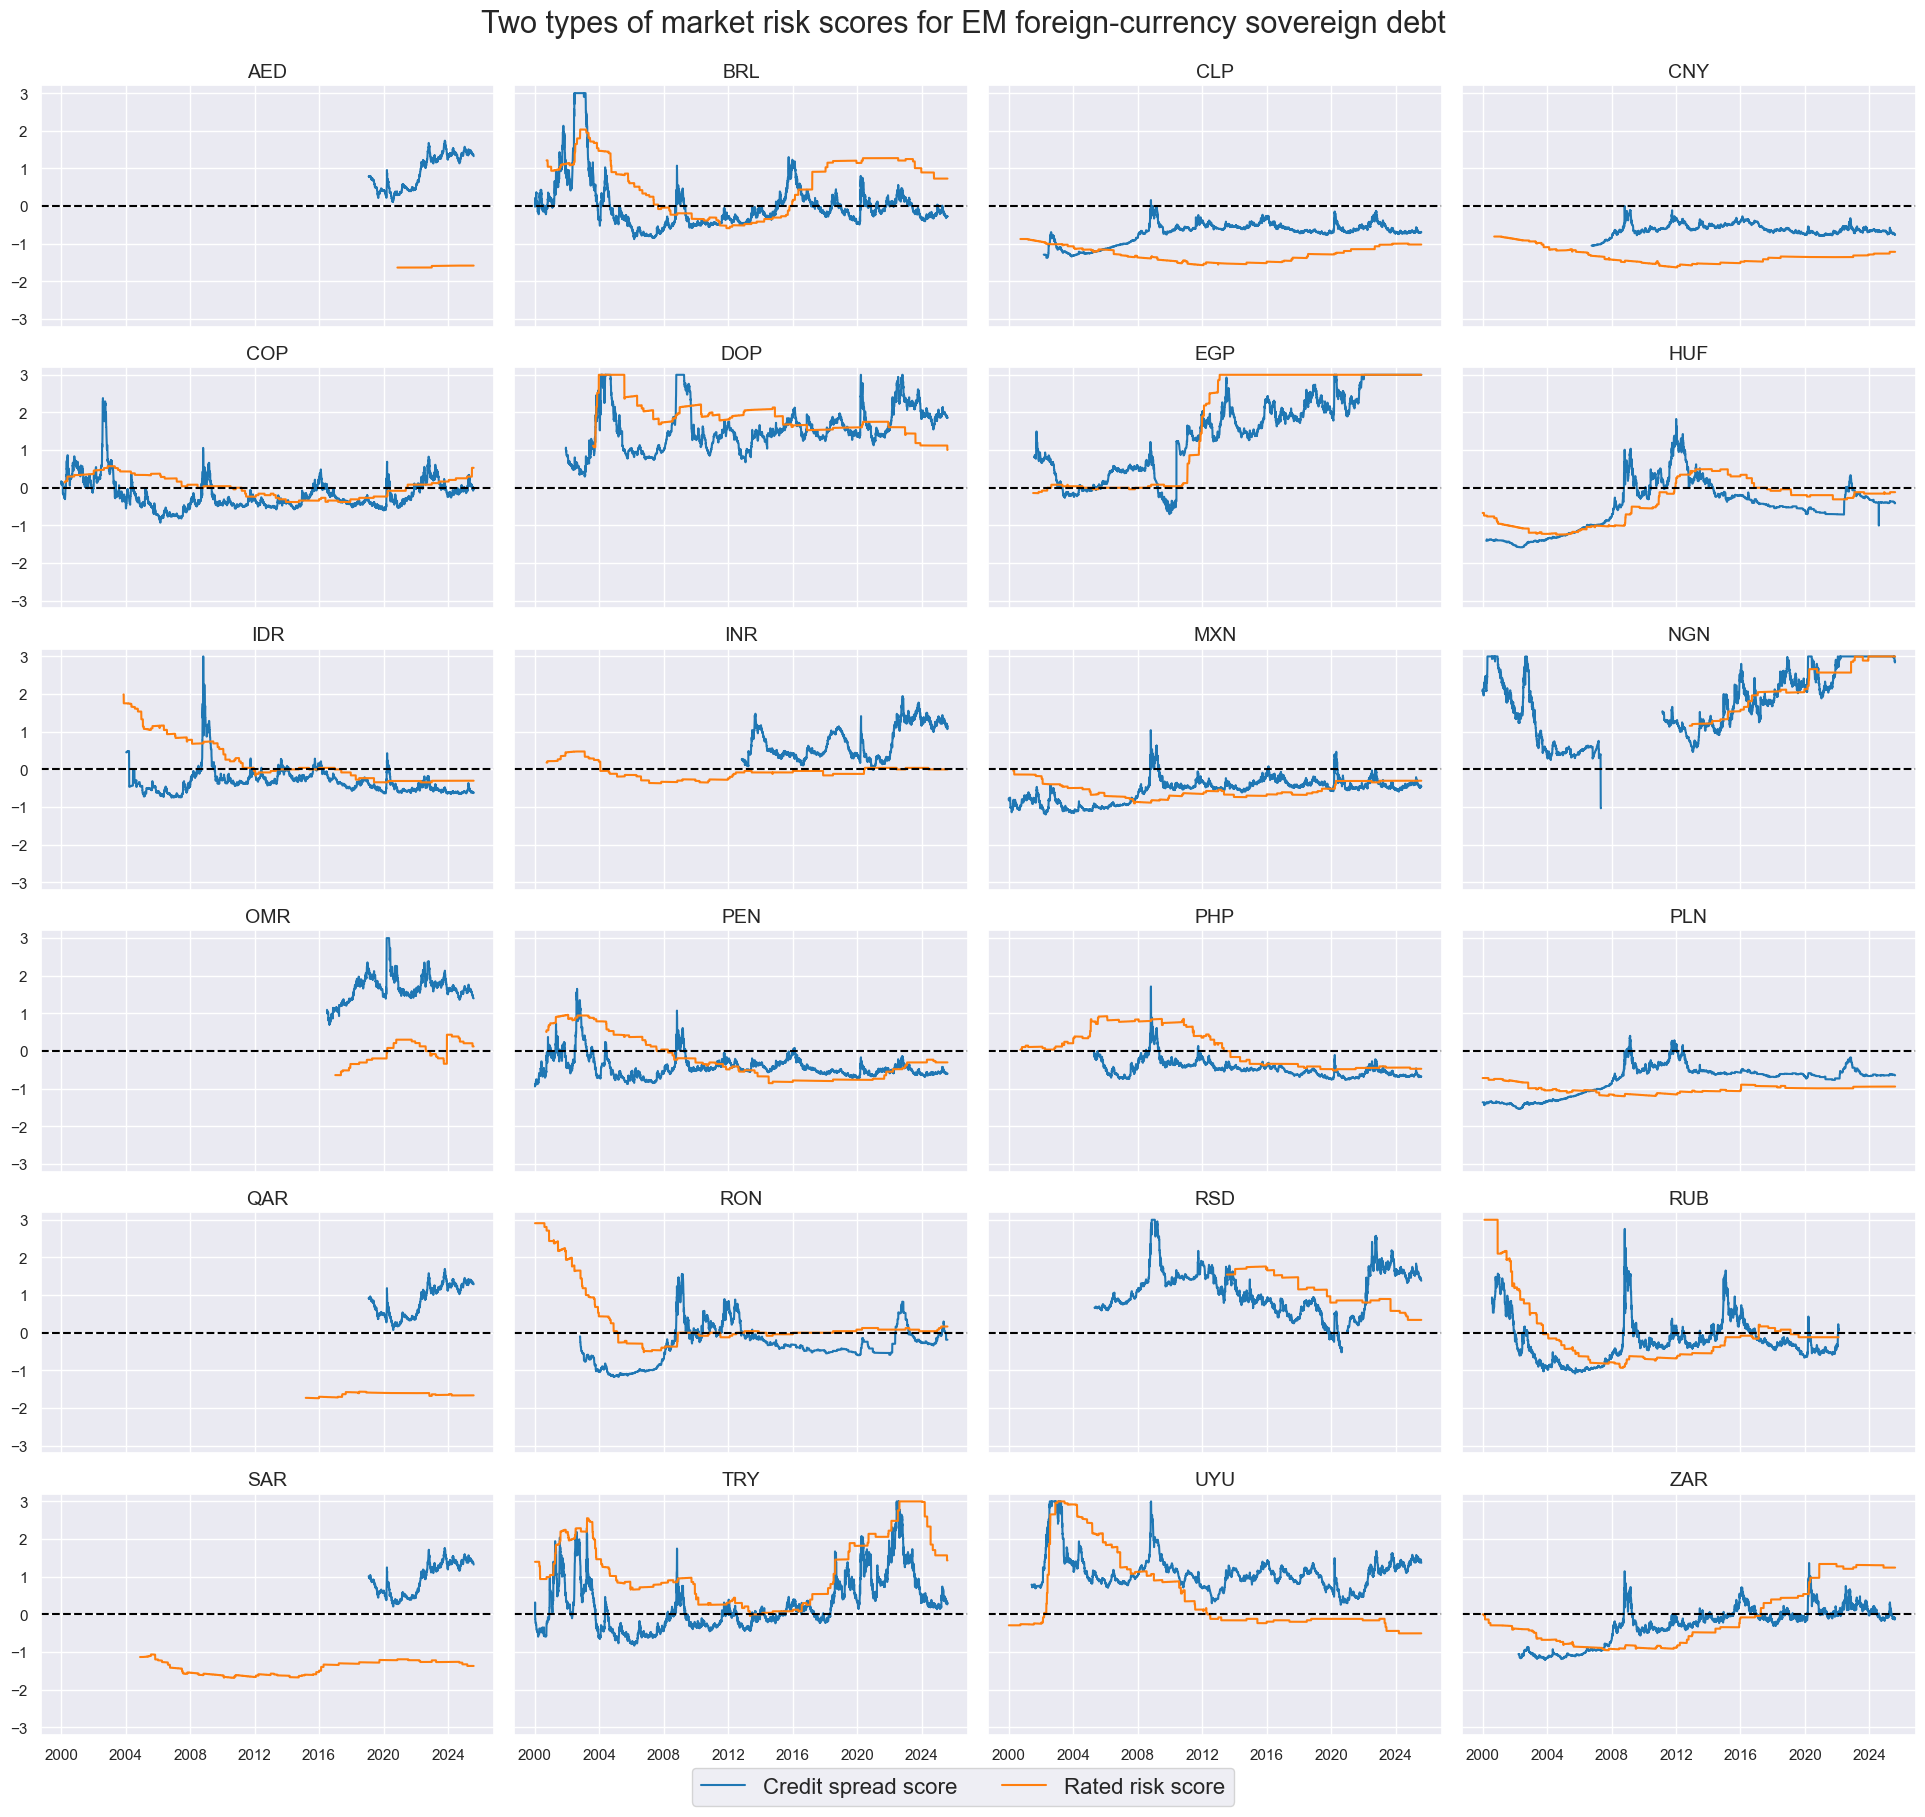
As market risk scores, we use two types:
- Spread scores are normalized 5-year CDS spreads (documentation here) using the mean and standard deviation of the full panel up to each point in time. For the ten sovereigns without a liquid CDS market, spreads are approximated by the foreign-currency bond index carry (documentation here).
- Ratings scores are calculated based on long-term foreign-currency sovereign credit rating indices. These indices are calculated as a weighted average of ratings and outlook data of Fitch, S&P, and Moody’s (documentation here). The values go from 1 to 23, with a higher value indicating a better rating. However, for the purpose of risk scores, we have inverted the numeric values so that higher values indicate higher risk, which is analogous to spreads.
The normalization uses the same method that was used for macro risk. Both market risk scores are indicative of default risk and risk premia charged on foreign-currency bonds. However, they do not always convey the same information. Generally, spread scores are more variable and subject to market conditions. Rating scores are more stable but also adjust more sluggishly to actual risks.
Macro risk premium scores are calculated at the level of conceptual risk factors as well as for an unweighted average of all risk factors. They are simply the sum or market risk scores, which indicate market compensation of risk, and macro scores, which represent the fundamental quality of the sovereign credit. A high macro risk premium means that markets charge a high premium for comparably little quantifiable fundamental risk.
The below timeline facet shows the aggregate spread-based and rating-based macro risk premium scores, as well as a composite of the two, which we call the overall macro risk premium score. All of them have been highly autocorrelated.
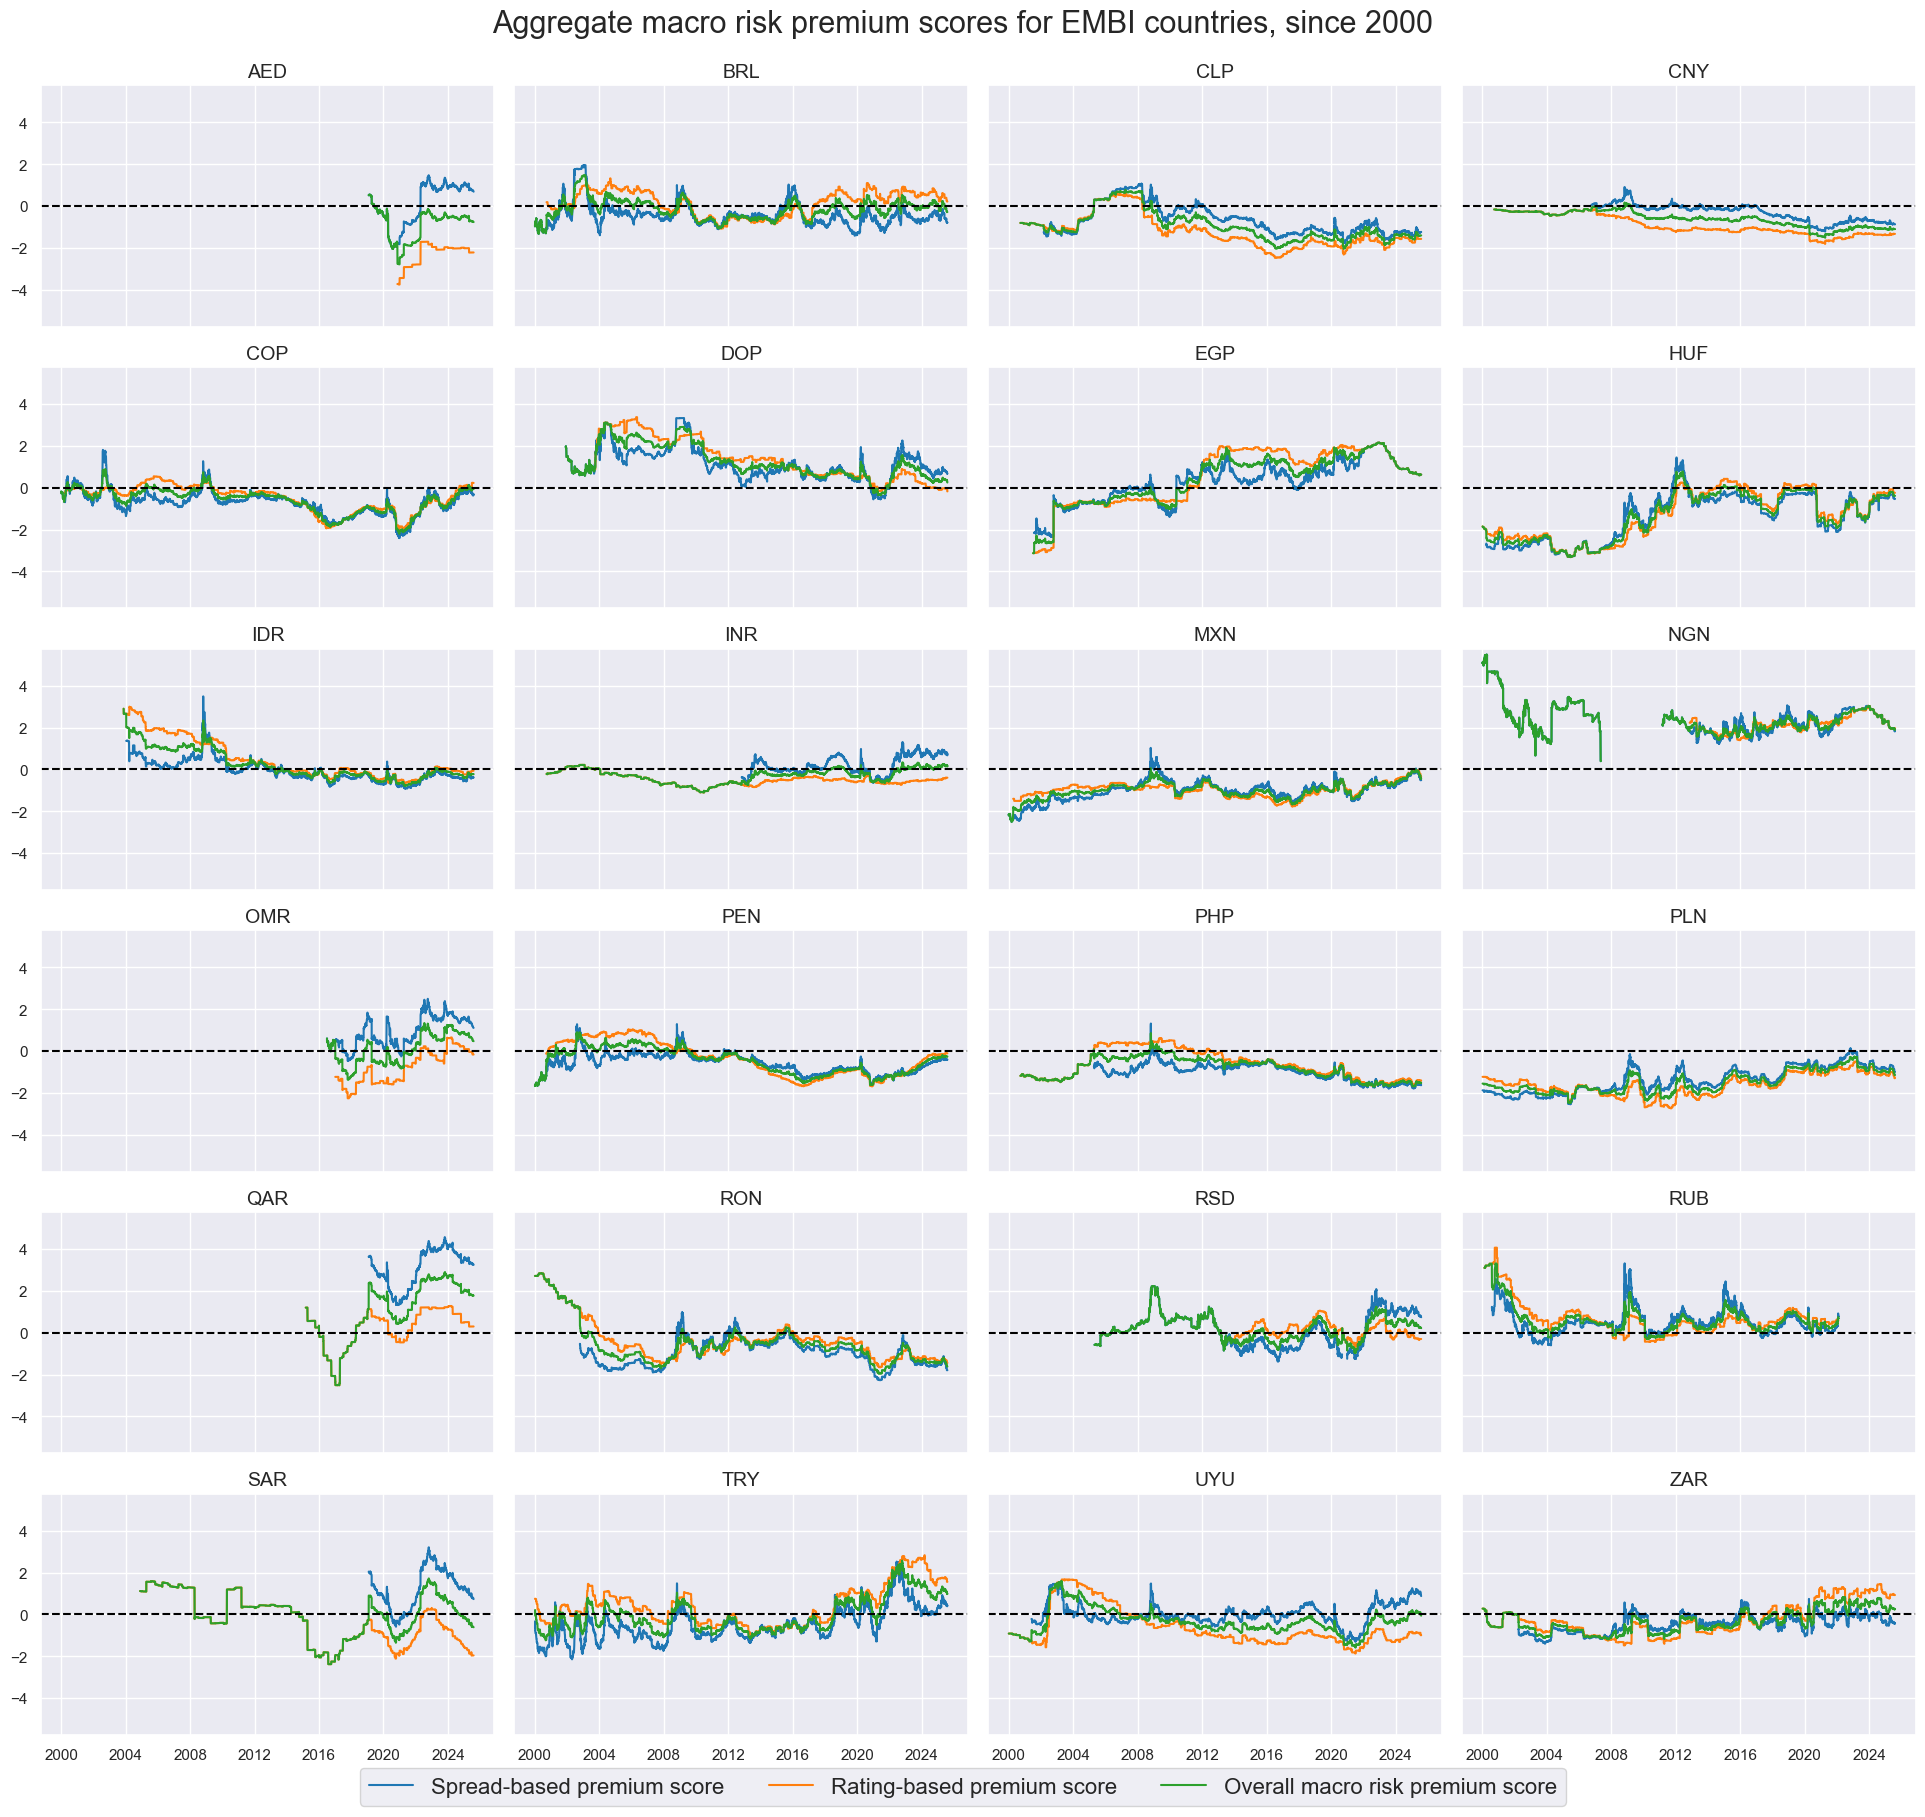
These scores are incomplete but not naïve. On any given day, they may be inferior to a complete in-depth assessment of priced and fundamental risk. However, they give continuous and consistent signals that are particularly relevant in times of low attention or periods of market turbulences (view post). Also, they are point-in-time indicators and, hence, testable.
- At the conceptual level, macro risk premium scores show if a particular risk factor commands a high or low compensation. This matters when the salience of specific factors increases to the point of dominance. For example, in case of a re-rating of global sovereign credit risk, the general government finance factor would become particularly important.
- At the aggregate level, the macro risk premium scores become more meaningful, the more complete the set of risk factors, and the better they are composed. A broad and carefully weighted set of macro scores would make macro risk premia a very information-efficient guide to trading. The small set used in this post may be just a modest basis, but, as shown below, it is already sufficient to add material investor value.
Macro-quantamental scorecards for EM foreign currency portfolios
There are two ways to apply macro risk premium scores: as a systematic strategy and as an overlay to the discretionary portfolio. The latter can be done in the form of macro-quantamental scorecards
Generally, a macro-quantamental scorecard is a condensed presentation of macroeconomic information with predictive power for specific financial contract returns. It is suitable for enhancing the information efficiency of discretionary management and allows the addition of a systematic layer to investment decisions. The predictive power and economic value of such systematic guidance are quantifiable based on historical analysis and backtests, as shown below. Macro-quantamental scorecards can also be intermediate steps for integrating macro information into systematic trading.
The first type of scorecard is a point-in-time snapshot. For the standard quantamental data format, it can be easily created in Python by using the view_snapshot() method of the ScoreVisualisers class in the open-source Macrosynergy package. Snapshots of macro risk premium scores indicate which credits compensate well and which compensate poorly for different types of macro risk. They can be guidance for default positioning and allow comparing market perceptions with fundamental realities.
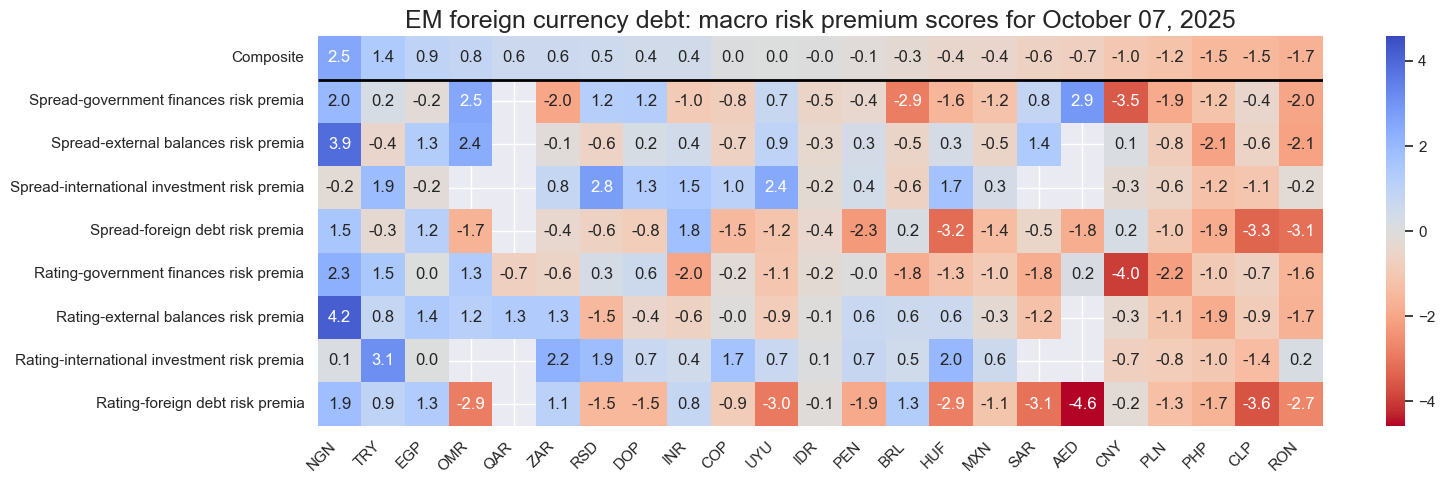
Blank cells in the above scorecard mean that either the risk or the macro score is not available for a particular concept. This is a common limitation in emerging market credit, particularly in the case of so-called “frontier” countries. Composite scores are then calculated based on available macro risk premium scores. A valid alternative would be to penalize credits for lack of transparency in a certain field.
The below historical scorecard displays the long-term evolution of composite risk macro scores across the 24 EM sovereign credits. This view can be created through the view_score_evolution() method of the ScoreVisualisers class. The macro risk premium scores in the present example have been highly autocorrelated even at a quarterly or annual frequency and almost structurally biased to the high or low side for some countries. For example, macro risk compensation has mostly been low for the EU countries Hungary and Poland but high for frontier markets like the Dominical Republic or Nigeria. Importantly, although most countries have gone through common global credit events, such as the great financial crisis or the COVID-19 pandemic, risk scores have mostly remained diverse across countries.
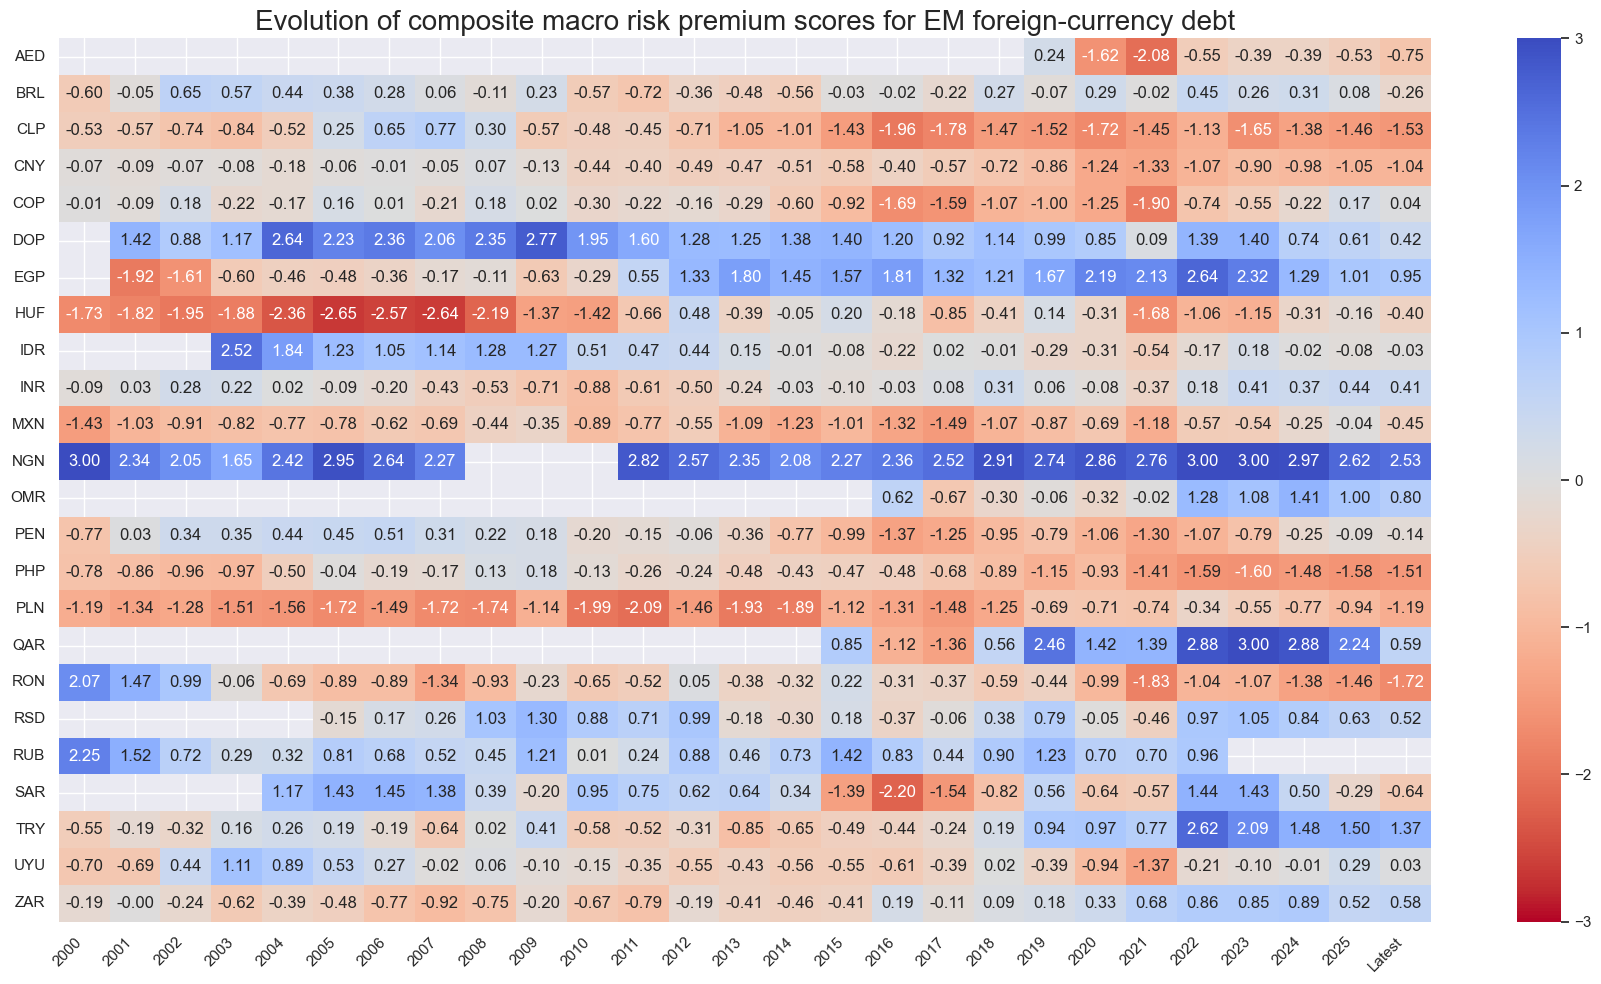
Persistent differences in macro risk premium scores plausibly reflect two causes.
- Markets often charge premia unrelated to default risk, for example, for poor liquidity, political history, or geographic location. These may change only very slowly but are valid contributors to risk compensation and, thus, desirable to be tracked by the score.
- Markets surely charge premia related to default risk factors that are not considered in this post, such as those related to poor governance and military conflicts. Their disregard is not desirable and diminishes the precision of macro risk premium scores. Thus, plausibly, the EMBI scorecards might benefit from point-in-time metrics of the corruption perceptions index of Transparency International, the governance indicators of the World Bank, or the global peacefulness rankings of the IEP.
Finally, country scorecards can give an overview of conceptual factor developments, allowing the comparison of common views on countries with objective metrics of macro risk compensation.
Evidence of predictive power and value generation
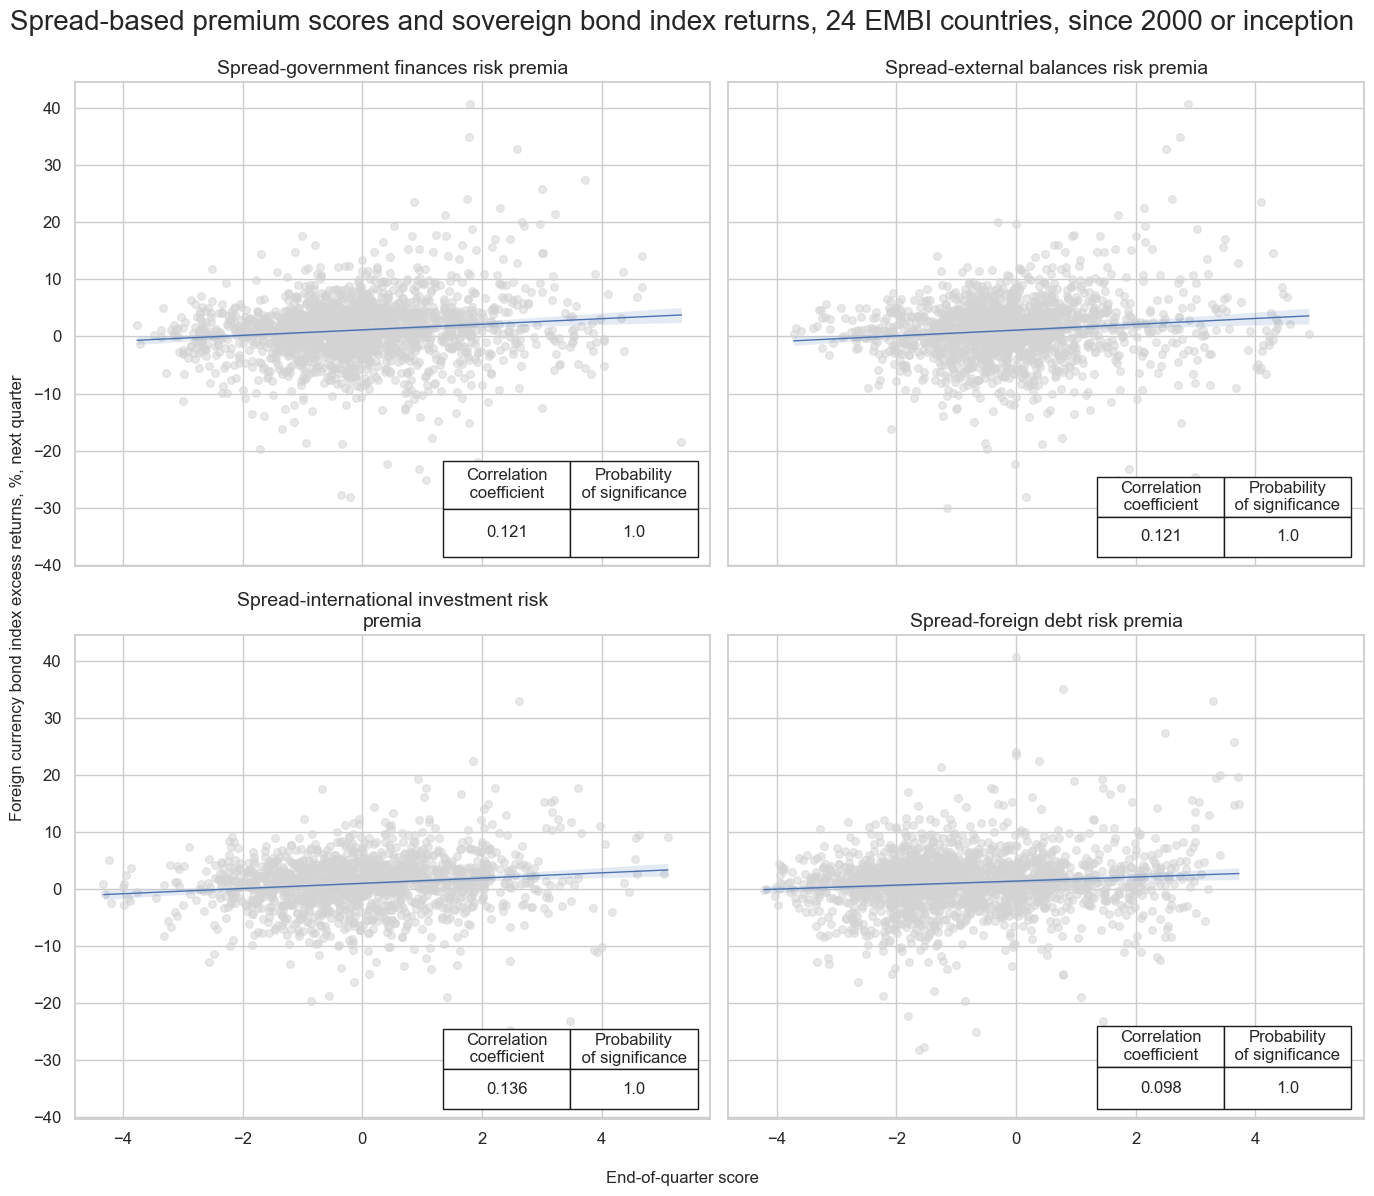
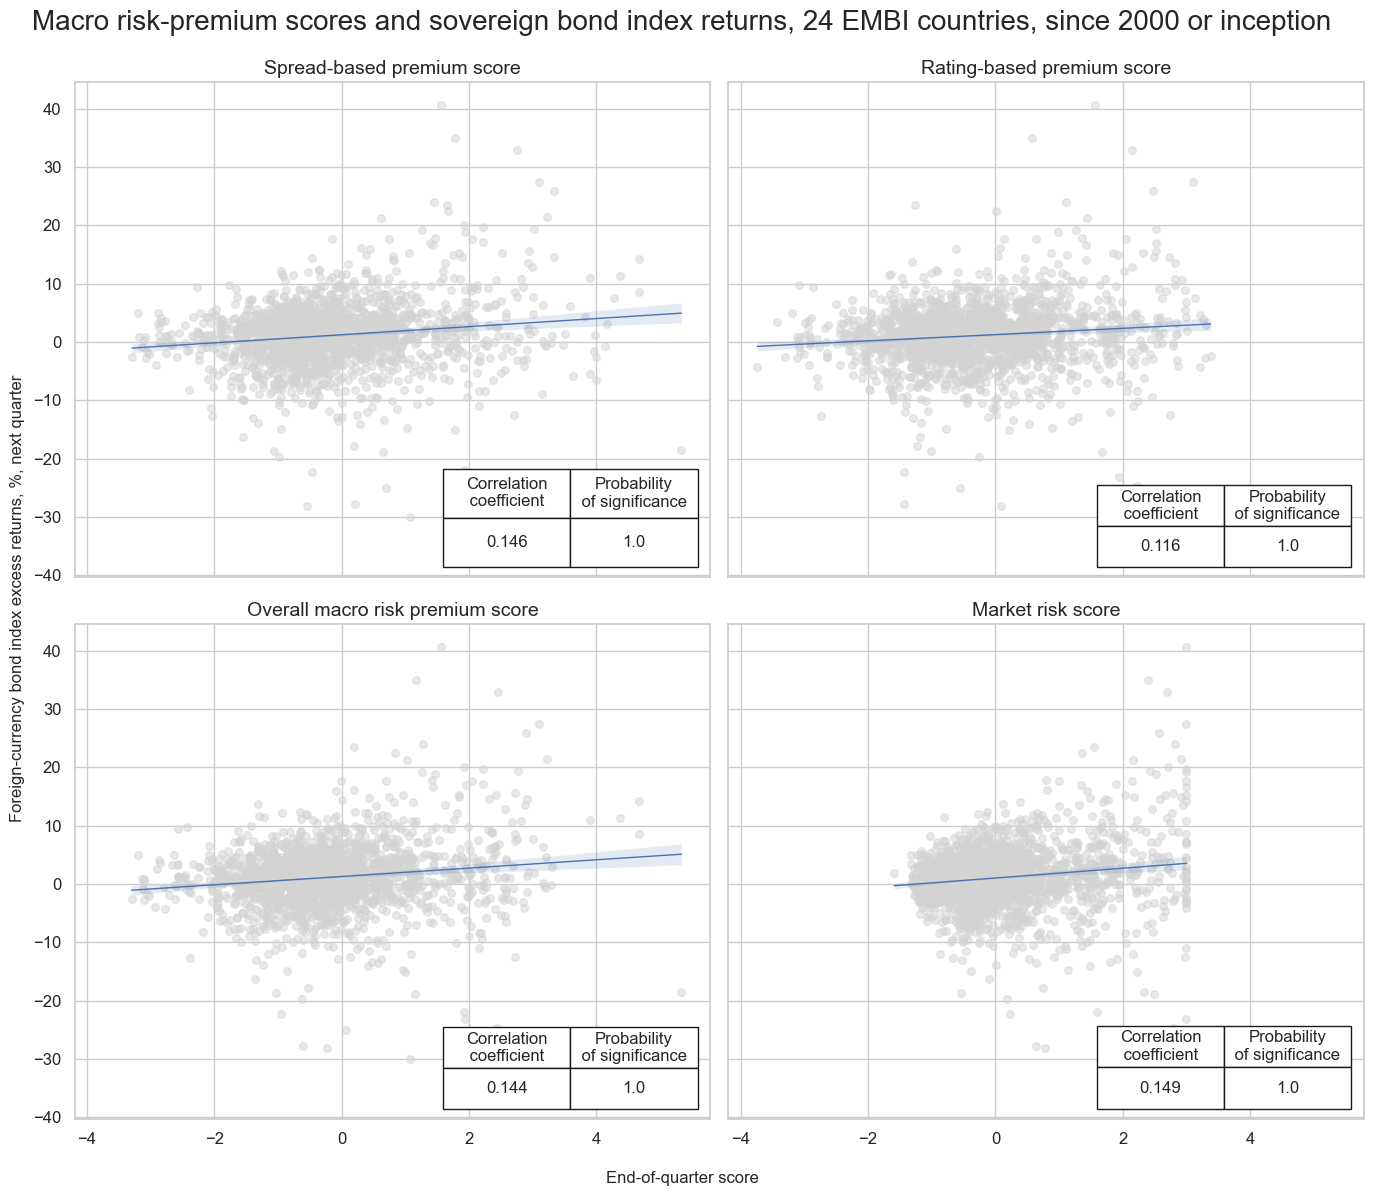
We first test the directional predictive power of macro risk premium scores with respect to subsequent monthly or quarterly country bond index returns minus funding costs. This is done through panel regressions and the Macrosynergy panel test, which adjusts returns and predictive scores of the regression for common (global) influences (view methodological post here). Indeed, all four spread-based macro risk premium scores have recorded highly significant positive predictive power with respect to subsequent country index returns at both quarterly and monthly frequencies.
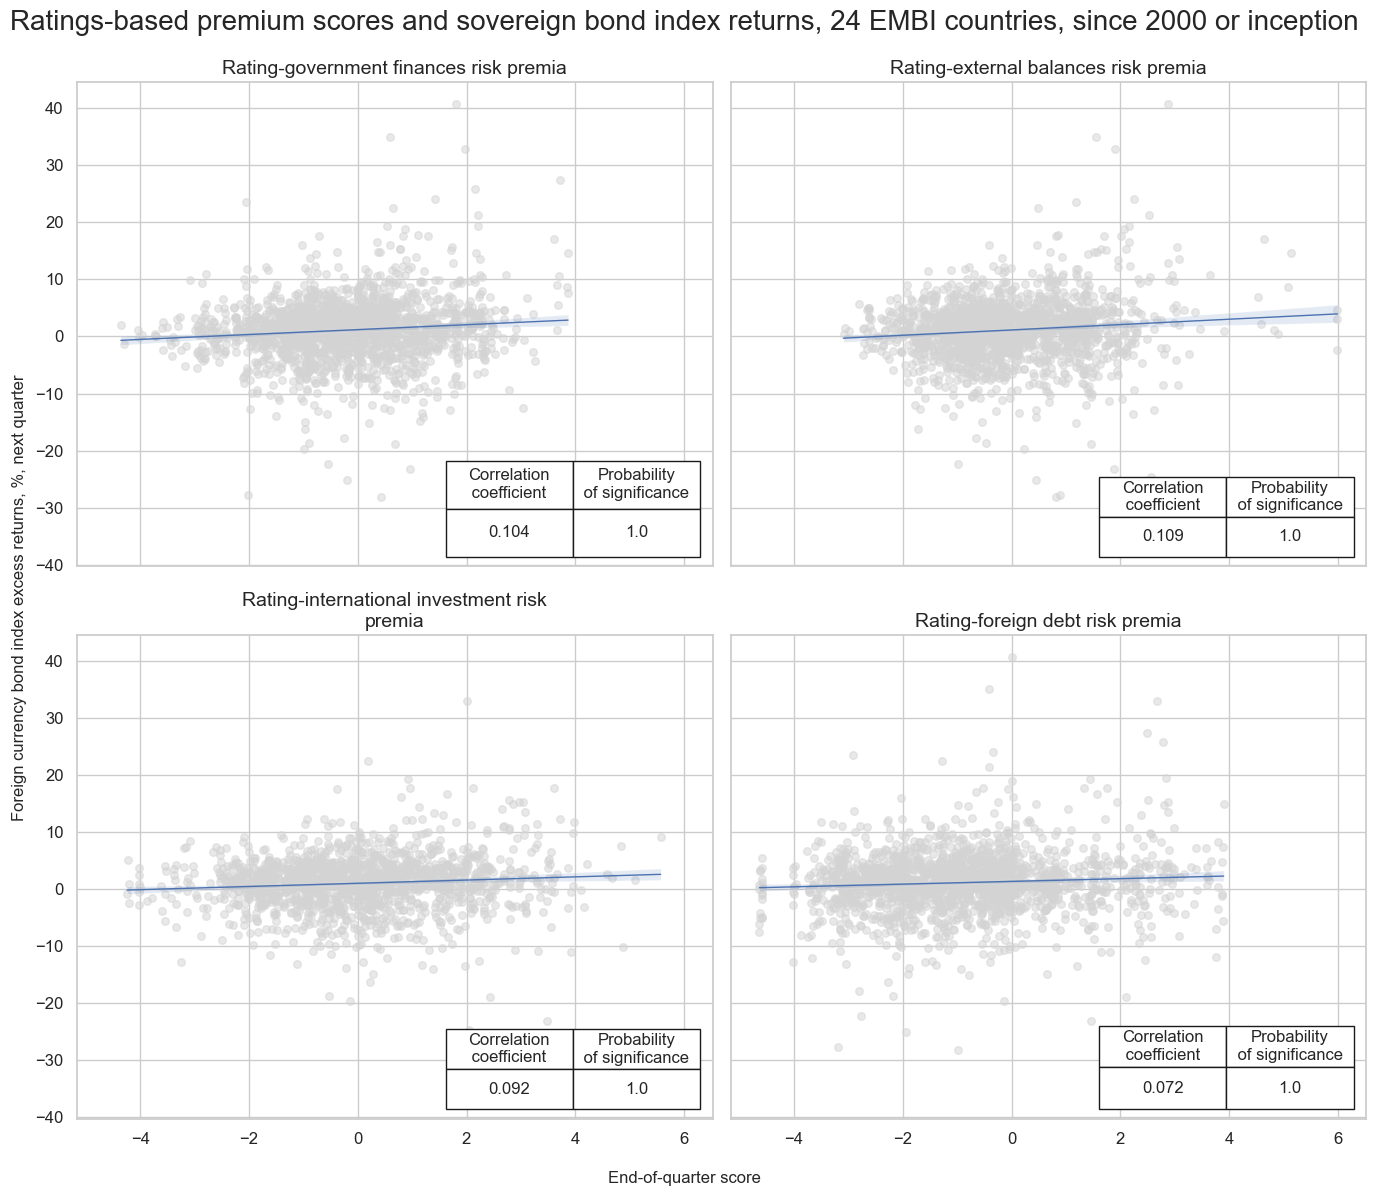
Similarly, all ratings-based macro premia have predicted subsequent bond index excess returns positively and significantly at a monthly and quarterly frequency.
Finally, we check the predictive power of combined macro risk premia and a market risk score. The latter is a simple average spread and ratings measure and serves as a benchmark for the predictive power and economic value of macro risk premium scores. Again, all predictive relations have been positive and highly significant.
The evidence shows the pervasive predictive power of macro risk premia in EM foreign currency bond markets. However, it is also important to understand how macro risk premium scores are superior to simple market risk scores, e.g., spreads and ratings without macro data. This is where many analyses go wrong. Given that macro risk premia have similar predictive power as simple market risk scores and given that the macro risk portion alone is negatively correlated with future returns, one could easily be misled into dropping the latter. However, the inclusion of the macro risk factor changes the characteristics of resulting trading signals from one that is just going after the greatest risk to one that is going after the highest excess premia, i.e., the portion of premia that is not justified by bad fundamentals.
The benefit of this “quality upgrade” shows in a range of analyses:
- The balanced accuracy, i.e., the average ratio of correctly predicted positive and negative monthly returns, is higher for macro risk premium scores (52.3%) than for market risk scores (51.5%).
- The predictive relation of macro risk premium scores with subsequent volatility targeted bond returns is higher and more significant than for market risk scores alone. This means that macro risk premium scores are better at predicting risk-adjusted returns, as they are not just reaching for the highest yield.
- The economic value of macro risk premia as signals for EM bond portfolios is notably higher than for market risk signals. This is due mainly to more profitable allocation across sovereigns.
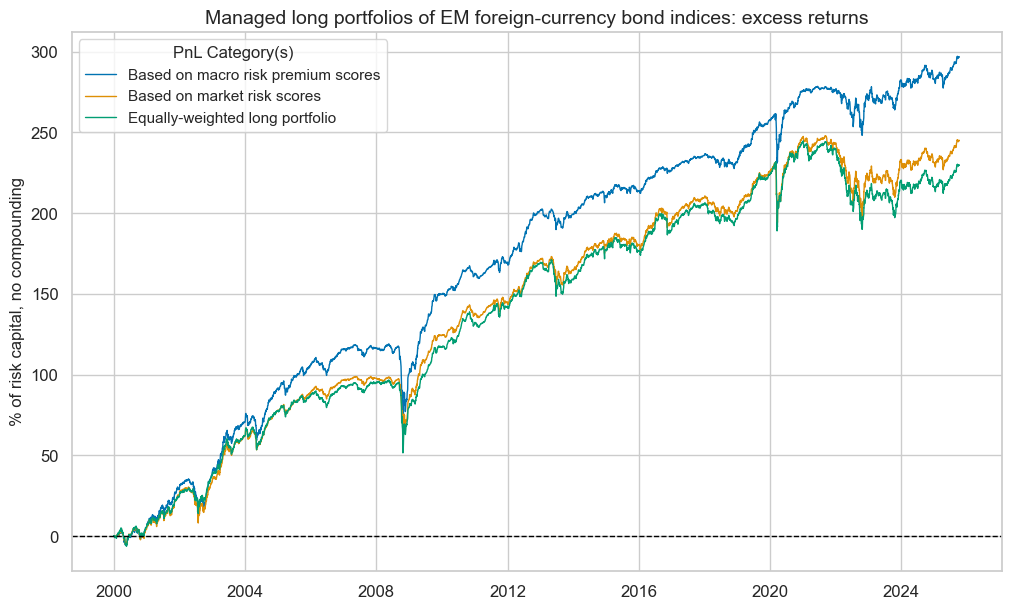
To assess the economic value of risk premium scores, we simulate a naïve PnL according to the standard rules of Macrosynergy posts. These simulations do not include transaction costs, which depend on the size of positions. Here, we translate macro risk premium scores and simple market risk scores into signals suitable for a long-only portfolio. This means we normalize the country scores, winsorized them at -1 and 1, and then add 1. The resultant signals will all be between 0 and 2. No short positions are taken, and exposure can, at most, double. Positions are taken based on month-end signals at the beginning of the following month with a one-day delay for trading. Returns are calculated net of funding costs and are not compounded. We compare macro risk premium signals with similar risk market signals and an equally-weighted portfolio of all countries. All PnLs are normalized at 10% annualized volatility for easy comparison of risk-adjusted returns.
The 25-year Sharpe and Sortino ratios of the portfolio based on macro risk signals have been 1.0 and 1.4, respectively, versus 0.9 and 1.2 for the market risk signal and 0.8 and 1.1 for the equally weighted portfolio. This means that only the macro risk premium signal increases the risk-adjusted performance of a long portfolio materially, not the market risk signal alone.
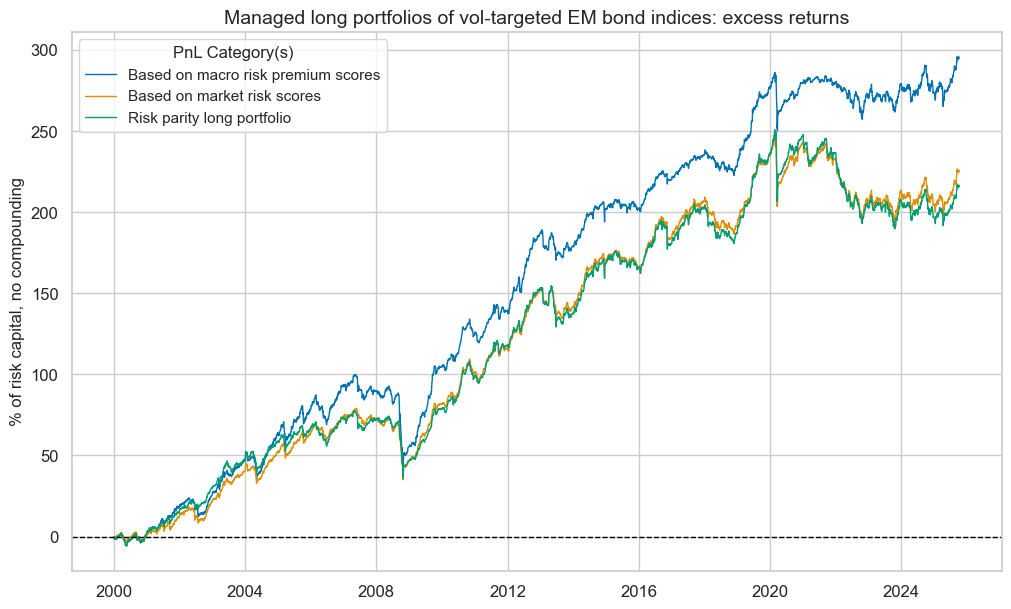
These results are echoed by a similar portfolio that allocates to volatility-targeted positions rather than simple notional positions. This means that we take one unit of expected volatility per unit of signal value in the various country indices.
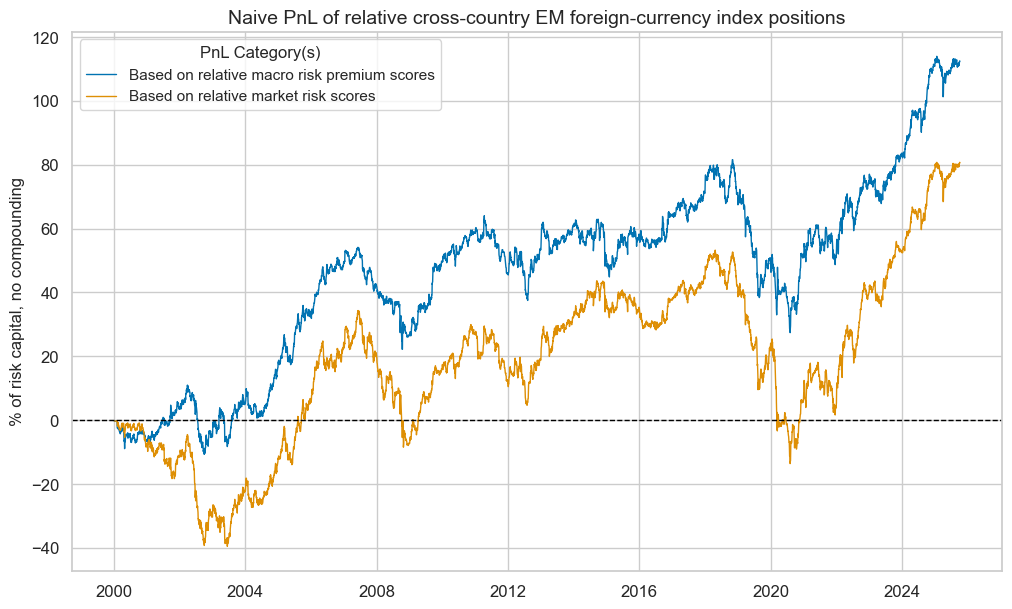
There is evidence that macro risk premium scores are particularly suitable as cross-country allocation factors. The below scatter plots and regressions show that relative macro risk premia have displayed positive predictive relations with subsequent quarterly relative returns of vol-targeted positions with a probability of significance between 99% and near 100%.
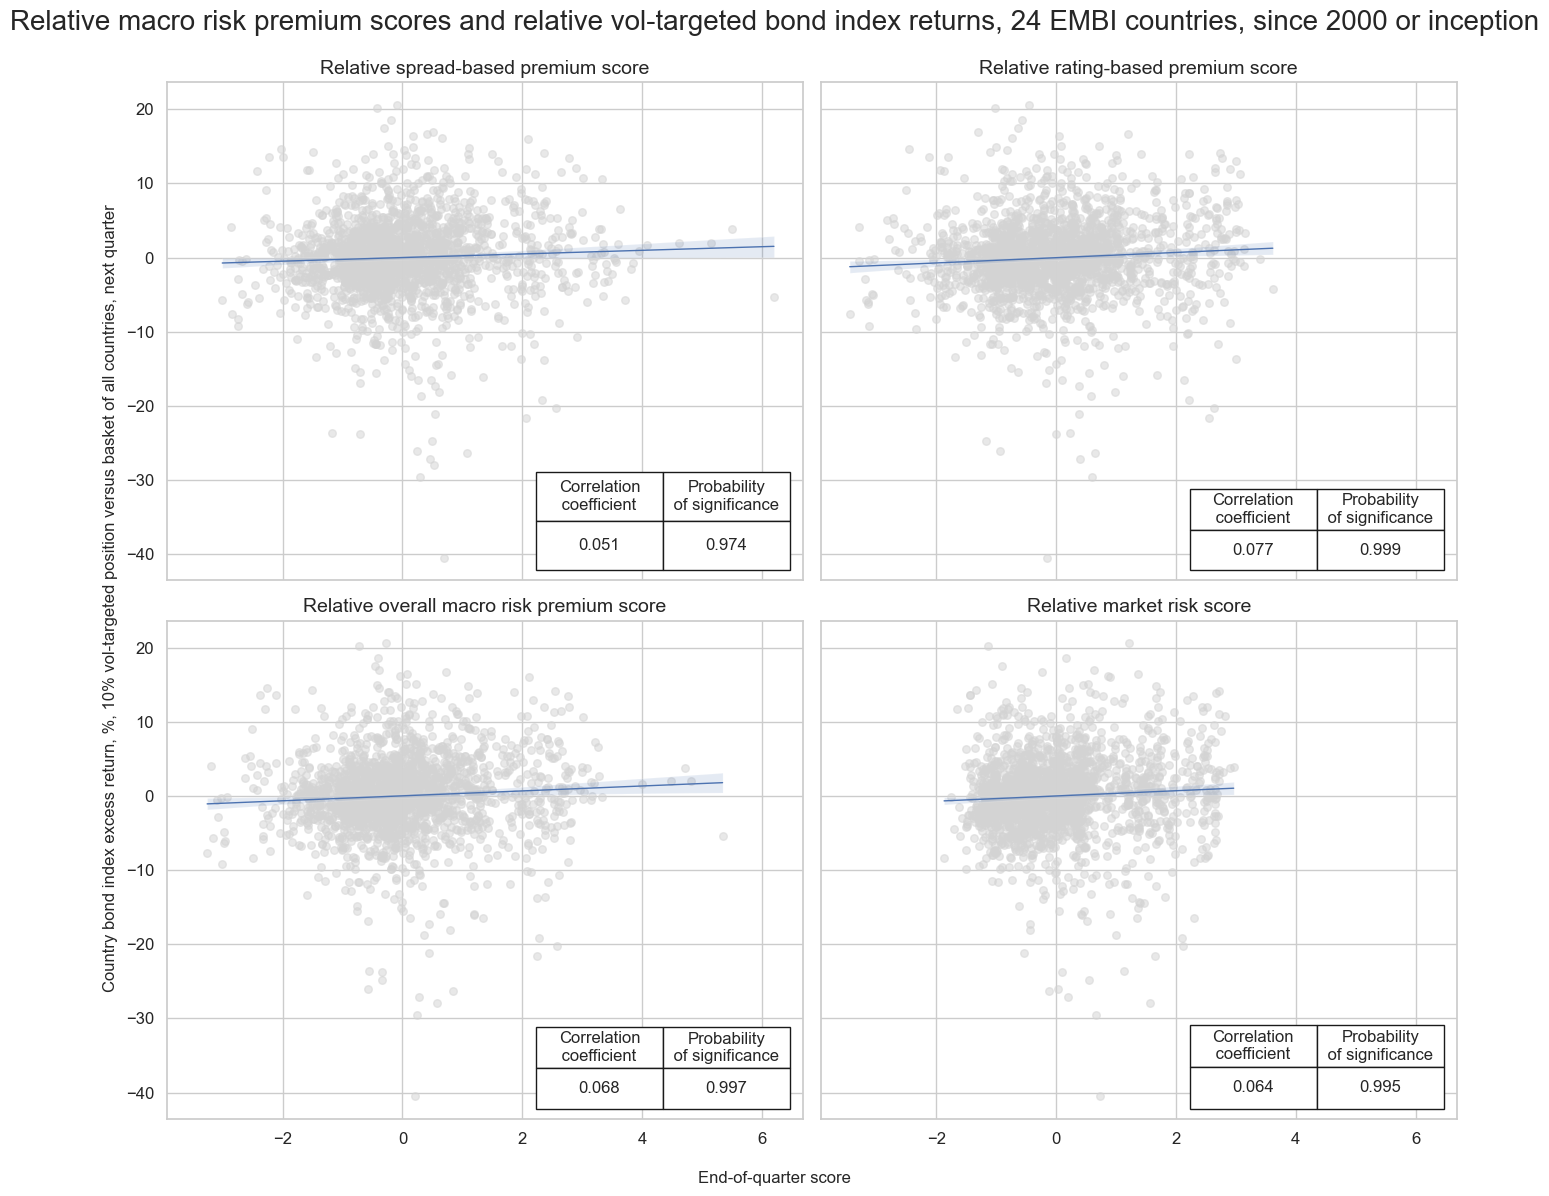
We assess the economic value of relative cross-country signals by simulating a naïve PnL that takes vol-targeted foreign currency bond index positions across countries in accordance with macro risk premium signals and market risk signals. As before, the risk scores are normalized and then winsorized at -1 and 1. The return on relative value positions alone has been modest but notable. There is a notable performance gap: the PnL using macro risk premium scores (Sharpe 0.5, Sortino 0.7) outperforms that based on market-risk scores alone (Sharpe 0.3, Sortino 0.5).
A basis for macro risk-aware bond indices
The weights of different countries in government bond indices, such as the EMBI Global, are determined by eligibility criteria and market capitalization. Simply put, countries are typically weighted proportionally to the size of their eligible government bond markets. This is understandable from the standpoint of liquidity and the intention to create a portfolio that is representative of the asset class.
However, weights that depend on outstanding debt without consideration of fundamental developments lend themselves to moral hazard. To the extent that asset owners track indices, countries or sovereigns with higher deficits and debt issuance are being rewarded by a relatively larger investor base. Hence, adjusting weights by macro risk premia should benefit both investors and overall financial stability. Remember that macro risk premium scores do not necessarily bias allocation to riskier or less risky countries but in favor of countries whose macro risk is overpriced or overrated and against sovereigns whose risk is underpriced or underrated.
To quantify the benefit of macro risk-aware bond indices, we compare the PnL of an EMBI Global proxy portfolio, based on the above 24 countries, with portfolios that alter weights in accordance with aggregate risk macro scores. The rules of PnL calculation are similar to the naïve PnLs displayed above, including monthly rebalancing and 1-day trading slippage. However, as we simulate index performance, we now focus on cash returns and consider compounding effects. There is no leverage or volatility targeting.
Modified index weights
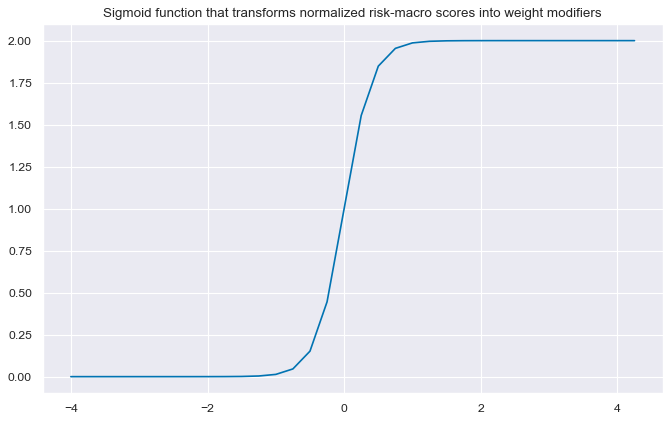
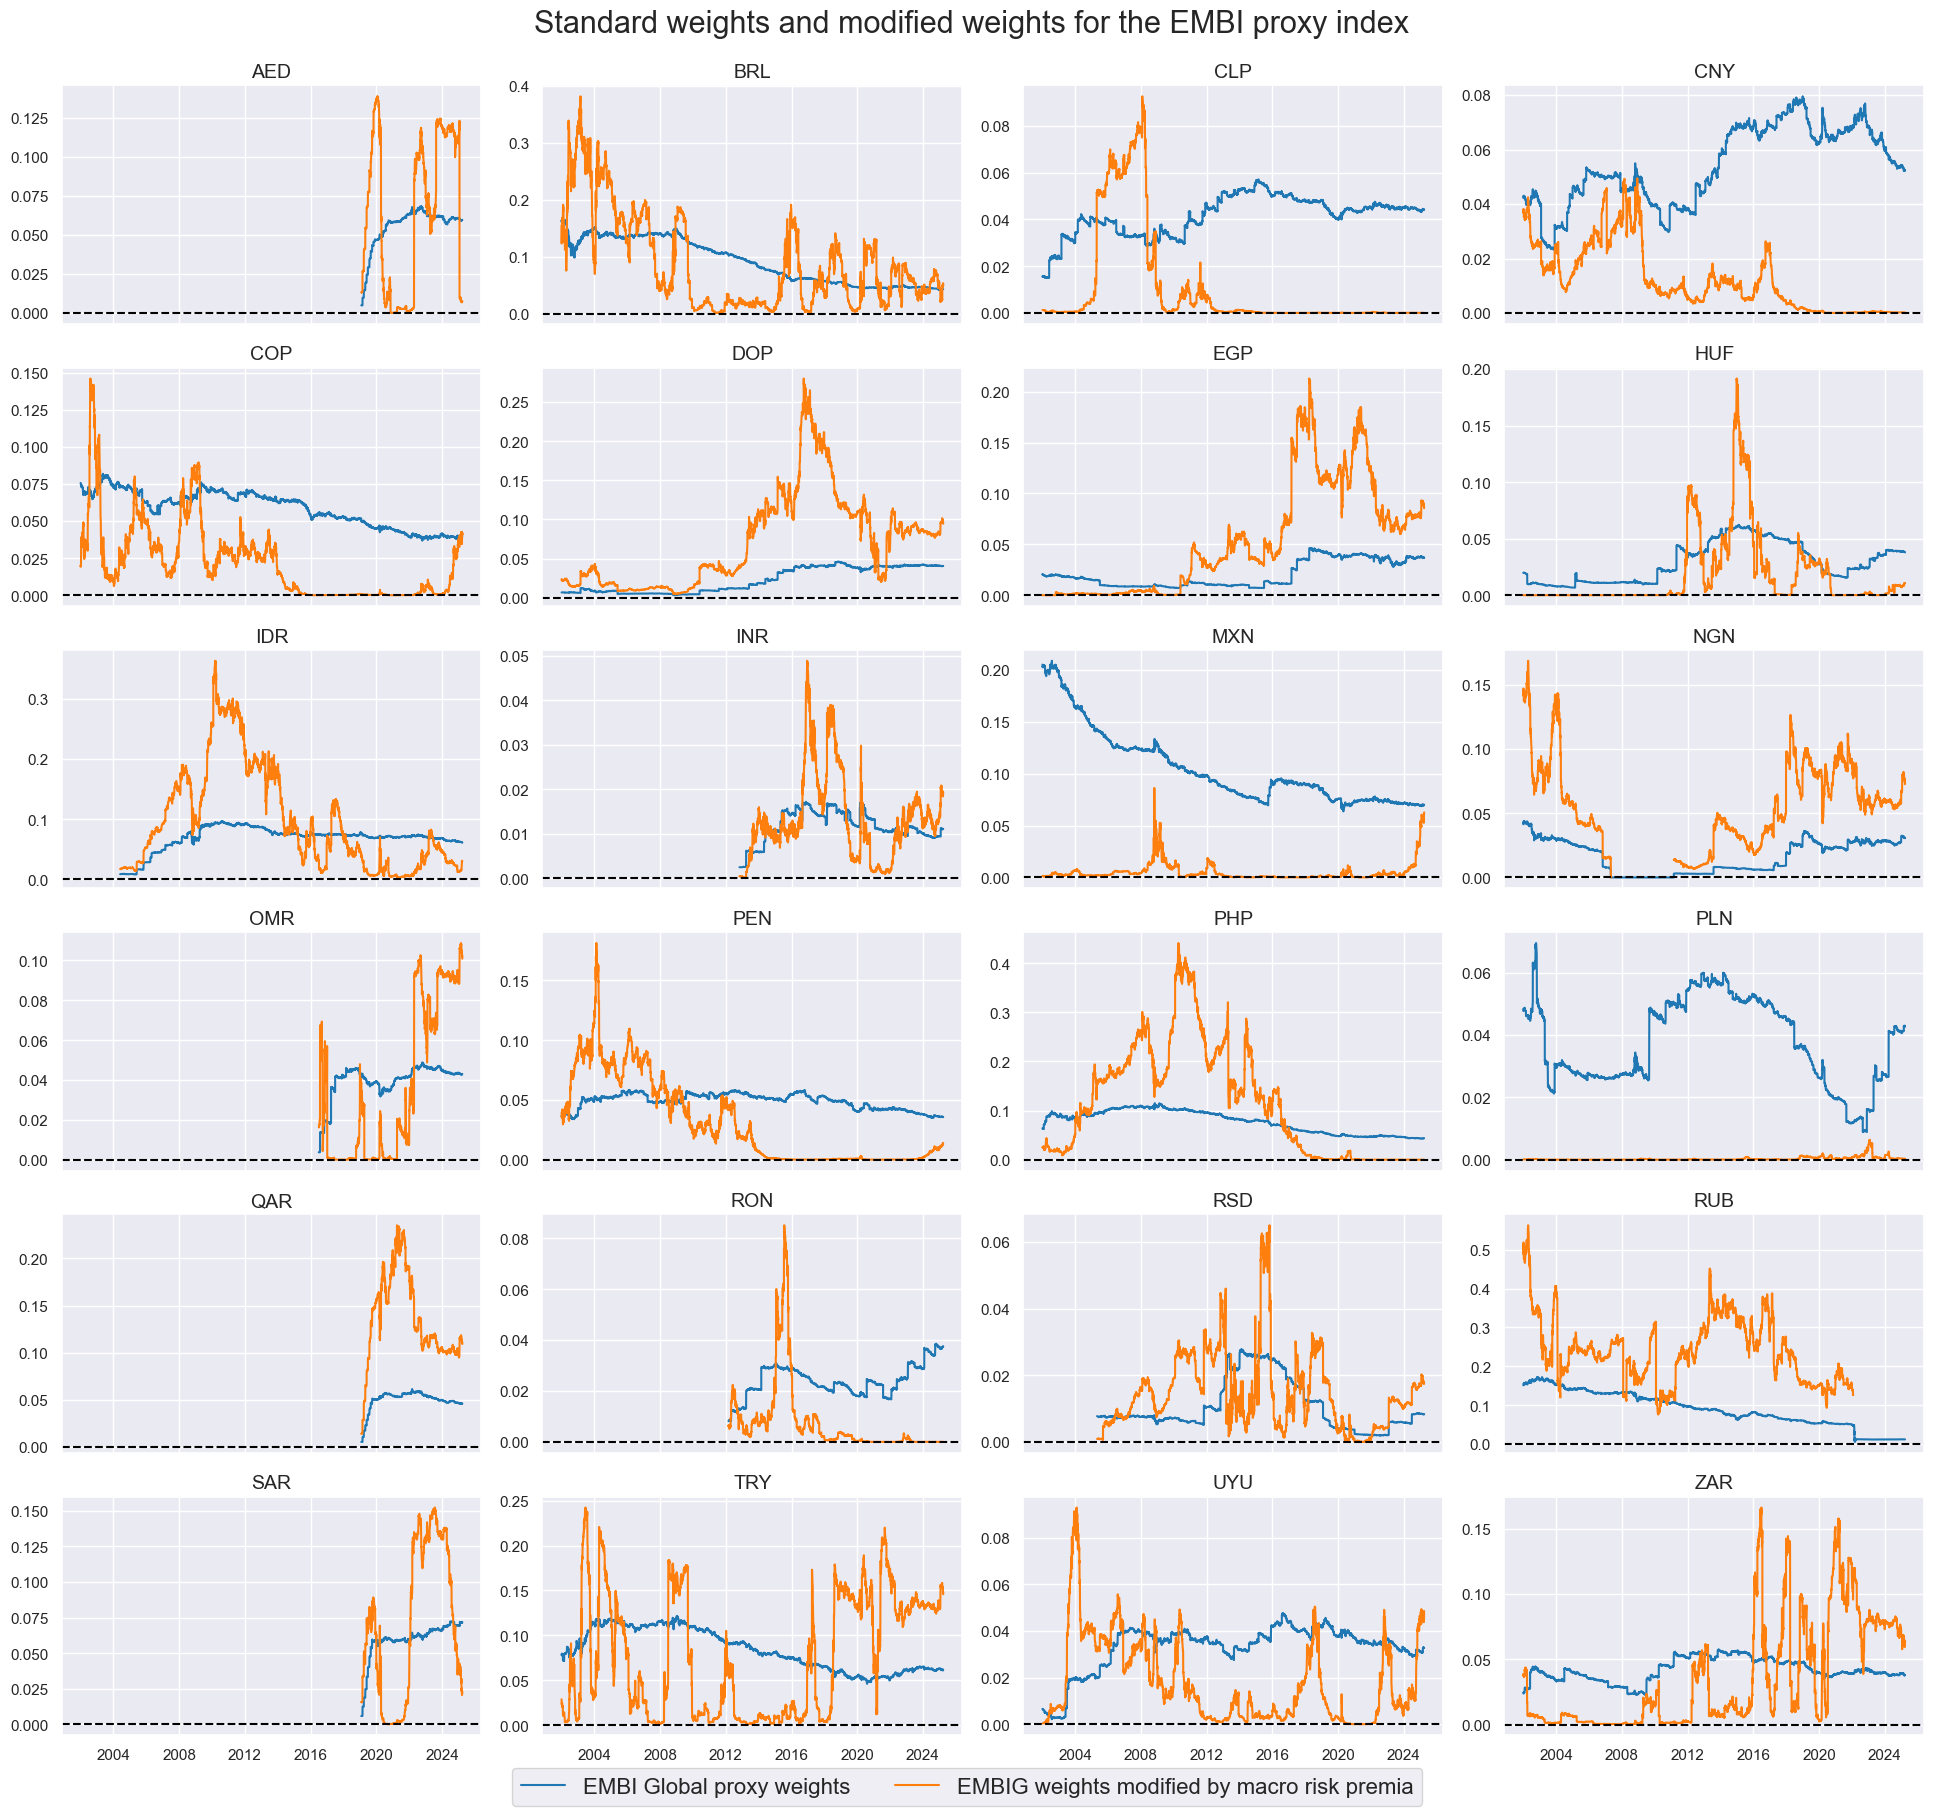
The below chart shows the performance of a portfolio with standard EMBI weights versus those with “modified” weights. “Modified” here means that all original weights are multiplied with a sigmoid (logistic) function of the normalized macro risk premium scores and subsequently renormalized. The parameters of the sigmoid are set such that the multiplicative factor is between 0 and 2. This means that if macro risk premium scores are very negative, the country weight goes to zero, and if they are very positive, the country weight doubles the original weight. These adjustments seem intuitive and are not optimized.
This modification adjusts weights frequently and aggressively, almost simulating a strategy that trades around standard allocation.
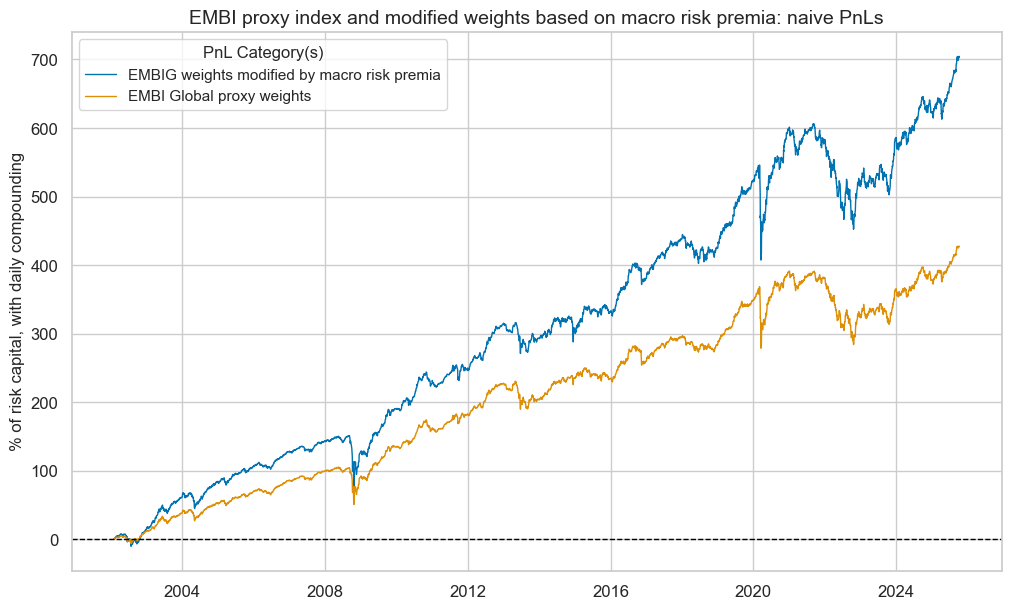
Over the past 22 years, the index with modified weights would have outperformed the standard index by a total of 250% on the initial invested capital, exceeding the standard total index return by more than half.
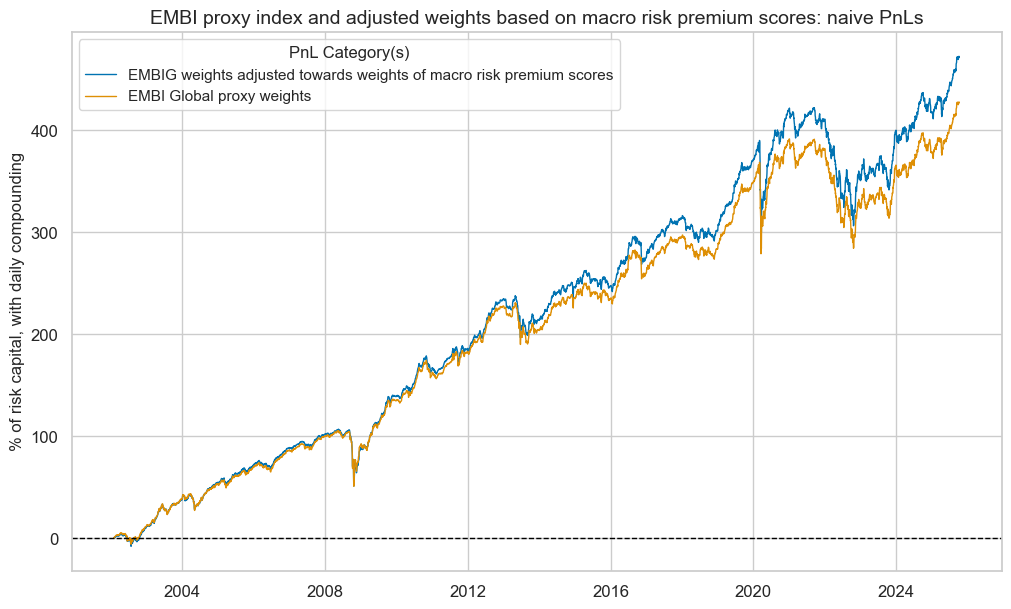
Adjusted index weights
The modified weight differences from standard weights have been large and variable, requiring frequent trading around standard weights. We also tested a gentler, more subtle adjustment that simply averages standard weights and weights that are proportionate to macro risk premium scores. We called these “adjusted weights”. They are more stable and closer to the original weights.
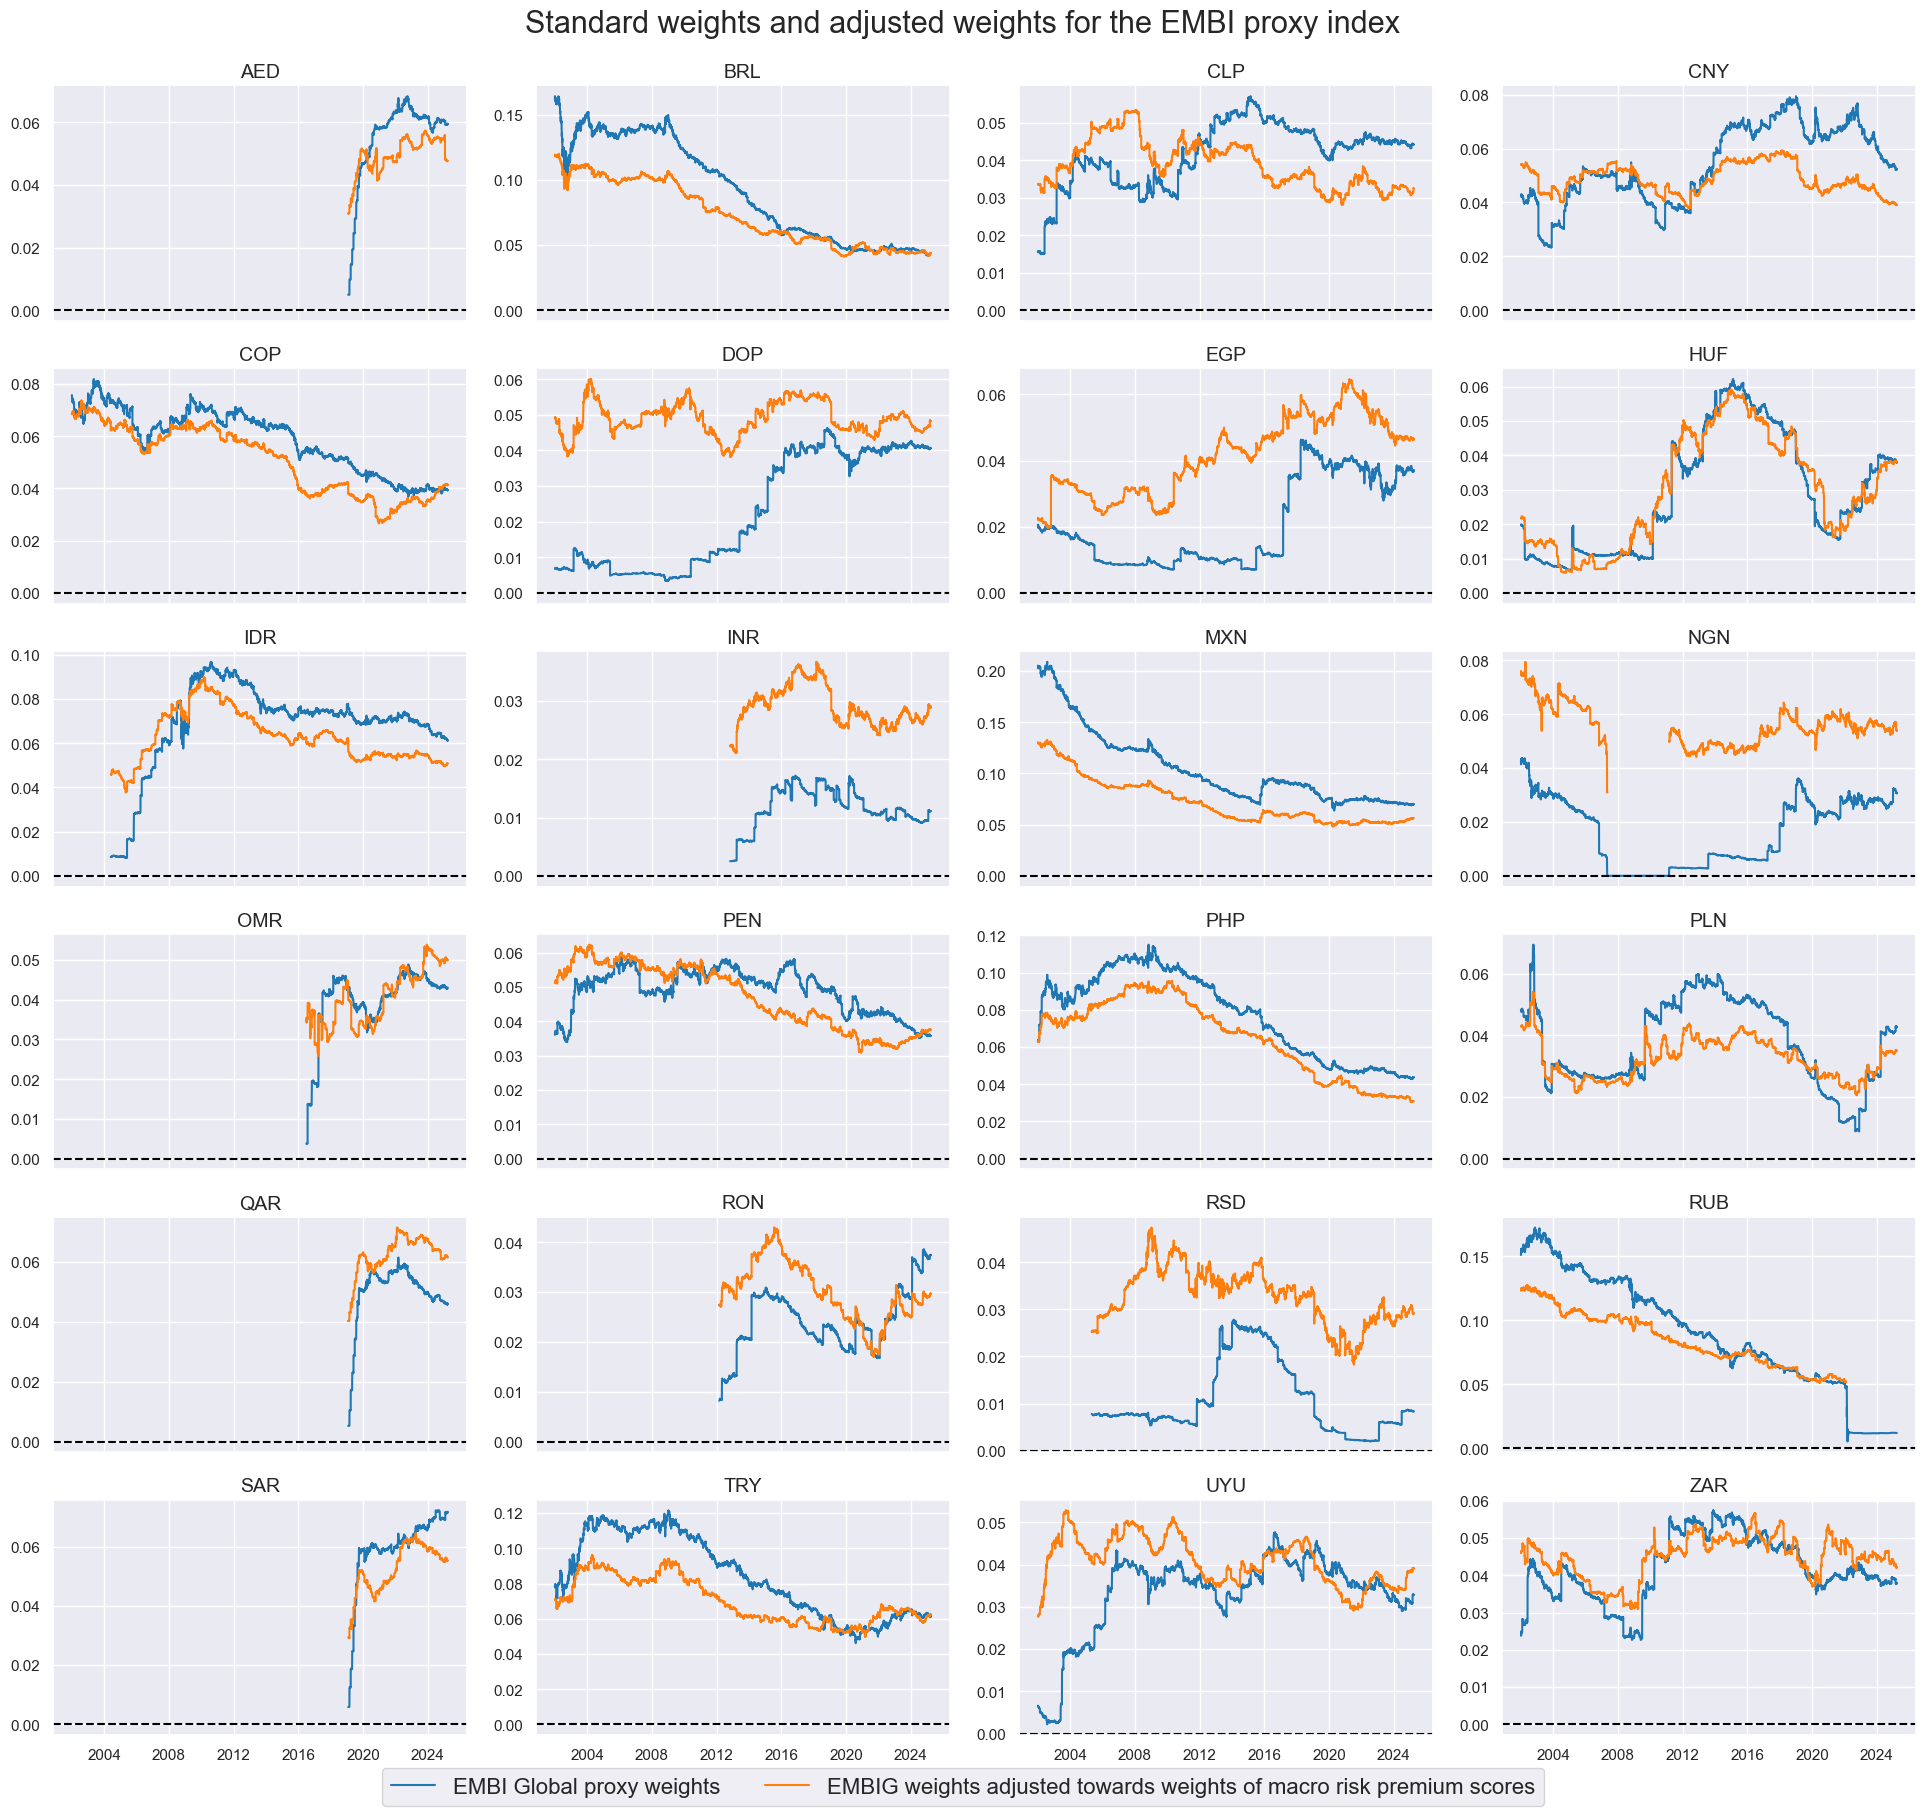
The index based on adjusted weights also outperforms the EMBI Global proxy portfolio with standard weights consistently, but only modestly, by about 0.3% per year or 6.5% of invested capital over the full 22 years. Generally, the larger the adjustment in the direction of the macro risk premium score-based weights, the larger the outperformance.