Risk parity is an investment strategy that allocates risk exposure equally across asset types through volatility-based calibration and leverage. A most profitable risk parity strategy in the past decades has been the equity-duration “long-long”, which harvests combined equity and long fixed-income risk premia, while containing return volatility through diversification. Alas, this position is vulnerable to “autonomous” monetary tightening shocks, i.e., surges in real interest rates without commensurate economic improvements.
The probability of such downside shocks depends on the macroeconomic environment. Hence, by adapting volatility-targeted risk-parity positions to economic overheating measures, strategies become macro-aware and more information-efficient. We show that simple point-in-time macro scores of excess inflation, growth, and overconfidence have predicted equity-duration returns across eight developed markets and for over three decades. Macro-aware signals have materially outperformed simple volatility-targeted positions, both in terms of absolute and risk-adjusted returns. The long-term effects of macro awareness on cumulative net asset value have been huge.
This post is based on Macrosynergy’s proprietary research. Please quote as “Sueppel, Elena and Sueppel, Ralph, ‘Macro-aware risk parity,’ Macrosynergy research post, May 2025.” This is a modified and extended version of a previous post (Macro factors of the risk-parity trade).
A Jupyter notebook for audit and replication of the research results can be downloaded here. The notebook operation requires access to J.P. Morgan DataQuery to download data from JPMaQS. Everyone with DataQuery access can download data except for the latest months. Moreover, J.P. Morgan offers free trials on the complete dataset for institutional clients. An academic support program sponsors data sets for research projects.
Basics of equity-duration risk parity positions
Risk parity is an investment strategy that allocates risk equally across contracts or asset classes. In practice, “risk” is quantified by a statistical measure of volatility, while “parity” balances volatility contributions across position components. The key objective of risk parity is diversification, and the main mechanism to accomplish it is leverage, i.e., the explicit or implicit use of borrowed funds to calibrate expected volatility relative to invested capital.
An equity-duration risk parity position is a position that allocates risk equally to equity and fixed income contracts, both in local-currency terms. Equity risk can be taken through an index futures contract, and duration exposure can be taken through a fixed receiver position in an interest rate swap or a bond future. Equity-duration positions are also commonly called “long-longs”, emphasising that they take risk in the two largest asset classes in financial markets.
Equity-duration risk parity positions are popular because they pay risk premia over two asset classes, while reducing portfolio allocation through diversification or even negative correlation:
- Risk premia: Broad equity and duration exposure pay premia, because investors dislike uncertainty, and neither type of risk can be fully diversified. With companies issuing shares and governments and corporates being the dominant issuers of long-maturity bonds, the standard risk-return optimising segment of the financial market has to be long both types of contracts. In equilibrium, private investors need to be paid some compensation for associated risks.
- Conditional negative correlation: In times of low inflation, the dominant macroeconomic shocks to financial markets are related to expected economic growth and the stability of the financial system. These shocks push equity and duration returns in opposite directions. An improving growth outlook benefits company earnings prospects but also lifts the trajectory for short-term interest rates, thus reducing the value of fixed receiver positions. Negative news on financial system stability reduces the value of most companies, but also forces central banks to cut interest rates or inject liquidity, increasing the value of fixed receiver positions.
The drawback of “long-long” positions is their concentrated vulnerability to pure monetary tightening shocks, i.e., events that trigger autonomous upward revisions of future real interest rates, without commensurate improvements in expected real corporate earnings growth. The classic trigger of this type of shock is an acceleration in consumer prices that pushes the expected inflation significantly above the central bank’s target. Monetary tightening shocks are toxic for long-longs because when they manifest, the correlation between equity and duration returns becomes strongly positive, and the volatility of risk parity positions rises disproportionately.
Shocks are, by definition, hard to predict. However, the probability of autonomous monetary tightening and correlation shocks depends on the economic environment. If inflation and growth are low, central banks are unlikely to impose large upward revisions in real interest rates on financial markets. This held true particularly during periods of deflation risk in the 2000s and 2010s in developed markets. However, if either inflation has risen above the central bank’s target or other indicators point to overheating risk, the probability of a big shift to monetary tightening is much larger. Moreover, with ample evidence of rational inattention to economic trends in financial markets, the careful monitoring of such risks should produce investor value.
Against this backdrop, an information-efficient and prudent equity-duration strategy should have two features:
- Double volatility targeting: Both the individual legs of the trade and the overall position should be volatility targeted. Volatility targeting means that past return standard deviations calibrate position sizes to scale them to a specific annualised volatility target. The first level of separate targeting of equity and duration positions mainly ensures that their relative sizes adapt to the conditions in equity and fixed-income markets individually. The second level of volatility targeting mainly adapts the overall position size to changes in correlation.
- Macro awareness: With overheating and high inflation being the main enemies of the long-long exposures, a composite of related indicators should be used as a positioning signal. Generally, equity-duration positions should bear less risk in times of high inflation risk than in times of low inflation risk or deflation fears.
The following sections show an example of how to implement these two principles to equity-duration positions in developed markets. We use data from the J.P. Morgan Macrosynergy Quantamental System (JPMaQS), which curates point-in-time measures of economic indicators, thus allowing meaningful backtests of the benefits of macro awareness.
Setting up long-long trades with volatility targeting
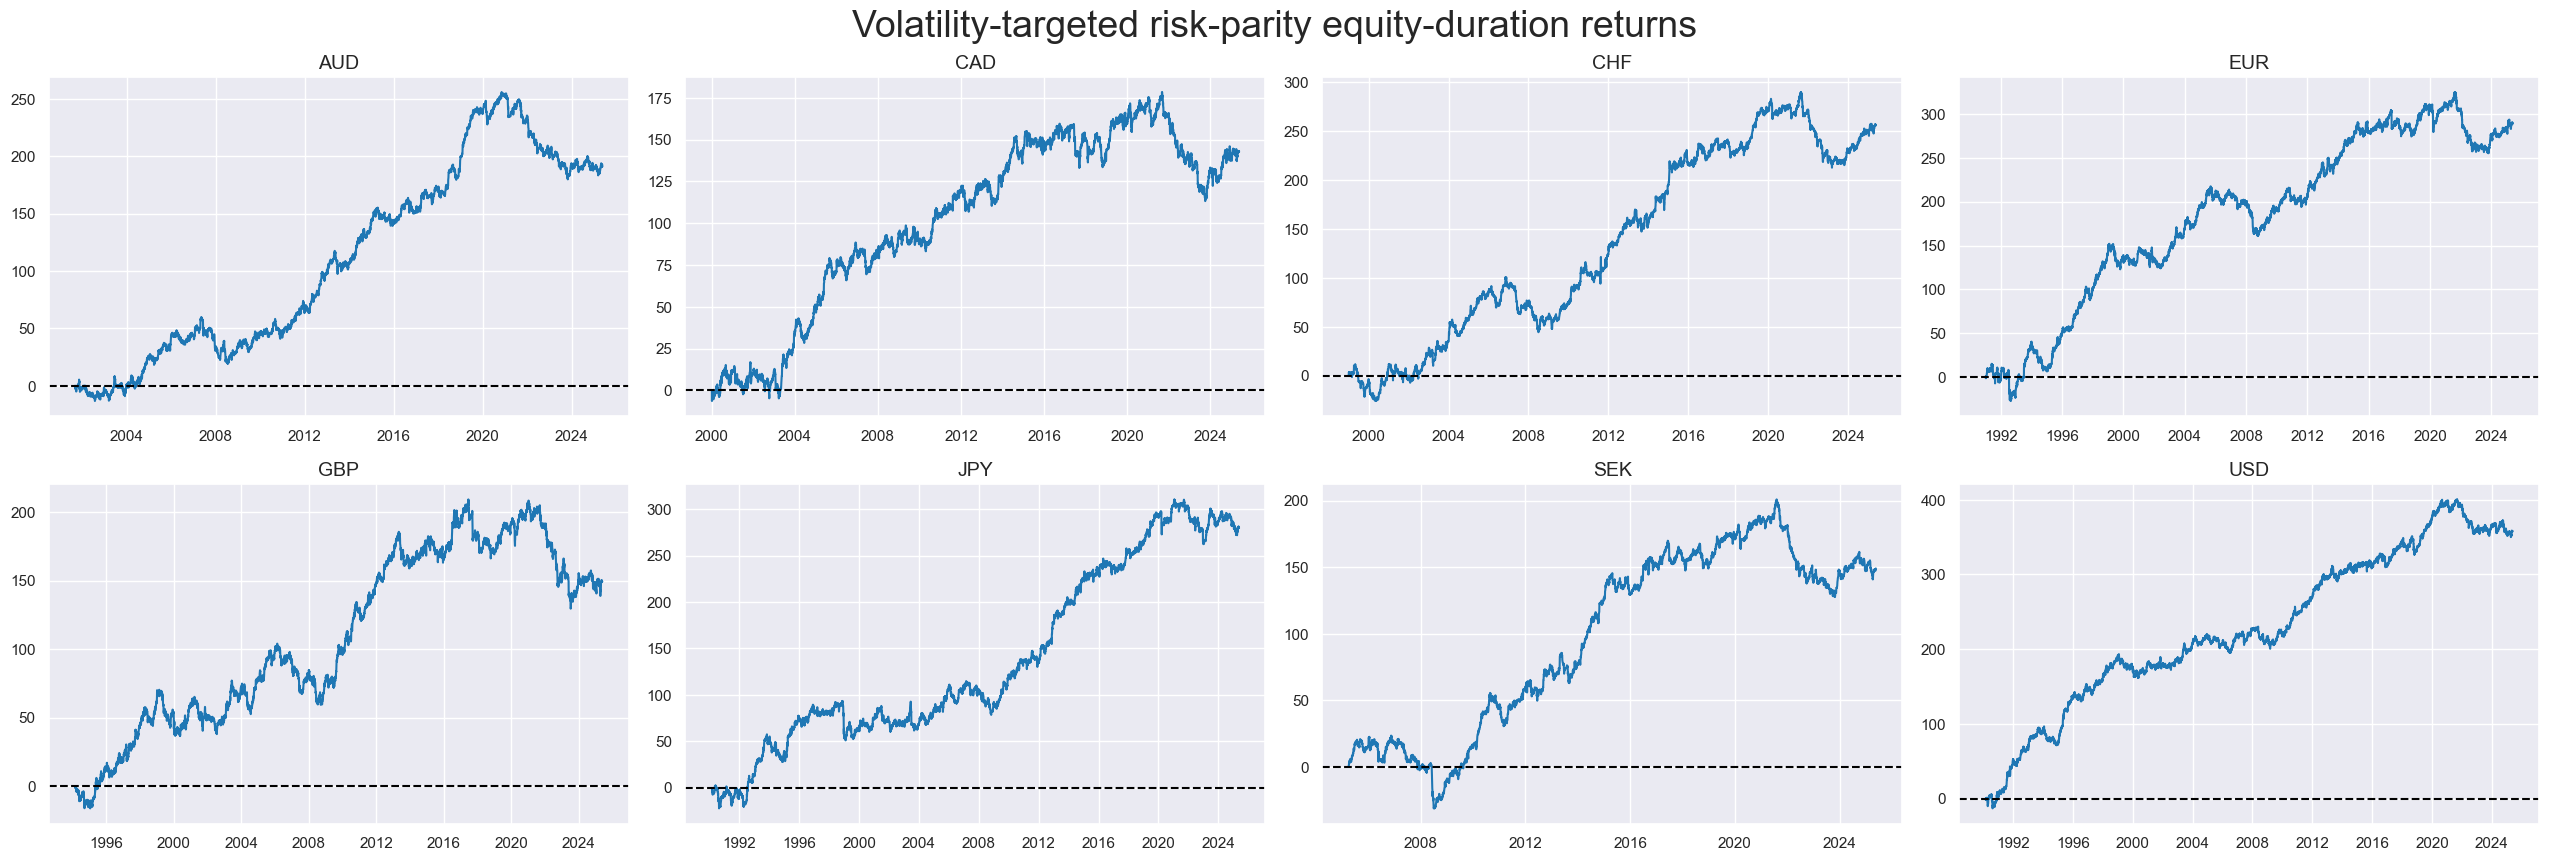
We predicate the analysis of equity-duration risk-parity strategies on volatility-targeted positions in local-currency equity index futures and 5-year interest rate swap fixed receiver positions in eight developed market currency areas: Australia (AUD), Canada (CAD), Switzerland (CHF), the euro area (EUR), the UK (GBP), Japan (JPY), Sweden (SEK), and the U.S. (USD). Euro area data here concatenate actual euro area futures and swap returns and, prior to 1999, German (DEM) return data.
Generic return series have all been taken from JPMaQS. The equity legs are positions in the main equity index future, recalibrated at the beginning of each month to observe an annualised volatility target of 10% (documentation here). The duration legs are 5-year fixed-receiver positions in the local-currency interest rate swap market, again recalibrated at the beginning of each quarter to pursue an annualised volatility target of 10% of the allocated risk capital (documentation here). Then, the composite risk-parity position is again targeted at a volatility of 10%. In all cases, positions are scaled based on the historic standard deviation for an exponential moving average with a half-time of 11 days.
Risk-parity returns are available for the G3 (euro area/Germany, Japan, and the U.S.) back to 1990, for the UK back to 1994, and for the other countries from 1998 to 2005. A passive volatility-targeted long-long exposure would have produced between 5 and 10% annualised returns over the past decades, with upward drifts most of the time.
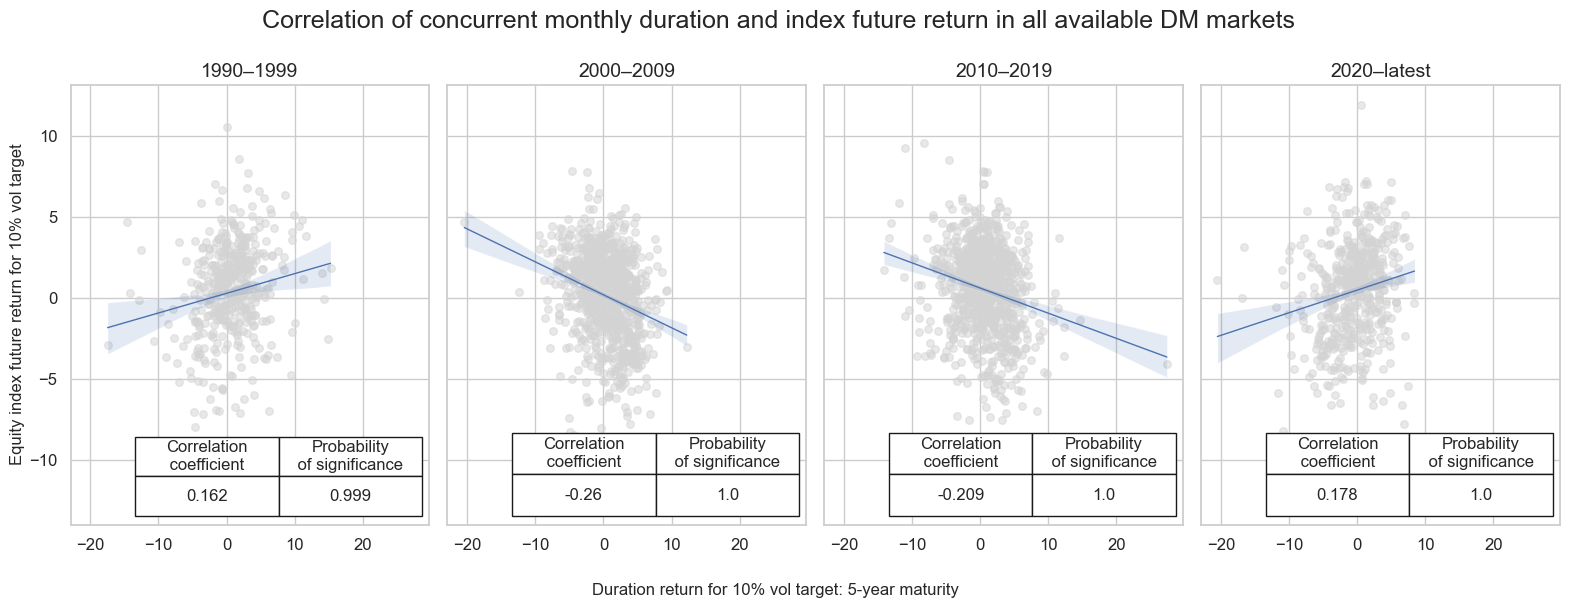
Equity-duration correlation regimes have changed over the past decades. In the 1990s, when inflation expectations were still high and unstable, the predominant monthly correlation of the two types of returns, pooled over all countries, was positive. In the 2000s and 2010s, the cross-asset correlation then flipped to negative. And the correlation turned positive in the 2020s until May 2025. An interesting point is that negative correlation has not generally been a requirement of strong risk-adjusted returns in a volatility-targeted portfolio.
The benefits of awareness of macroeconomic conditions
While a calibrated risk parity long position across equity and fixed income should pay premia over time, the risk of large monetary tightening shocks in the future is real. The danger of rising real interest rates largely depends on macroeconomic developments, and, fortunately, those can be tracked and used as positioning signals.
In inflation targeting regimes, the risk of autonomous increases in real rates is highest when inflation is excessive and the economy shows signs of overheating. Analogously, the chance of autonomous monetary easing is greater when inflation and inflation expectations have fallen below target and the economy is underperforming. This reflects central banks’ risk management. Both runaway inflation and deflation are hard to contain and revert once they have become entrenched, with high economic and political costs. For this reason, central banks prefer to “err” on the cautious side, i.e., tighten aggressively against high inflation and ease aggressively against deflation.
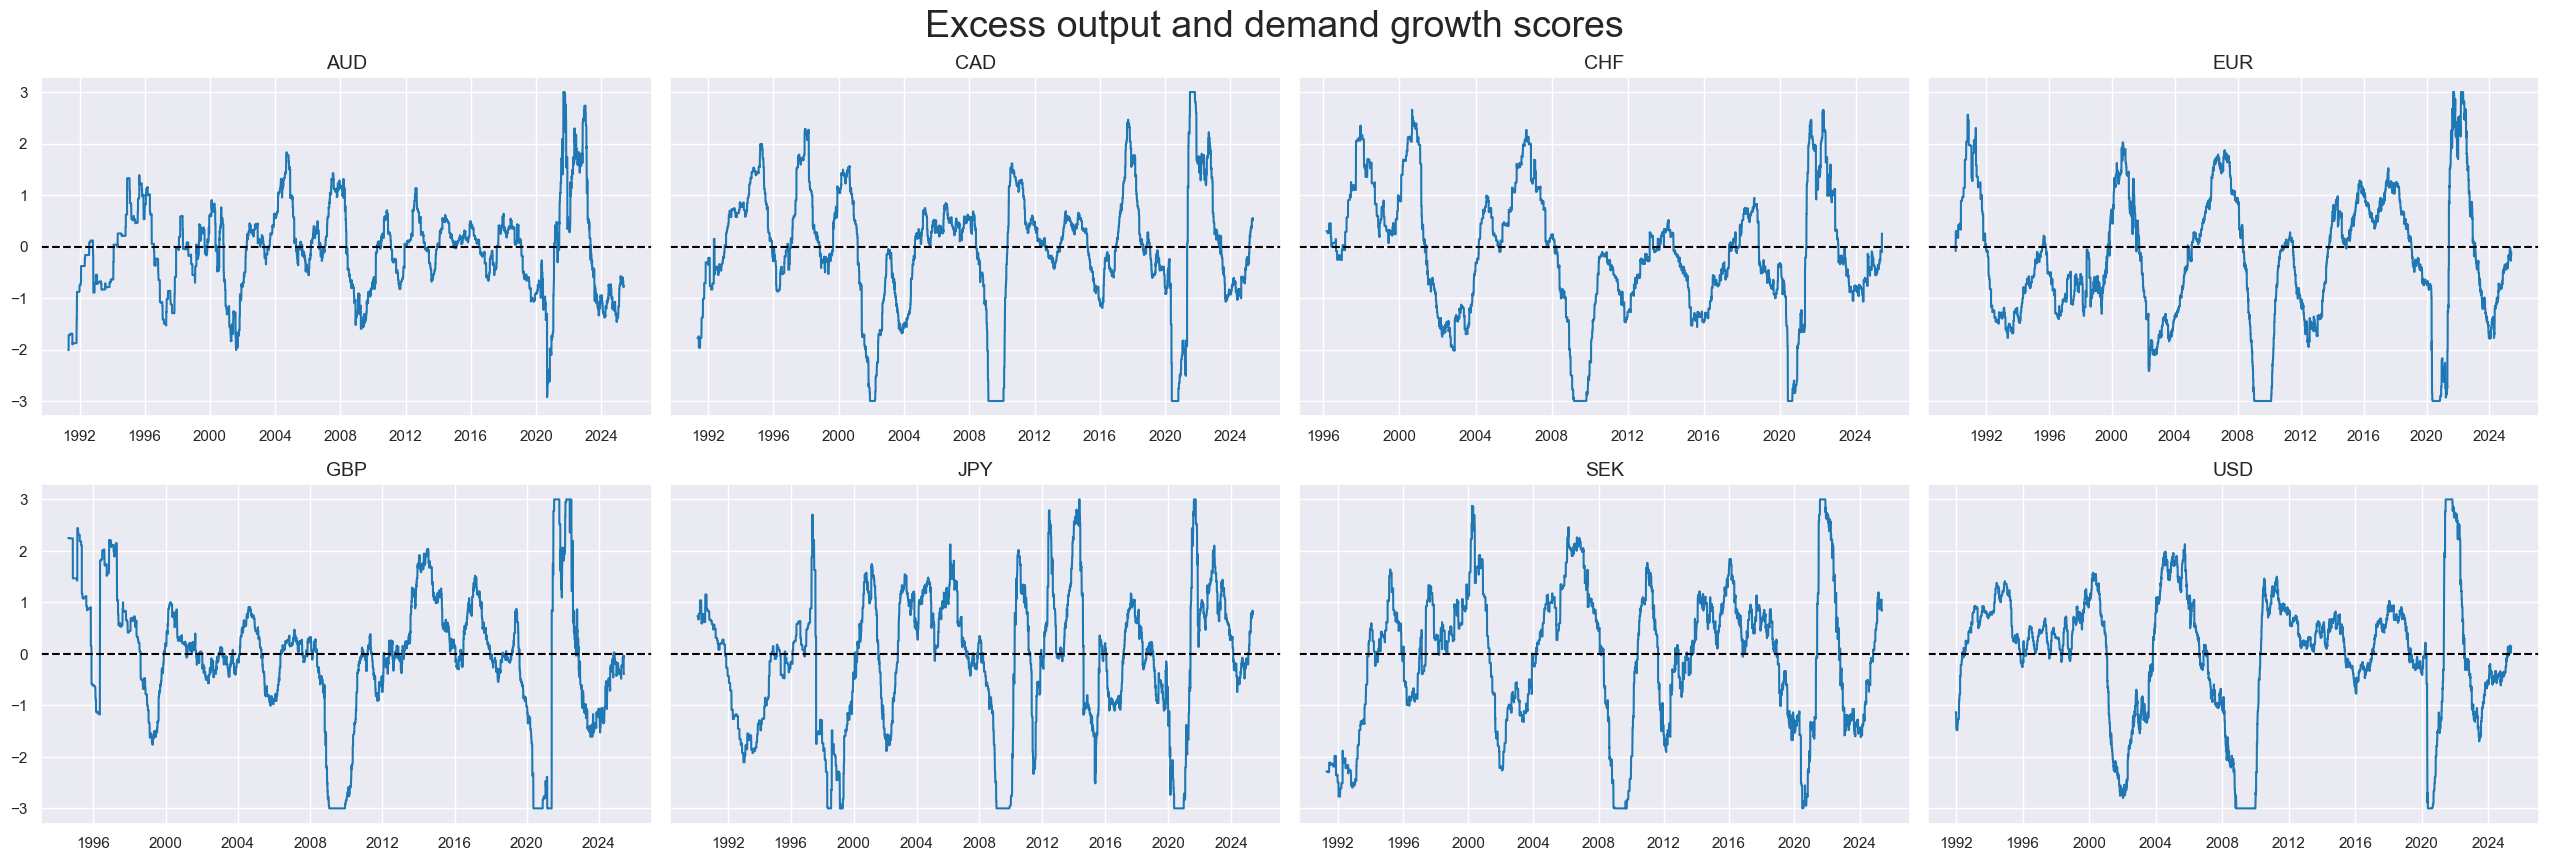
In a simple framework, we can track excess inflation and overheating risks with three conceptual quantamental factor scores that are built using point-in-time macroeconomic indicators of JPMaQS: an excess inflation growth, an excess output and demand growth score, and a survey-based overconfidence score.
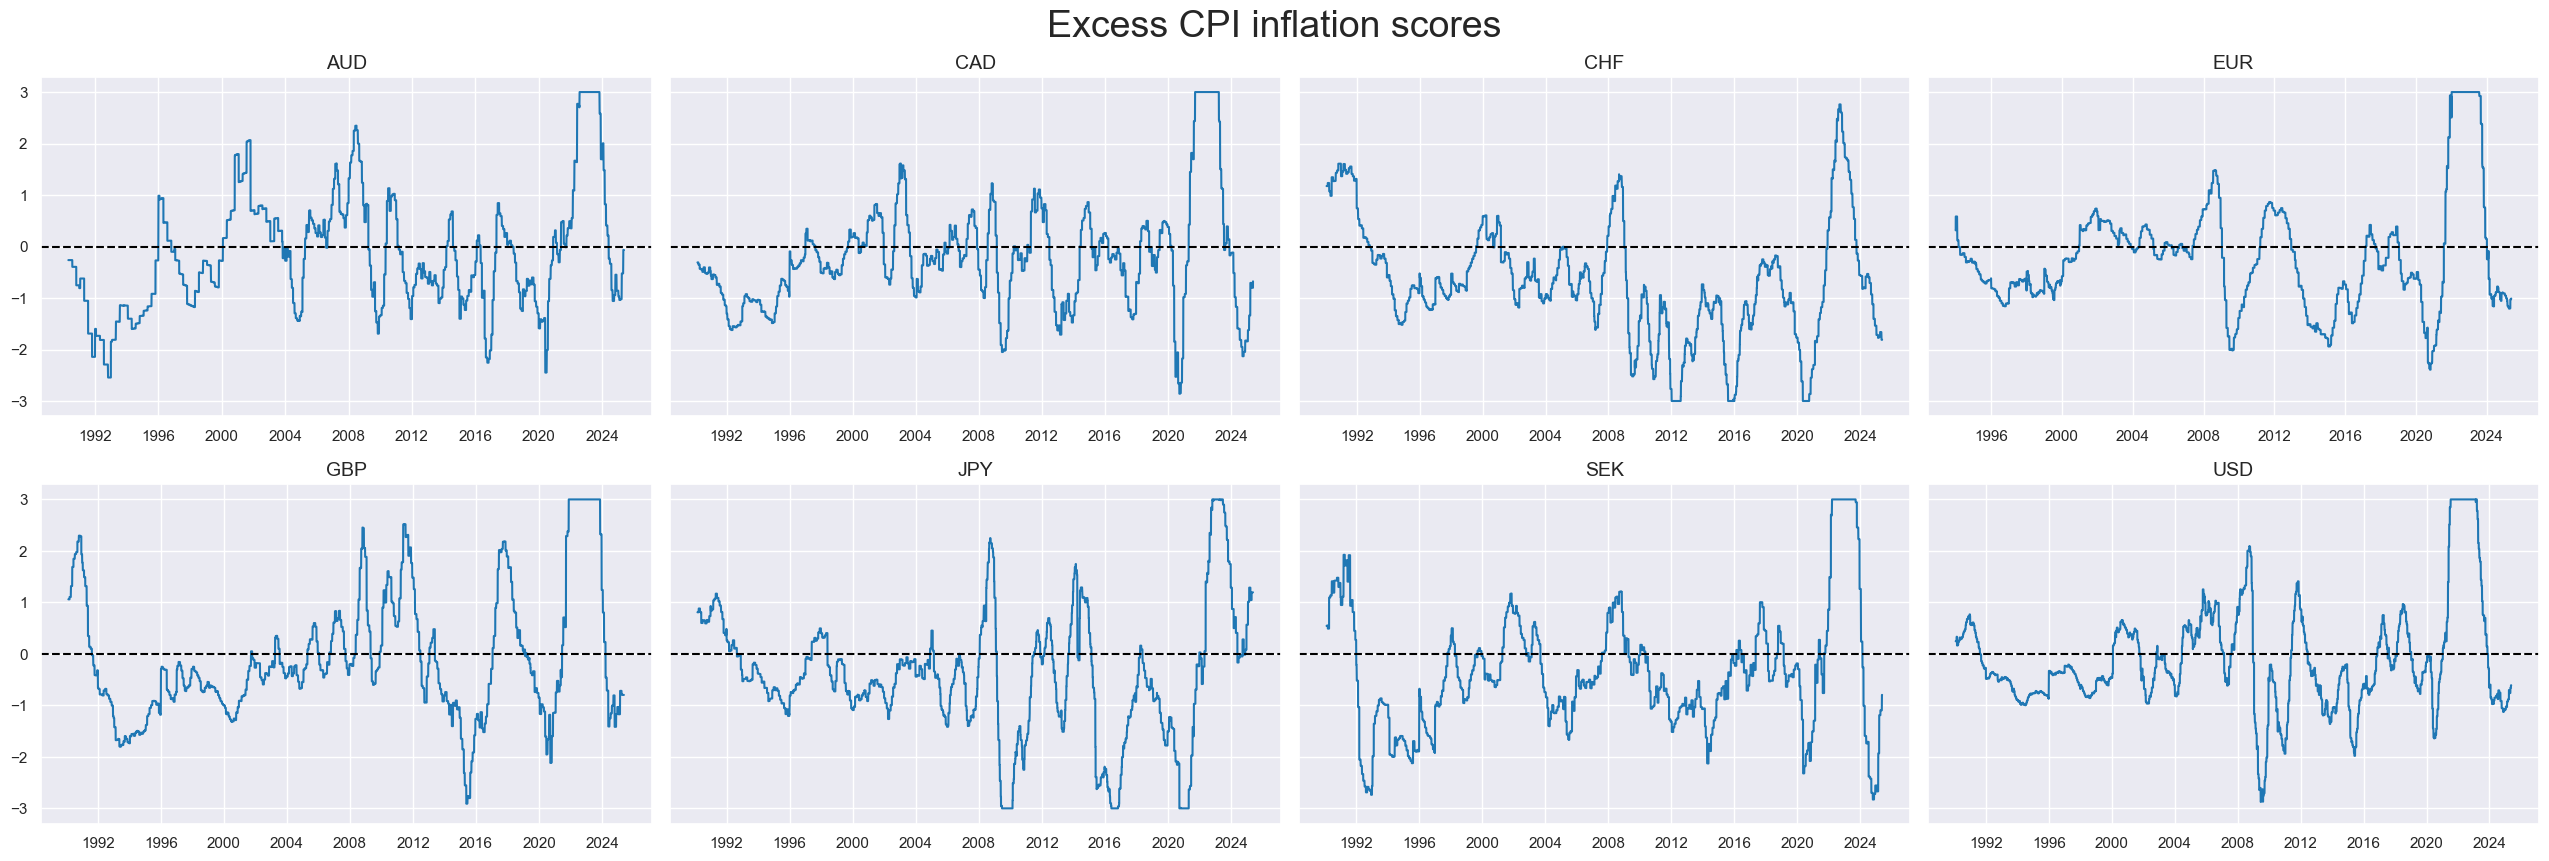
An excess CPI inflation score is calculated based on the difference between four headline and core inflation metrics and concurrent effective inflation targets (documentation here). For the 1990s, when most countries did not have official inflation targets, effective targets were approximated as 5-year moving averages of past CPI inflation rates. The point-in-time inflation metrics that indicate excesses or shortfalls are headline CPI, % over a year ago (documentation here) and 6 months over the previous 6 months, seasonally and jump-adjusted annualized rate (documentation here), core CPI according to local definition, % over a year ago (documentation here) and 6 months over the previous 6 months, seasonally and jump-adjusted annualized rate (documentation here). All four excess inflation rates are sequentially normalised, keeping information point-in-time, around their theoretical zero neutral value, based on panel standard deviation and subject to winsorization (i.e. capping and flooring) at three standard deviations on the positive and negative side. Then an equally-weighted average is formed and re-normalised.
An excess GDP and aggregated demand score is calculated based on the differences between six output and demand growth metrics and medium-term real or nominal GDP growth. The growth measures are two “nowcast” GDP growth measures, as well as four local consumer spending measures:
- “Intuitive” GDP nowcast, % over a year ago, 3-month moving average (documentation here).
- “Technical” GDP nowcast, % over a year ago, 3-month moving average (documentation here).
- Real private consumption, % over a year ago, 3-month moving average (documentation here).
- Real retail sales, % over a year ago, 3-month moving average (documentation here).
- Nominal retail sales, % over a year ago, 3-month moving average (documentation here).
- Nominal merchandise imports, % over a year ago, 3-month moving average (documentation here).
From all real growth rates, we subtract the 5-year median of past real GDP growth, and from all nominal growth rates, we subtract the same plus the effective inflation target. Then we score, average and re-score the categories in the same way as we did with excess inflation rates. The score weights the output and demand growth rates equally.
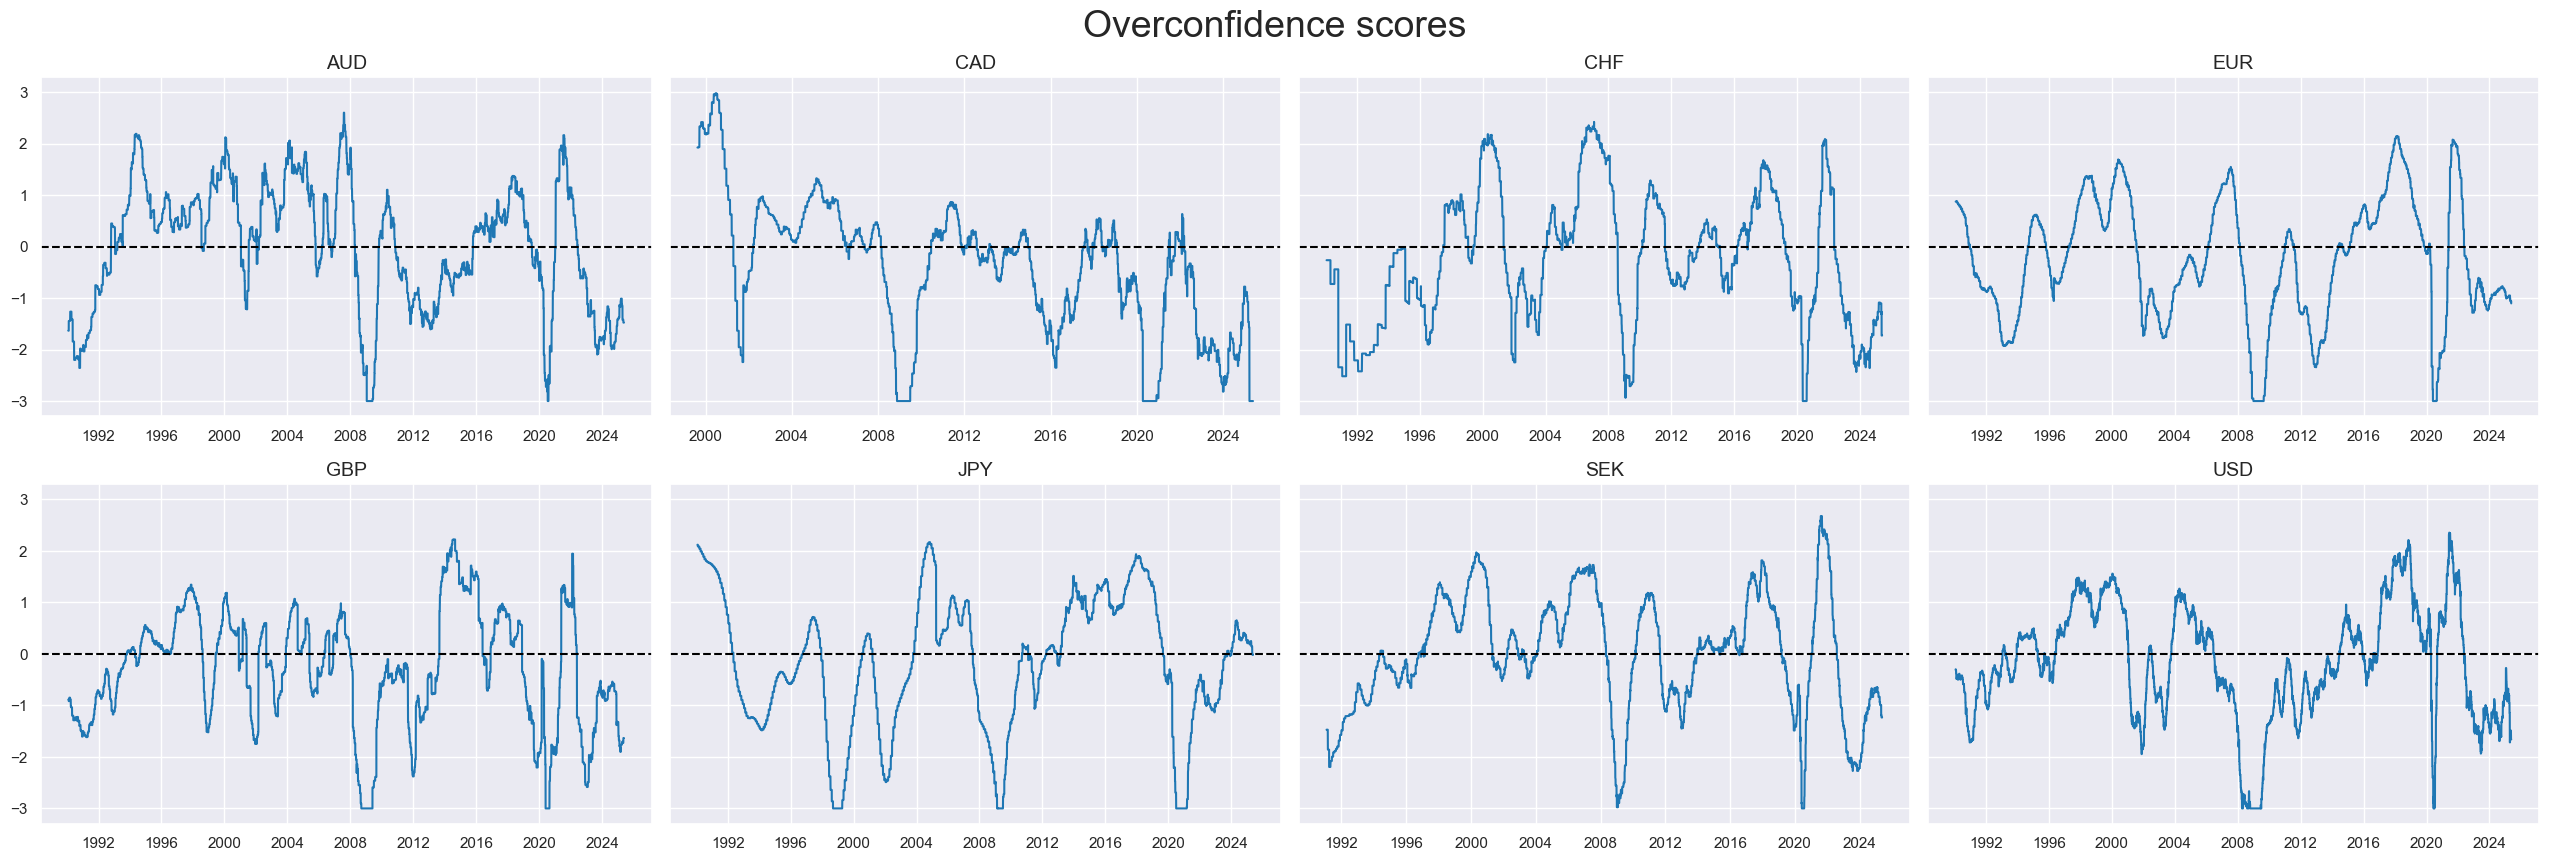
An overconfidence score is calculated based on four types of surveys covering the following areas: manufacturing, services, construction and households. Specifically, we use 3-month moving averages or quarterly values of the following categories:
- Manufacturing business confidence, seasonally adjusted z-score (documentation here).
- Services business confidence, seasonally adjusted z-score (documentation here).
- Construction business confidence, seasonally adjusted z-score (documentation here).
- Consumer confidence, seasonally adjusted z-score (documentation here).
The four types of survey metrics are combined and re-scored in the same way as excess inflation and economic growth, except that we give the construction survey only one-fifth of the weight of the other surveys, since the sector is much smaller than the others.
The three conceptual point-in-time “overheating scores” can be calculated back to 1992 for all countries. However, they are not always based on a complete subset of individual sub-scores, as one or more of the underlying indicators may not be available point-in-time for the whole period. In these cases, conceptual scores are calculated based only on the available indicators. This implies that, generally, the scope and quality of the overheating scores are not as high in the 1990s as in later decades.
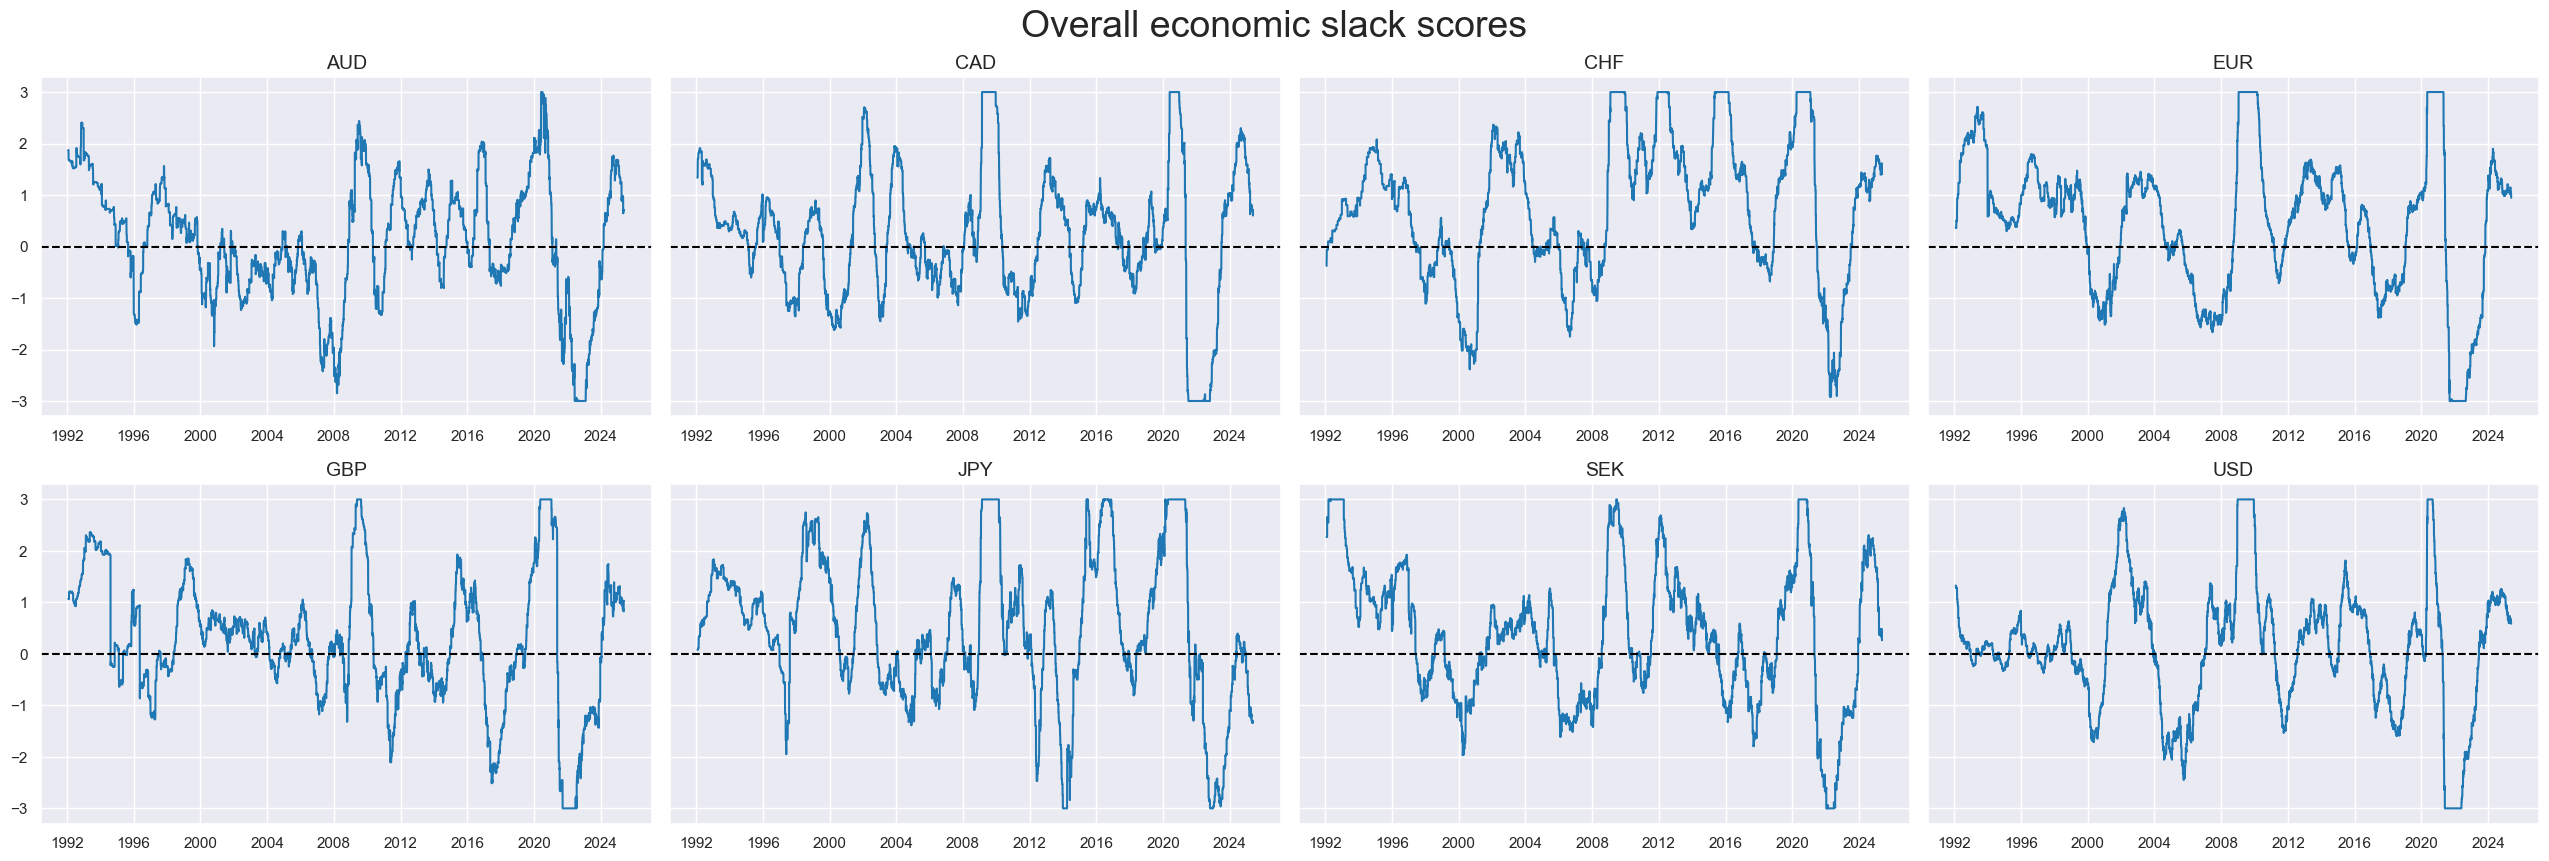
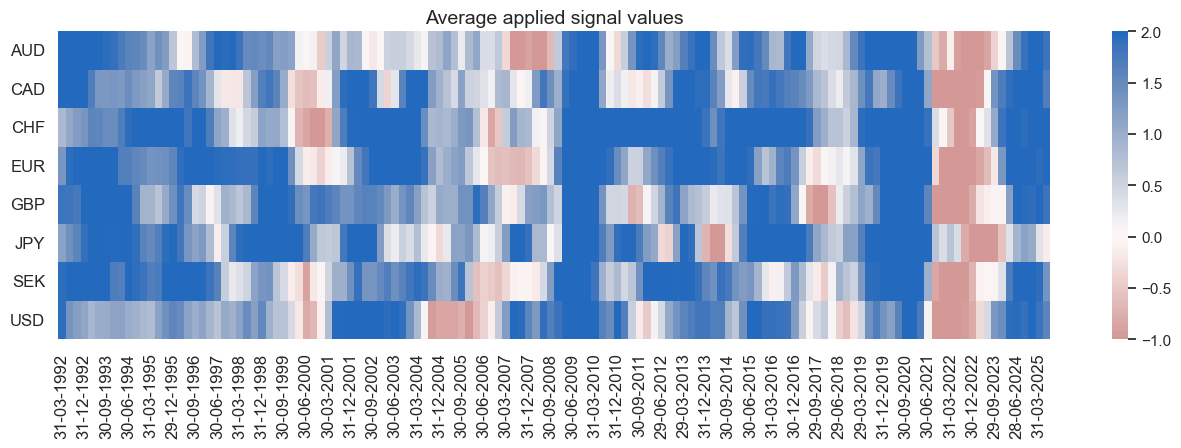
Finally, we calculate a composite economic slack score as the weighted average of the negative values of the three overheating scores, whereby we give the inflation and real economy indicators equal weights. Within the latter we give 80% of the weight to the actual output and demand scores, since they are what is called “hard evidence” on the performance of the economy. The concept and term “slack” have been chosen, rather than its inverse “overheating”, so that the expected effect on equity-duration risk parity position returns is positive. For all countries, the composite slack scores are stationary with pronounced cyclical swings and little short-term volatility.
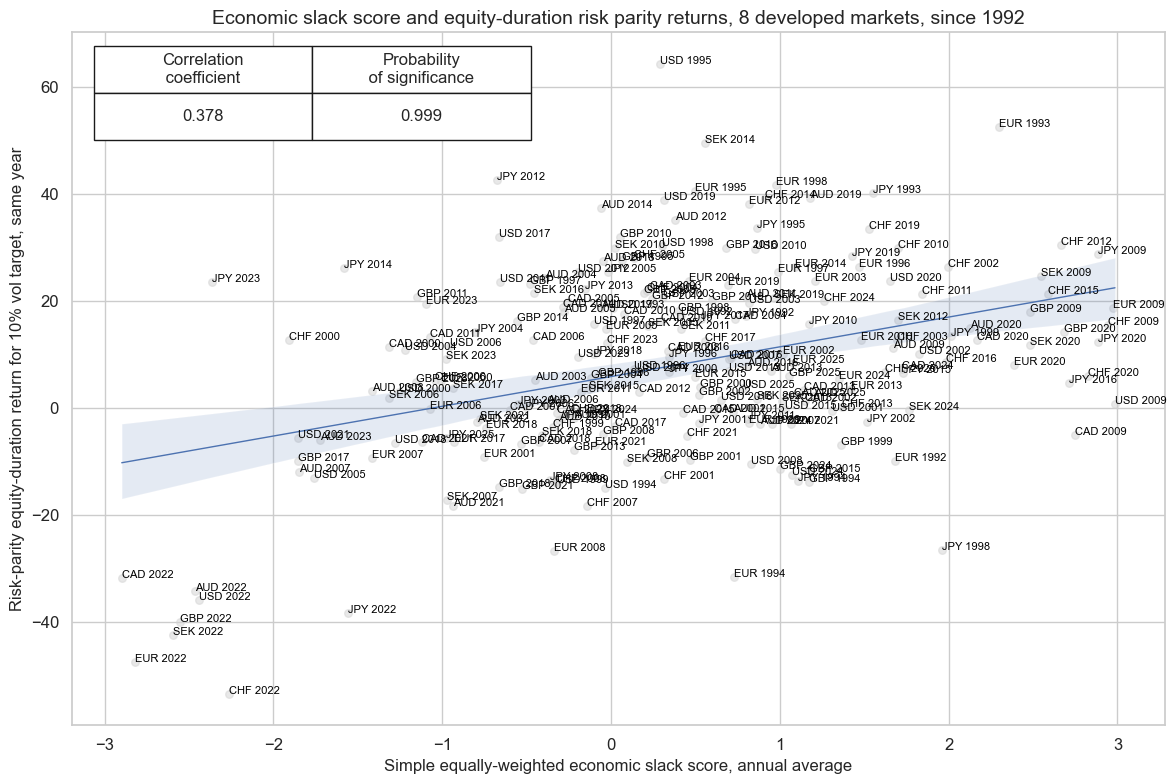
A quick glance at the historical relation between macroeconomic slack and equity-duration risk parity returns shows a very clear positive concurrent relation from 1992 to 2025 (January-April) for the full set of 8 developed countries. The correlation coefficient for the data was 34% at an annual frequency. The relation has been highly significant according to the Macrosynergy panel test, even when considering the correlation across countries.
Evidence of predictive power and economic value of macro scores
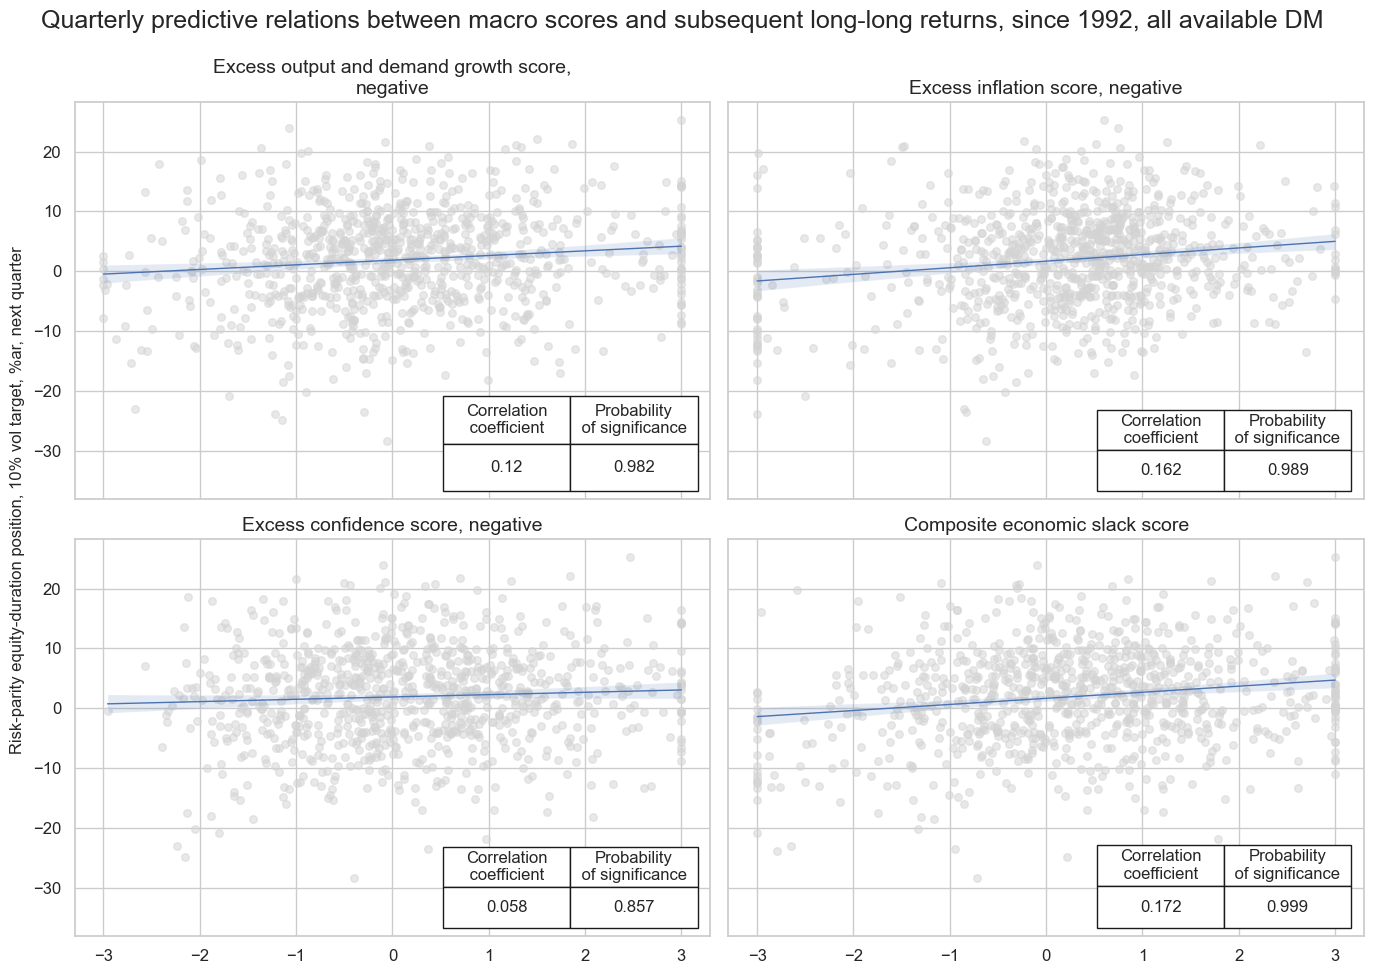
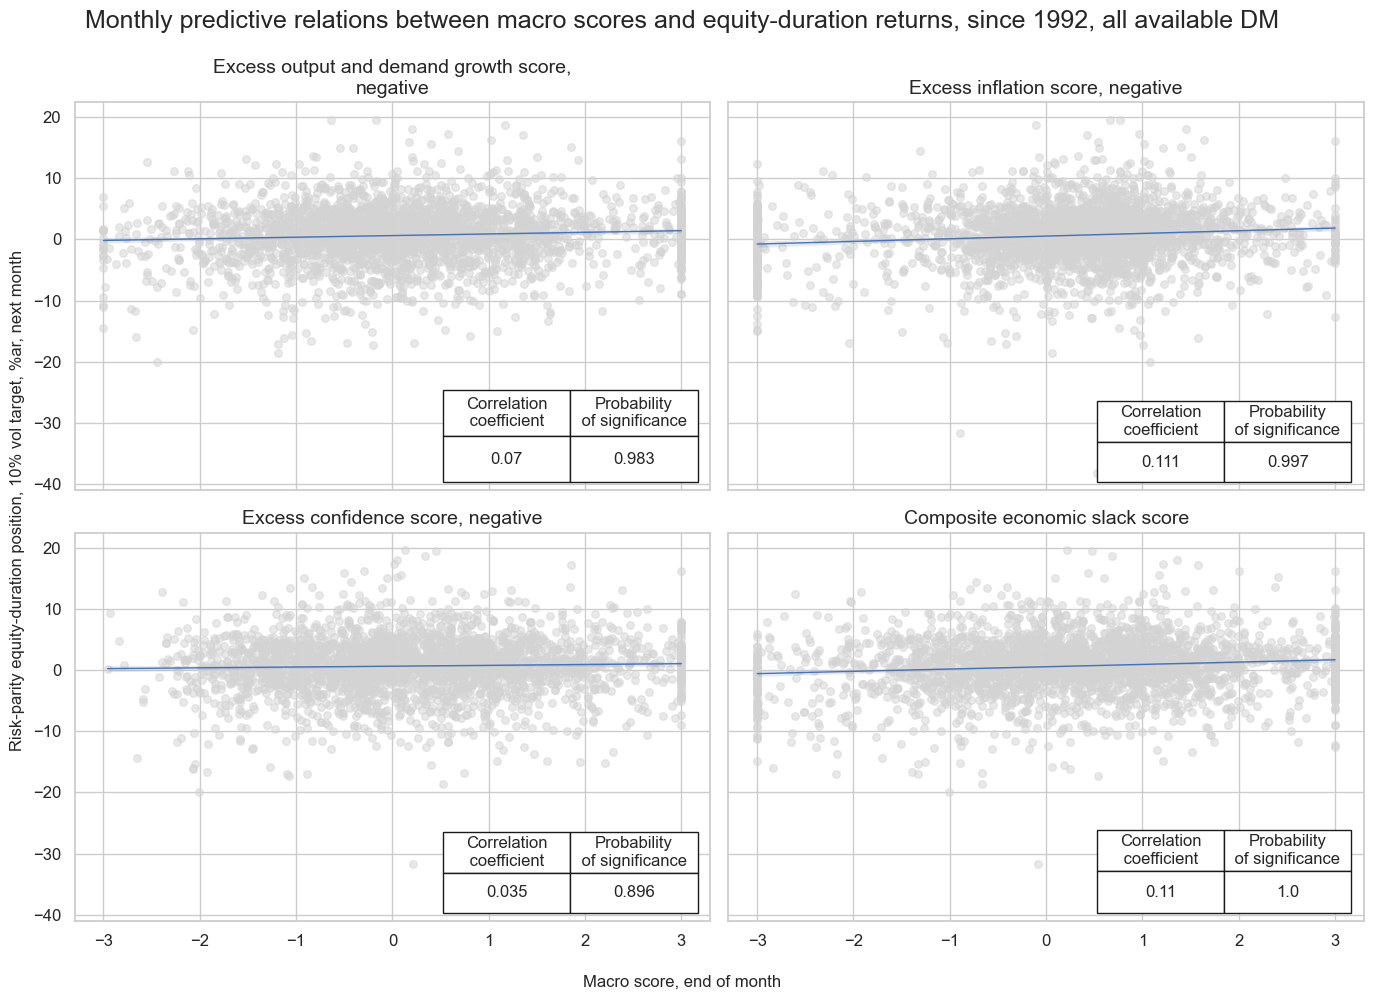
We test whether information states of economic slack scores have predicted volatility-targeted equity-duration risk-parity returns positively and significantly across the eight developed markets and over the past 3 ½ decades. In particular, we look at the linear relationship between end-of-quarter or end-of-month information states and the next quarterly or monthly return. We assess significance by means of the Macrosynergy panel test, which means that both intertemporal variations and cross-country variations of predictors and returns are considered.
Inflation, economic growth and confidence shortfalls all have positively predicted subsequent returns at a quarterly and monthly frequency, albeit only inflation and growth were highly significant. The composite economic slack score posted the highest forward correlation, and its probability of being a significant positive predictor is 99.9%.
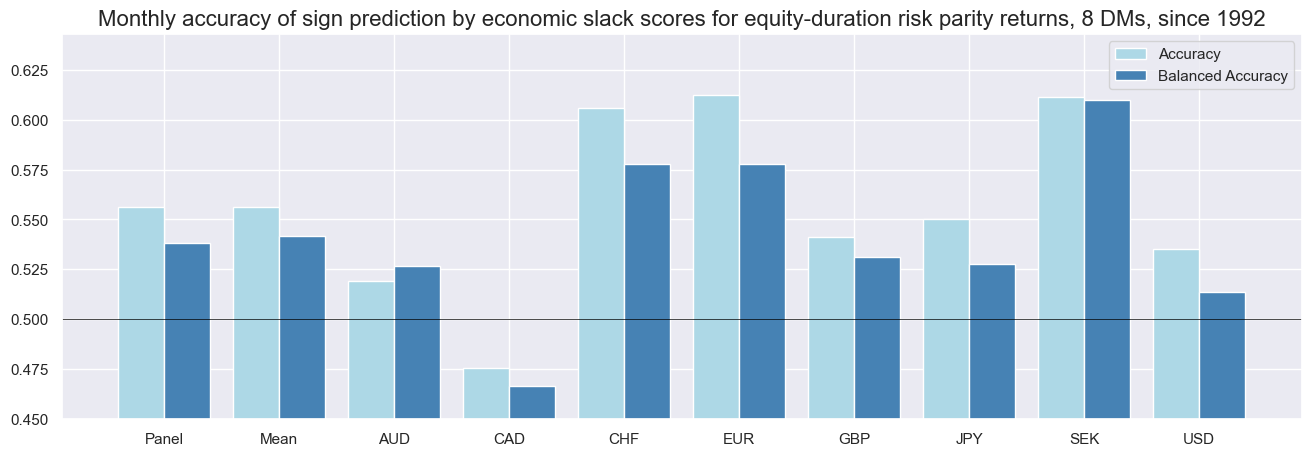
The monthly accuracy of the economic slack score, i.e., the ratio of correctly predicted directions of equity-duration returns for the next month, has been 55.6% for the full data panel since 1992. This partly reflected the joint long bias of signals (59%) and returns (61%). However, even balanced accuracy, the average ratio of correctly predicted positive and negative returns for the next month, was 53.8%. Both standard and balanced accuracy have been above 50% for all countries except for Canada.
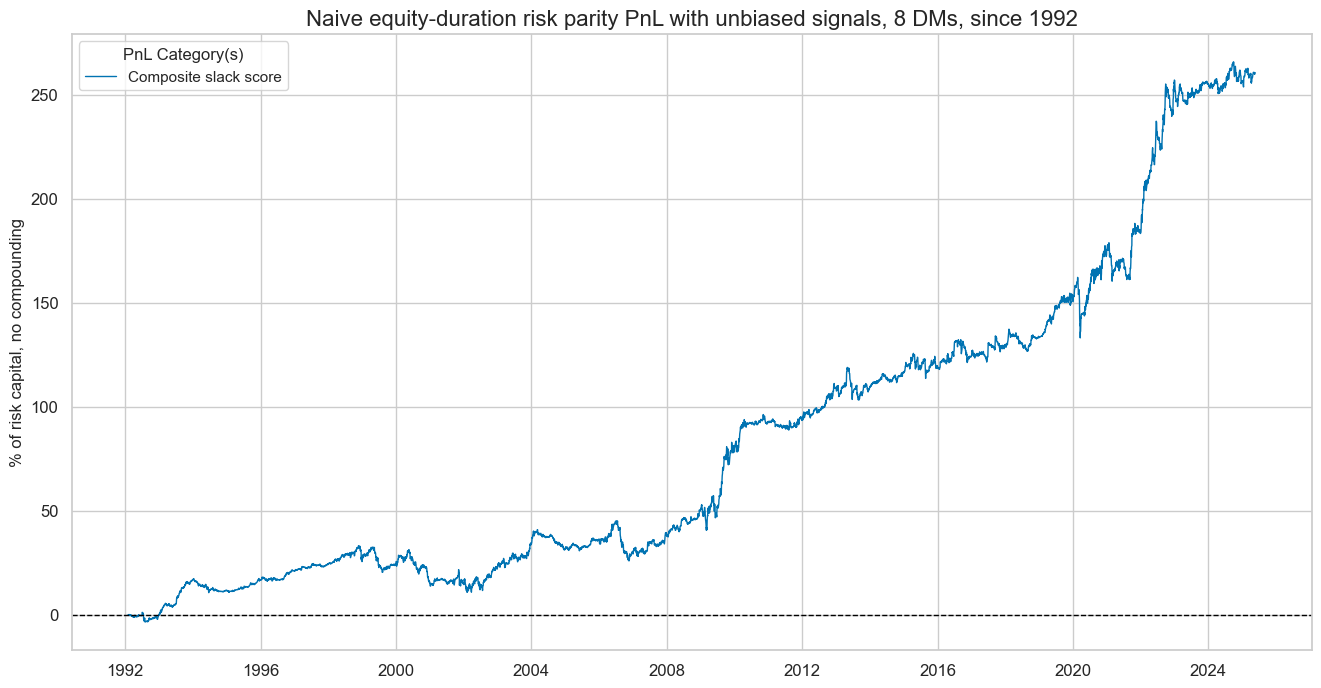
We can estimate the economic value of economic slack signals for risk-parity positions by means of naïve PnL analysis, following standard rules of Macrosynergy posts. In particular, we generate signals based on month-end values of economic slack scores (winsorized at two standard deviations) and take volatility-targeted risk-parity positions in accordance with the signal for the next month, under consideration of a 1-day slippage for position rebalancing. Leverage has been set such that each of the eight countries’ positions has 1/8 of 10% expected volatility. In the 1990s, when only a subset of countries produced signals, overall positions were smaller, which shows in lower returns for that period.
Trading a balanced signal, without a natural long or short bias, would have produced material risk-adjusted returns of almost 8% annualised over the past 32 years, with very low correlation to either the S&P500 returns (9%) or the U.S. swap market (4%). Sharpe and Sortino ratios would have been 0.8 and 1.2, respectively.
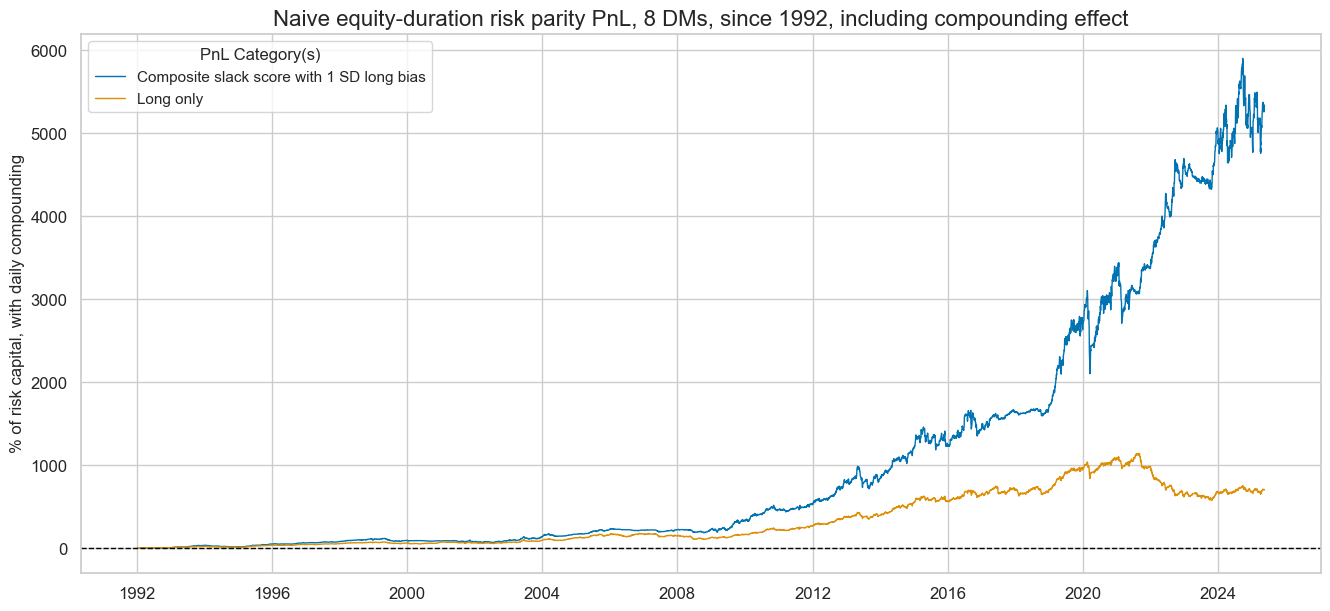
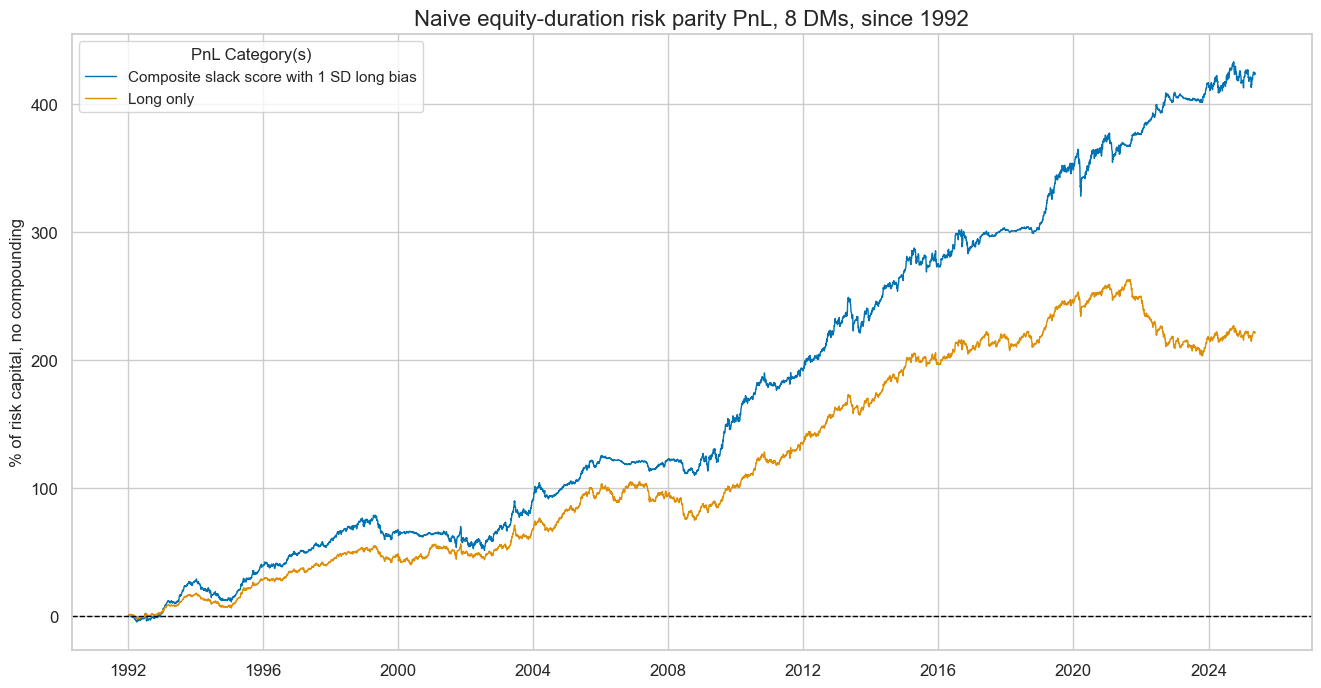
However, given that the equity-duration long-long position normally pays positive risk premia, it is usually traded with some long bias. To assess such an approach, we add one standard deviation to the signal scores, which means we have signal values between -1 and 2 (due to winsorization). We compared this macro-aware long-biased strategy with a simple long-only strategy, which holds the signal stable at 1, so each tradable country takes an equal and constant vol-targeted risk-parity position across time.
Both the macro-aware long-biased strategy and the constant long-only strategy have been profitable over the long term, but the former much more so. The long-term average annualised return of the macro-aware strategy has been 12.7% versus 6.6% for the long-only. Part of that outperformance owed to greater risk taking, as over the past 30 years, macro aware signals have often been larger than 1, reflecting low inflation or even deflation risk. However, even volatility-adjusted returns were materially higher for the macro-aware book, with Sharpe and Sortino ratios of 1.1 and 1.5 versus 0.7 and 1.0 for the long-only portfolio. Moreover, the correlation between the macro-aware book and U.S. equity and fixed income markets (29% and 24%) was lower than that of the long-only book (37% and 34%).
All the above PnL analyses assume constant risk-taking. However, the benefit of the outperformance of the macro-aware risk parity strategy is much larger if we consider compounding and wealth effects. The chart below illustrates what would have happened if both strategies had applied daily compounding, i.e., the addition of past profits to risk capital. In this case, the consistent outperformance of the macro-aware approach would have driven an exponentially growing wedge between the two strategies. After more than 33 years, this left the macro-aware portfolio with almost 10 times the value generation of the constant long-only portfolio.