October 2, 2021
Stock markets cater to both the financial and emotional needs of investors. In particular, integral emotions, which are caused by decisions themselves, are useful personal experiences. However, they compromise conventional valuation criteria and can lead to market inefficiency. A new paper estimates the emotional ‘glitter’ of stocks as an ’emotion beta’, i.e. the statistical sensitivity of returns to a market-level emotion index. The index is based on the difference between excitement and anxiety word counts in newspaper articles. Emotion betas significantly and positively predict subsequent return differentials across stocks. Tracking emotional attraction seems to make investor behavior partly foreseeable. High-emotion portfolios have historically outperformed low-emotion portfolios significantly.
Bin Hasan Shehub, Alok Kumar and Richard Taffler (2021), “Anxiety, Excitement, and Asset Prices”
The below quotes are from the paper. Headings, cursive text, and text in brackets has been added.
This post ties in with this site’s summary on implicit subsidies, particularly the section on equity.
The importance of emotions in investment decisions
“Stock market participation meets both emotional and financial needs of investors. Investors are likely to enter into emotional relationships with stocks…The role of emotions in decision-making is a dominant theme in the psychology literature. Financial economists have… recognized the importance of incidental emotions such as weather, sentiment, and mood in investment decisions and financial market outcomes…In contrast, the potential impact of integral or fundamental emotions (e.g., excitement, anxiety, fear, panic, anger, guilt, etc.) on financial decisions and aggregate market outcomes has received relatively less attention…Integral emotions…are fundamental and often unconscious, and at sufficient levels of intensity can strongly affect cognitive processing.”
“As opposed to incidental emotions, integral emotions are emotions that are caused by the decision itself. They arrive, for example, when you think about the parameters of the decision or its implications. And these emotions can actually be pretty useful. If thinking through a decision causes you some anxiety, that is useful information: it might be a sign that you need to be very cautious, and that you should potentially be more risk-averse rather than risk-seeking with the decision.” [Cote]
“The effects of integral emotions are difficult to avoid and they are influential even in the presence of cognitive information. The intensity of such fundamental emotions progressively takes over and overrides rational courses of action. Consequently, investors are likely to make sub-optimal decisions”
“The intensity of investor-firm emotional relation adds to the conventional asset valuation criteria. In particular, investors’ expectations of future gain, both as individuals and as a group, create excitement, but with the associated anxiety of future loss. We demonstrate that such an uncertainty-driven emotional process is an important driver of asset prices.”
How to measure emotion beta
“We introduce the concept of emotional utility and posit that investors enter into emotionally-charged relationships with the stocks they invest in. Investors are likely to experience different emotions such as excitement and anxiety and enter into ambivalent object relationships with stocks of a ‘love’ and ‘hate’ nature affecting their investment preferences…Investors create a set of attractive stocks that grab their attention before making the final investment decision. In the same way, we conjecture that investors are attracted to stocks that have emotional ‘glitter’, i.e., high emotional utility. Once such an emotional bond exists, investors are likely to derive emotional utility from their investments.”
“We measure the time-varying emotional utility of stocks for investors in terms of the feelings of excitement and anxiety that they generate. We estimate each stock’s emotional utility to investors, and examine whether this firm-level measure of sensitivity to changes in market-level emotional state (i.e., emotion beta) can explain cross-sectional patterns in stock returns.”
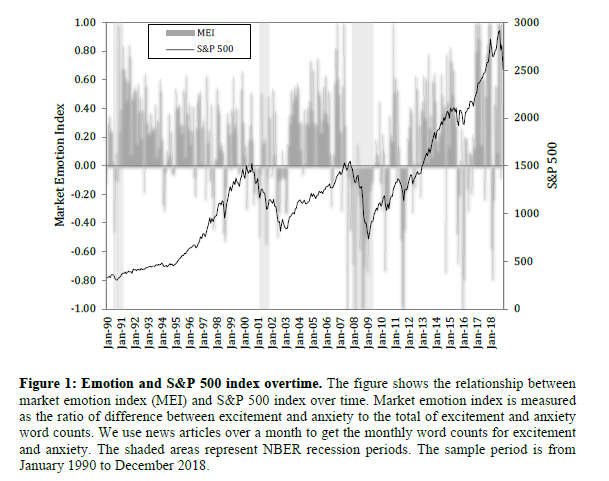
“To measure an individual stock’s emotional utility to investors, we first construct a market-level emotion index. We construct this index using a standard bag-of-words technique with keyword dictionaries made up of 134 excitement-related words and 161 anxiety-related words. For each month during the January 1990 to December 2018 sample period, we use the ratio of difference between excitement and anxiety word counts in newspaper articles to the total number of excitement and anxiety words to derive the market emotion index…Media coverage keeps individual stocks and the market alive in investors’ minds, and in the spotlight of public discussion…This index is designed to capture the emotional engagement of investors with the overall stock market.”
“To capture the cross-sectional variation in emotional utility across individual firms, we estimate individual firm-level stock emotion betas using 60-month rolling regressions of excess stock returns on the market emotion index. These betas are our proxy for the emotional connections between investors and firms. In particular, the returns of a firm with high emotion beta exhibits greater sensitivity to the variation in the emotional state of the overall market.”
“We transform the monthly emotion betas into conditional emotion-sensitive betas by taking their absolute values. We focus on the magnitude of the conditional emotion beta for several reasons. First, emotional intensity represents ‘arousal’ in the circumplex model of affect increases with absolute value of valence. Arousal represents the power of the emotions individuals experience that we expect to impact investor decision making in a predictable manner. Second, strength of investor emotion is more salient than its valency. At sufficient levels of intensity emotion overwhelms cognitive processing and directs behavior in directions different from those predicted by rational decision-making.”
“Specifically, we posit that investors are more attracted to stocks with high emotion beta, which in turn could affect its pricing. The more powerful the investor ‘arousal’, the greater the propensity to invest and higher are the prices in the near future. Conversely, the weaker a firm’s emotional utility to investors, the lower would be the appeal of the stock to investors, and lower would be the stock price in the short-term.”
How emotion beta is related to subsequent returns
“Our main objective is to quantify the emotional attraction individual stocks have for investors and how this can be used to predict the cross-section of stock returns.”
“To examine the relation between stock emotion betas and cross-sectional patterns in stock returns, we first sort stocks into quintile portfolios based on previous month emotion beta, and measure the monthly returns of the resulting portfolios. We find that the high emotion beta portfolio outperforms the low emotion beta portfolio. During the January 1995 – December 2018 sample period, the high-minus-low portfolio earns an abnormal return of 0.41% per month (t-statistic = 5.23) on a risk-adjusted basis. Similarly, the characteristic-adjusted average excess return is 0.54% per month (t-statistic = 3.80).”
“The economic significance of the alpha estimates persists for up to four months and then becomes insignificant. This evidence indicates that the alpha estimates of emotion beta portfolios capture mispricing of stocks with high emotional sensitivity, which eventually gets corrected over the next few months.”
“In additional tests, we estimate monthly Fama and MacBeth regressions and find that emotion beta is economically significant. It has a coefficient estimate of 0.55 with tstatistic of 4.06. In economic terms, this estimate implies that a one standard deviation shift in conditional emotion beta is associated with a 0.55 × 2.43 = 1.34% shift in stock return in the following month. Consistent with the factor model estimate, we find that the predictive ability of emotion beta remains strong for up to several months ahead.”
“We investigate whether our integral emotion beta predictability is distinct from the known predictive ability of incidental emotions such as seasonal mood, valence such as sentiment, positivity/negativity-based textual tone and [the] economic policy uncertainty index…Evidence indicates that the emotion beta effect is distinct from the other related determinants of future stock returns.”