Cross-country sectoral equity strategy #
This notebook offers the necessary code to replicate the research findings discussed in the corresponding Macrosynergy research post. Its primary objective is to inspire readers to explore and conduct additional investigations whilst also providing a foundation for testing their own unique ideas.
The notebook leverages nine sets of macro quantamental indicators to construct a relative signal for each of the 11 GICS sectors across 12 developed market equity markets. We use a benchmark signal in the form of conceptual risk parity score to show that a relatively simple yet robust statistical learning produces added value in this setting, when a set of economically plausible features is selected. Moreover, we show that a combination of the positions across sectors has superior performance vs the same strategy applied at country-index level.
The notebook covers the three main parts:
-
Get Packages and JPMaQS Data: This section is responsible for installing and importing the necessary Python packages used throughout the analysis.
-
Transformations and checks: This section computes the approproate quantamental information, builds the combined sector aggregates, applies imputation across countries, and construct relative country scores.
-
Value checks: This section builds statistical learning and conceptual parity signals across all sectors, and analyses the quality of the predictions as well as the PnL.
It is important to note that while the notebook covers a selection of indicators and strategies used for the post’s main findings, users can explore countless other possible indicators and approaches. Users can modify the code to test different hypotheses and strategies based on their research and ideas. Best of luck with your research!
Get packages and JPMaQS data #
This notebook primarily relies on the standard packages available in the Python data science stack. However, there is an additional package
macrosynergy
that is required for two purposes:
-
Downloading JPMaQS data: The
macrosynergypackage facilitates the retrieval of JPMaQS data, which is used in the notebook. -
For the analysis of quantamental data and value propositions: The
macrosynergypackage provides functionality for performing quick analyses of quantamental data and exploring value propositions.
For detailed information and a comprehensive understanding of the
macrosynergy
package and its functionalities, please refer to the
“Introduction to Macrosynergy package”
notebook on the Macrosynergy Quantamental Academy or visit the following link on
Kaggle
.
import copy
import warnings
import os
from tqdm import tqdm
import gc

import numpy as np
import pandas as pd
from pandas import Timestamp
import matplotlib.pyplot as plt
import seaborn as sns

from sklearn.linear_model import LinearRegression, Ridge
from sklearn.ensemble import RandomForestRegressor
from sklearn.pipeline import Pipeline
from sklearn.metrics import make_scorer, mean_squared_error

import macrosynergy.management as msm
import macrosynergy.panel as msp
import macrosynergy.signal as mss
import macrosynergy.pnl as msn
import macrosynergy.learning as msl
import macrosynergy.visuals as msv

from macrosynergy.panel.panel_imputer import MeanPanelImputer
from macrosynergy.download import JPMaQSDownload

warnings.simplefilter("ignore")
This notebook downloads selected indicators for the following cross-sections: AUD (Australian dollar), CAD (Canadian dollar), CHF (Swiss franc), EUR (euro), GBP (British pound), HKD (Hong Kong dollar), ILS (Israeli shekel), JPY (Japanese yen), NOK (Norwegian krone), NZD (New Zealand dollar), SEK (Swedish krona), SGD (Singapore dollar), USD (U.S. dollar) as well as five main European currencies [‘DEM’, ‘ESP’, ‘FRF’, ‘ITL’, ‘NLG’], replaced by EUR.
# Equity sectoral cross-section lists: excluding HKD
cids_dmeq = ['AUD', 'CAD', 'CHF', 'EUR', 'GBP', 'ILS', 'JPY', 'NOK', 'NZD', 'SEK', 'SGD', 'USD']
cids_eueq = ['DEM', 'ESP', 'FRF', 'ITL', 'NLG']

cids = sorted(cids_dmeq + cids_eueq)
cids_eqx = sorted(list(set(cids_dmeq) - {'HKD'}))
sector_labels = {
    "ALL": "All sectors",
    "COD": "Cons. discretionary",
    "COS": "Cons. staples",
    "CSR": "Communication services",
    "ENR": "Energy",
    "FIN": "Financials",
    "HLC": "Healthcare",
    "IND": "Industrials",
    "ITE": "Information tech",
    "MAT": "Materials",
    "REL": "Real estate",
    "UTL": "Utilities",
}
secx = list(sector_labels.keys())
secs = list(sector_labels.keys())[1:]
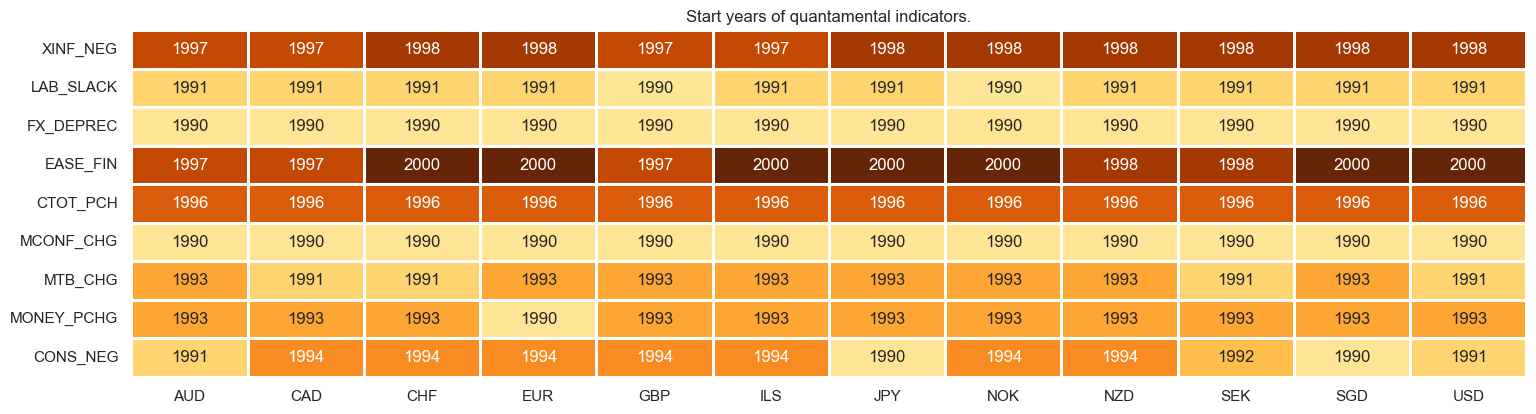
JPMaQS indicators are conveniently grouped into 6 main categories: Economic Trends, Macroeconomic balance sheets, Financial conditions, Shocks and risk measures, Stylized trading factors, and Generic returns. Each indicator has a separate page with notes, description, availability, statistical measures, and timelines for main currencies. The description of each JPMaQS category is available either under JPMorgan Markets (password protected) or the Macro Quantamental Academy .
In particular, the indicators used in this notebook can be found under consumer price inflation trends , labor market dynamics , demographic trends , real effective appreciation , terms of trade , manufacuring scores changes , external ratio trends , monetary aggregates , and private consumption trends .
# Category tickers

# Economic indicators

ecos_groups = {
    "XINF_NEG": [
        "CPIH_SA_P1M1ML12",
        "CPIH_SJA_P6M6ML6AR",
        "CPIC_SA_P1M1ML12",
        "CPIC_SJA_P6M6ML6AR",
        "INFTEFF_NSA",
    ],
    "LAB_SLACK": [
        "EMPL_NSA_P1M1ML12_3MMA",
        "EMPL_NSA_P1Q1QL4",
        "UNEMPLRATE_NSA_3MMA_D1M1ML12",
        "UNEMPLRATE_NSA_D1Q1QL4",
        "WFORCE_NSA_P1Y1YL1",
        "WFORCE_NSA_P1Q1QL4",
    ],
    "FX_DEPREC": [
        "REEROADJ_NSA_P1M1ML12",
        "NEEROADJ_NSA_P1M1ML12",
        "REER_NSA_P1M1ML12",
    ],
    "EASE_FIN": [
        "RIR_NSA",
    ],
    "CTOT_PCH": [
        "CTOT_NSA_P1M1ML12",
        "CTOT_NSA_P1M12ML1",
        "CTOT_NSA_P1W4WL1",
    ],
    "MCONF_CHG": [
        # Manufacturing confidence scores
        "MBCSCORE_SA_D3M3ML3",
        "MBCSCORE_SA_D6M6ML6",
    ],
    "MTB_CHG": [
        "MTBGDPRATIO_SA_3MMA_D1M1ML3",
        "MTBGDPRATIO_SA_6MMA_D1M1ML6",
    ],
    "MONEY_PCHG": [
        "MNARROW_SJA_P1M1ML12",
        "MBROAD_SJA_P1M1ML12",
    ],
    "CONS_NEG": [
        # retail sales
        "RRSALES_SA_P1M1ML12_3MMA",
        "RRSALES_SA_P1Q1QL4",
        # Real private consumption trend
        "RPCONS_SA_P1M1ML12_3MMA",
        "RPCONS_SA_P1Q1QL4",
    ],
}

main_ecos = [cat for cat_grp in ecos_groups.values() for cat in cat_grp]

# Complementary economic indicators
added_ecos = [
    "RGDP_SA_P1Q1QL4_20QMM",
    "INFE1Y_JA",
]

all_ecos = main_ecos + added_ecos

# Market indicators
eqrets = ["EQC" + sec + ret for sec in secx for ret in ["XR_NSA", "XR_VT10", "R_NSA", "R_VT10"]]
eqblack = ["EQC" + sec + "UNTRADABLE_NSA" for sec in secx]
bmrs = ["USD_EQXR_NSA", "USD_EQXR_VT10"]  # U.S. equity returns for correlation analysis
marks = eqrets + eqblack

# All indicators
xcats = all_ecos + marks

# Resultant tickers
tickers = [cid + "_" + xcat for cid in cids for xcat in xcats] + bmrs
print(f"Maximum number of tickers is {len(tickers)}")
Maximum number of tickers is 1532
The JPMaQS indicators we consider are downloaded using the J.P. Morgan Dataquery API interface within the
macrosynergy
package. This is done by specifying ticker strings, formed by appending an indicator category code
DB(JPMAQS,<cross_section>_<category>,<info>)
, where
value
giving the latest available values for the indicator
eop_lag
referring to days elapsed since the end of the observation period
mop_lag
referring to the number of days elapsed since the mean observation period
grade
denoting a grade of the observation, giving a metric of real-time information quality.
After instantiating the
JPMaQSDownload
class within the
macrosynergy.download
module, one can use the
download(tickers,start_date,metrics)
method to easily download the necessary data, where
tickers
is an array of ticker strings,
start_date
is the first collection date to be considered and
metrics
is an array comprising the times series information to be downloaded. For more information see
here
.
client_id: str = os.getenv("DQ_CLIENT_ID")
client_secret: str = os.getenv("DQ_CLIENT_SECRET")

with JPMaQSDownload(oauth=True, client_id=client_id, client_secret=client_secret) as dq:
    assert dq.check_connection()
    df = dq.download(
        tickers=tickers,
        start_date="1990-01-01",
        suppress_warning=True,
        metrics=["value"],
        show_progress=True,
    )
    assert isinstance(df, pd.DataFrame) and not df.empty
Downloading data from JPMaQS.
Timestamp UTC:  2025-10-23 10:55:51
Connection successful!
Requesting data: 100%|██████████| 77/77 [00:15<00:00,  4.92it/s]
Downloading data: 100%|██████████| 77/77 [00:36<00:00,  2.11it/s]
Some expressions are missing from the downloaded data. Check logger output for complete list.
146 out of 1532 expressions are missing. To download the catalogue of all available expressions and filter the unavailable expressions, set `get_catalogue=True` in the call to `JPMaQSDownload.download()`.
dfx = df.copy()
Renaming and availability #
# Rename quarterly tickers to equivalent monthly tickers

dict_repl = {
    # labour
    "EMPL_NSA_P1Q1QL4": "EMPL_NSA_P1M1ML12_3MMA",
    "UNEMPLRATE_NSA_D1Q1QL4": "UNEMPLRATE_NSA_3MMA_D1M1ML12",
    "WFORCE_NSA_P1Y1YL1": "WFORCE_NSA_P1Q1QL4",
    # private consumption
    "RPCONS_SA_P1Q1QL4": "RPCONS_SA_P1M1ML12_3MMA",
    "RRSALES_SA_P1Q1QL4": "RRSALES_SA_P1M1ML12_3MMA",
}

for key, value in dict_repl.items():
    # Replace in dataframe
    dfx["xcat"] = dfx["xcat"].str.replace(key, value)

    # Remove quarterly categories in ecos_groups dictionary
    for grp_name, cat_grp in ecos_groups.items():
        if key in cat_grp:
            ecos_groups[grp_name] = list(set(cat_grp) - {key})

ecos = [cat for cat_grp in ecos_groups.values() for cat in cat_grp]
xcatx = list(set(ecos + added_ecos) - set(dict_repl.keys()))
cidx = cids_eqx
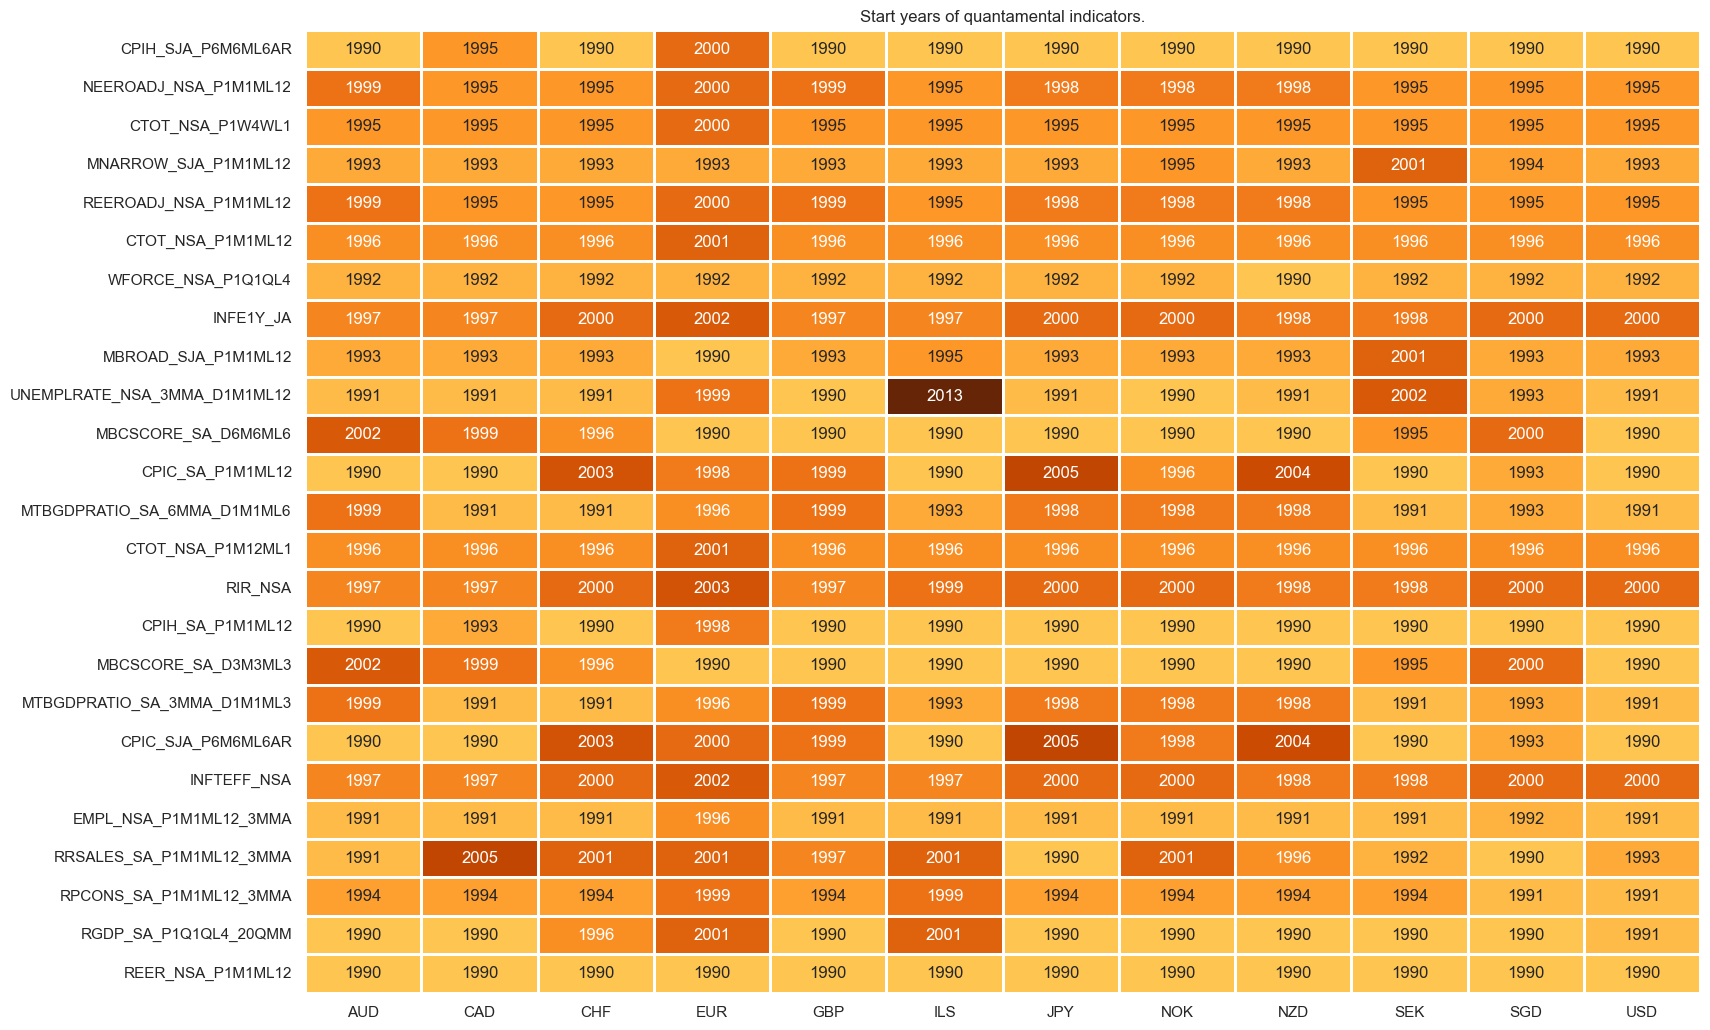
msm.check_availability(dfx, xcats=xcatx, cids=cidx, missing_recent=False)
Transformations and checks #
Directional factors #
Inflation shortfall #
# Negative of excess inflation

cidx = cids_eqx

cpi_cats = [
    "CPIH_SA_P1M1ML12",
    "CPIH_SJA_P6M6ML6AR",
    "CPIC_SA_P1M1ML12",
    "CPIC_SJA_P6M6ML6AR",
]
inf_calcs = {f"X{cpi_cat}_NEG": f"- {cpi_cat} + INFTEFF_NSA" for cpi_cat in cpi_cats}

dfa = msp.panel_calculator(
    dfx, calcs=[" = ".join([k, v]) for k, v in inf_calcs.items()], cids=cidx
)
dfx = msm.update_df(dfx, dfa)
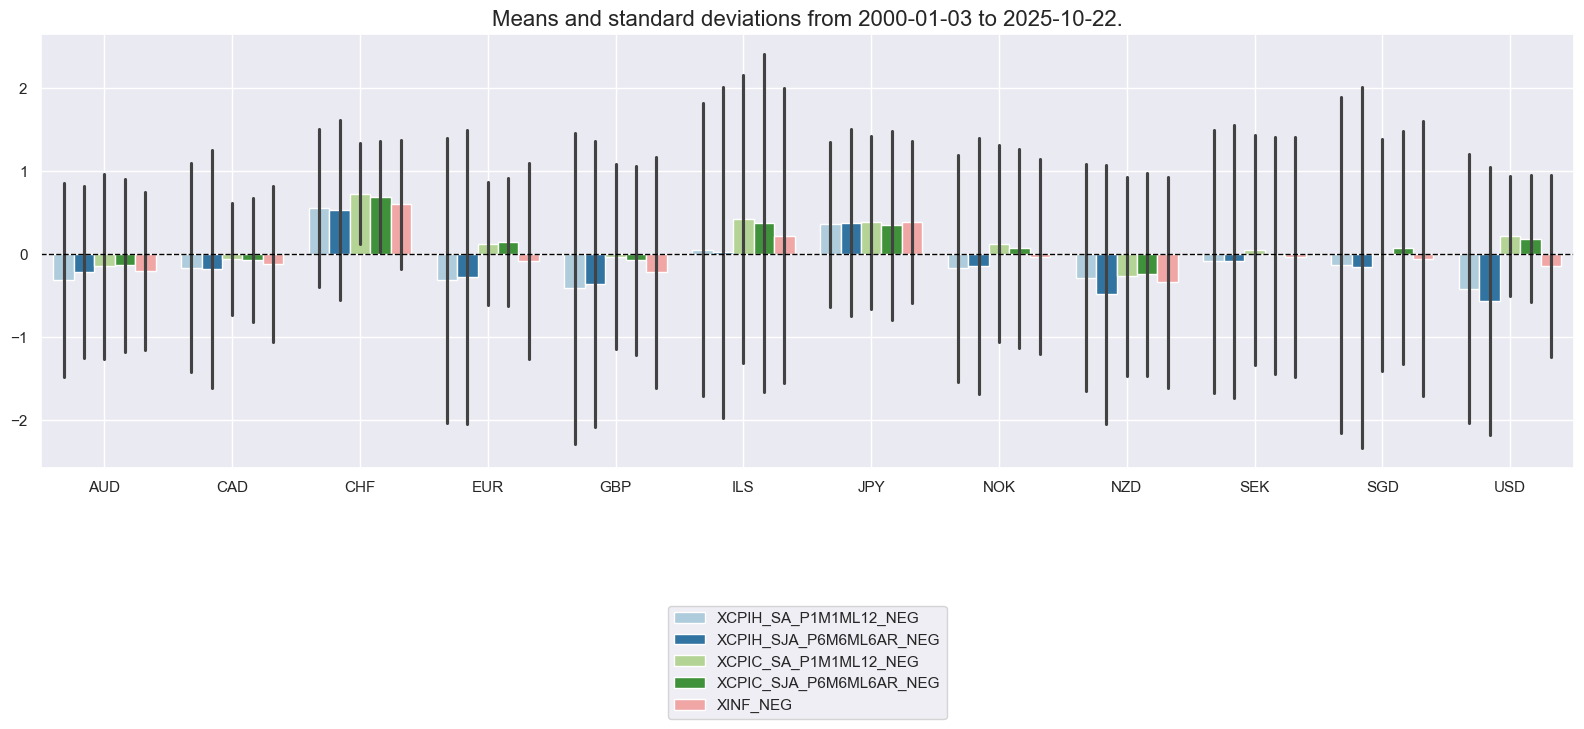
# Combined excess CPI inflation indicators

cidx = cids_eqx
xcatx = list(inf_calcs.keys())


macro_cat = "XINF_NEG"
combined_macro = {}  # initiate summary dictionary for factors and constituents
combined_macro[macro_cat] = xcatx  # update summary dictionary

# combining the single indicators into a group-level indicator
dfa = msp.linear_composite(
    df=dfx,
    xcats=xcatx,
    cids=cidx,
    complete_xcats=False,
    new_xcat=macro_cat,
)
dfx = msm.update_df(dfx, dfa)
cidx = cids_eqx
xcatx = combined_macro["XINF_NEG"] + ["XINF_NEG"]
msp.view_ranges(
dfx,
xcats=xcatx,
cids=cidx,
start="2000-01-01",
kind="bar",
)
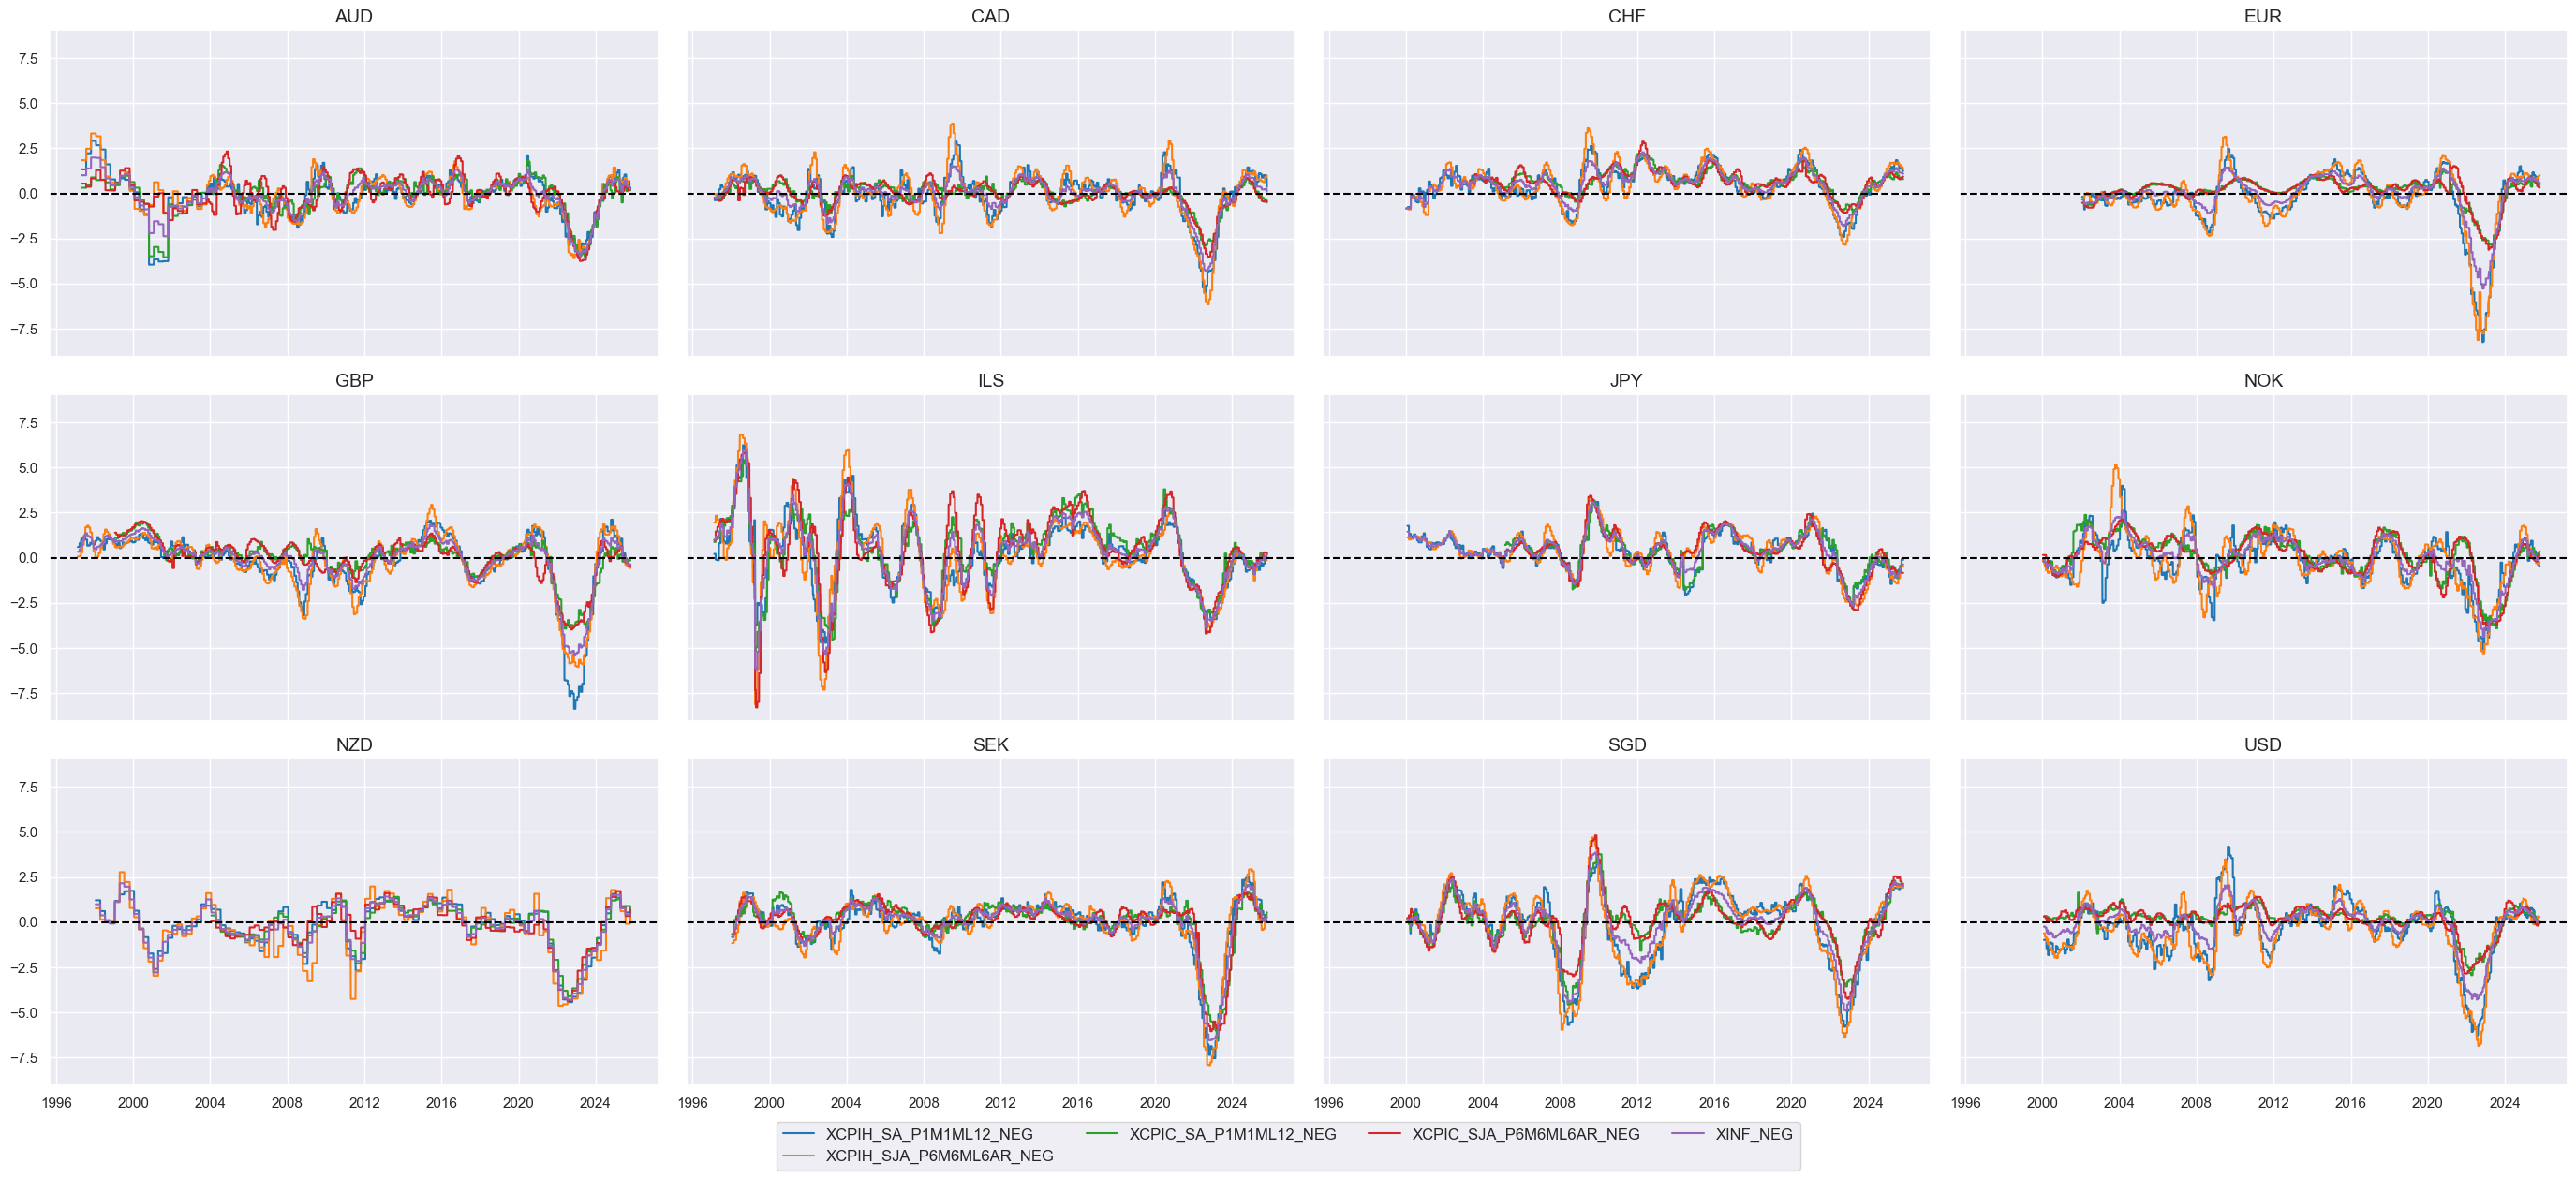
msp.view_timelines(
dfx,
xcats=xcatx,
cids=cidx,
title=None,
cumsum=False,
ncol=4,
same_y=True,
all_xticks=False,
xcat_grid=False,
)
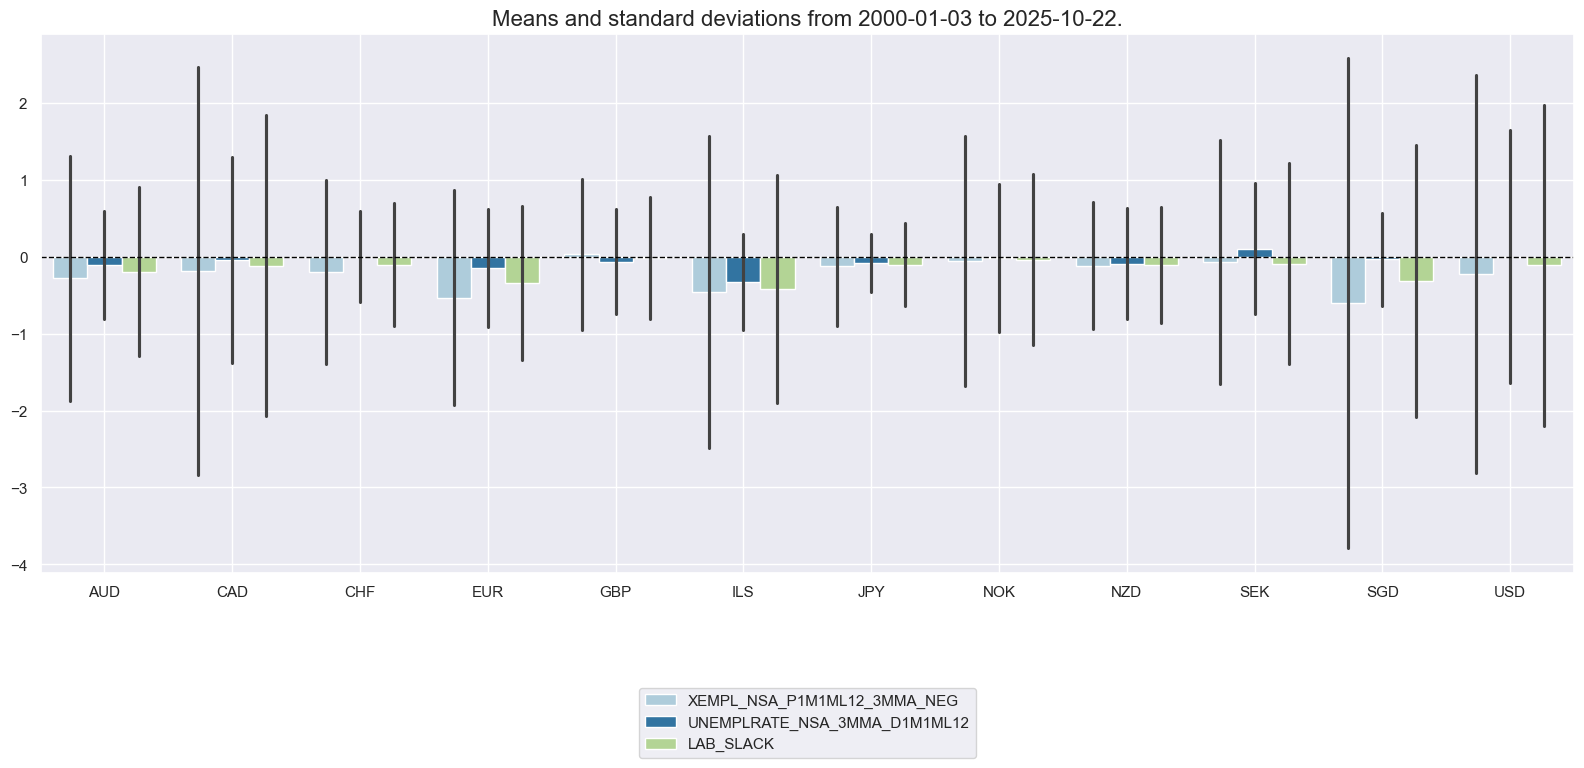
Labour market slackening #
cidx = cids_eqx

lab_calcs = {
     # Excess employment growth
    "XEMPL_NSA_P1M1ML12_3MMA_NEG": "- EMPL_NSA_P1M1ML12_3MMA + WFORCE_NSA_P1Q1QL4",
    "UNEMPLRATE_NSA_3MMA_D1M1ML12": "UNEMPLRATE_NSA_3MMA_D1M1ML12"
}
dfa = msp.panel_calculator(
    dfx,
    calcs=[" = ".join([k, v]) for k, v in lab_calcs.items()],
    cids=cidx
)

dfx = msm.update_df(dfx, dfa)
# Combined labor market indicator

cidx = cids_eqx
xcatx = list(lab_calcs.keys())

macro_cat = "LAB_SLACK"
combined_macro[macro_cat] = xcatx  # update summary dictionary

# combining the single indicators into a group-level indicator
dfa = msp.linear_composite(
    df=dfx,
    xcats=xcatx,
    cids=cidx,
    complete_xcats=False,
    new_xcat=macro_cat,
)
dfx = msm.update_df(dfx, dfa)
cidx = cids_eqx
xcatx = combined_macro["LAB_SLACK"] + ["LAB_SLACK"]

msp.view_ranges(
    dfx,
    xcats=xcatx,
    cids=cidx,
    start="2000-01-01",
    kind="bar",
)

msp.view_timelines(
    dfx,
    xcats=xcatx,
    cids=cidx,
    title=None,
    cumsum=False,
    ncol=4,
    same_y=True,
    all_xticks=False,
    xcat_grid=False,
)

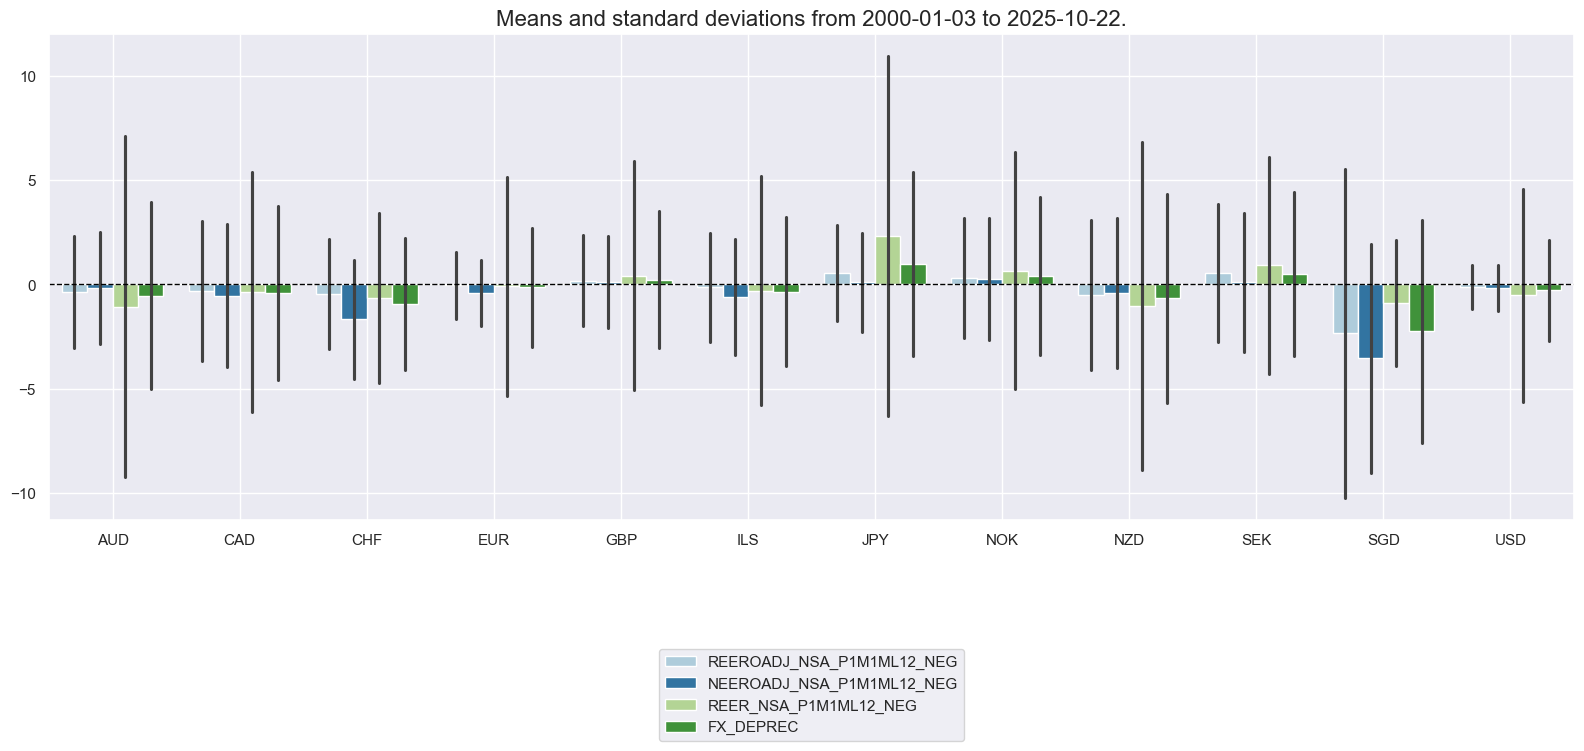
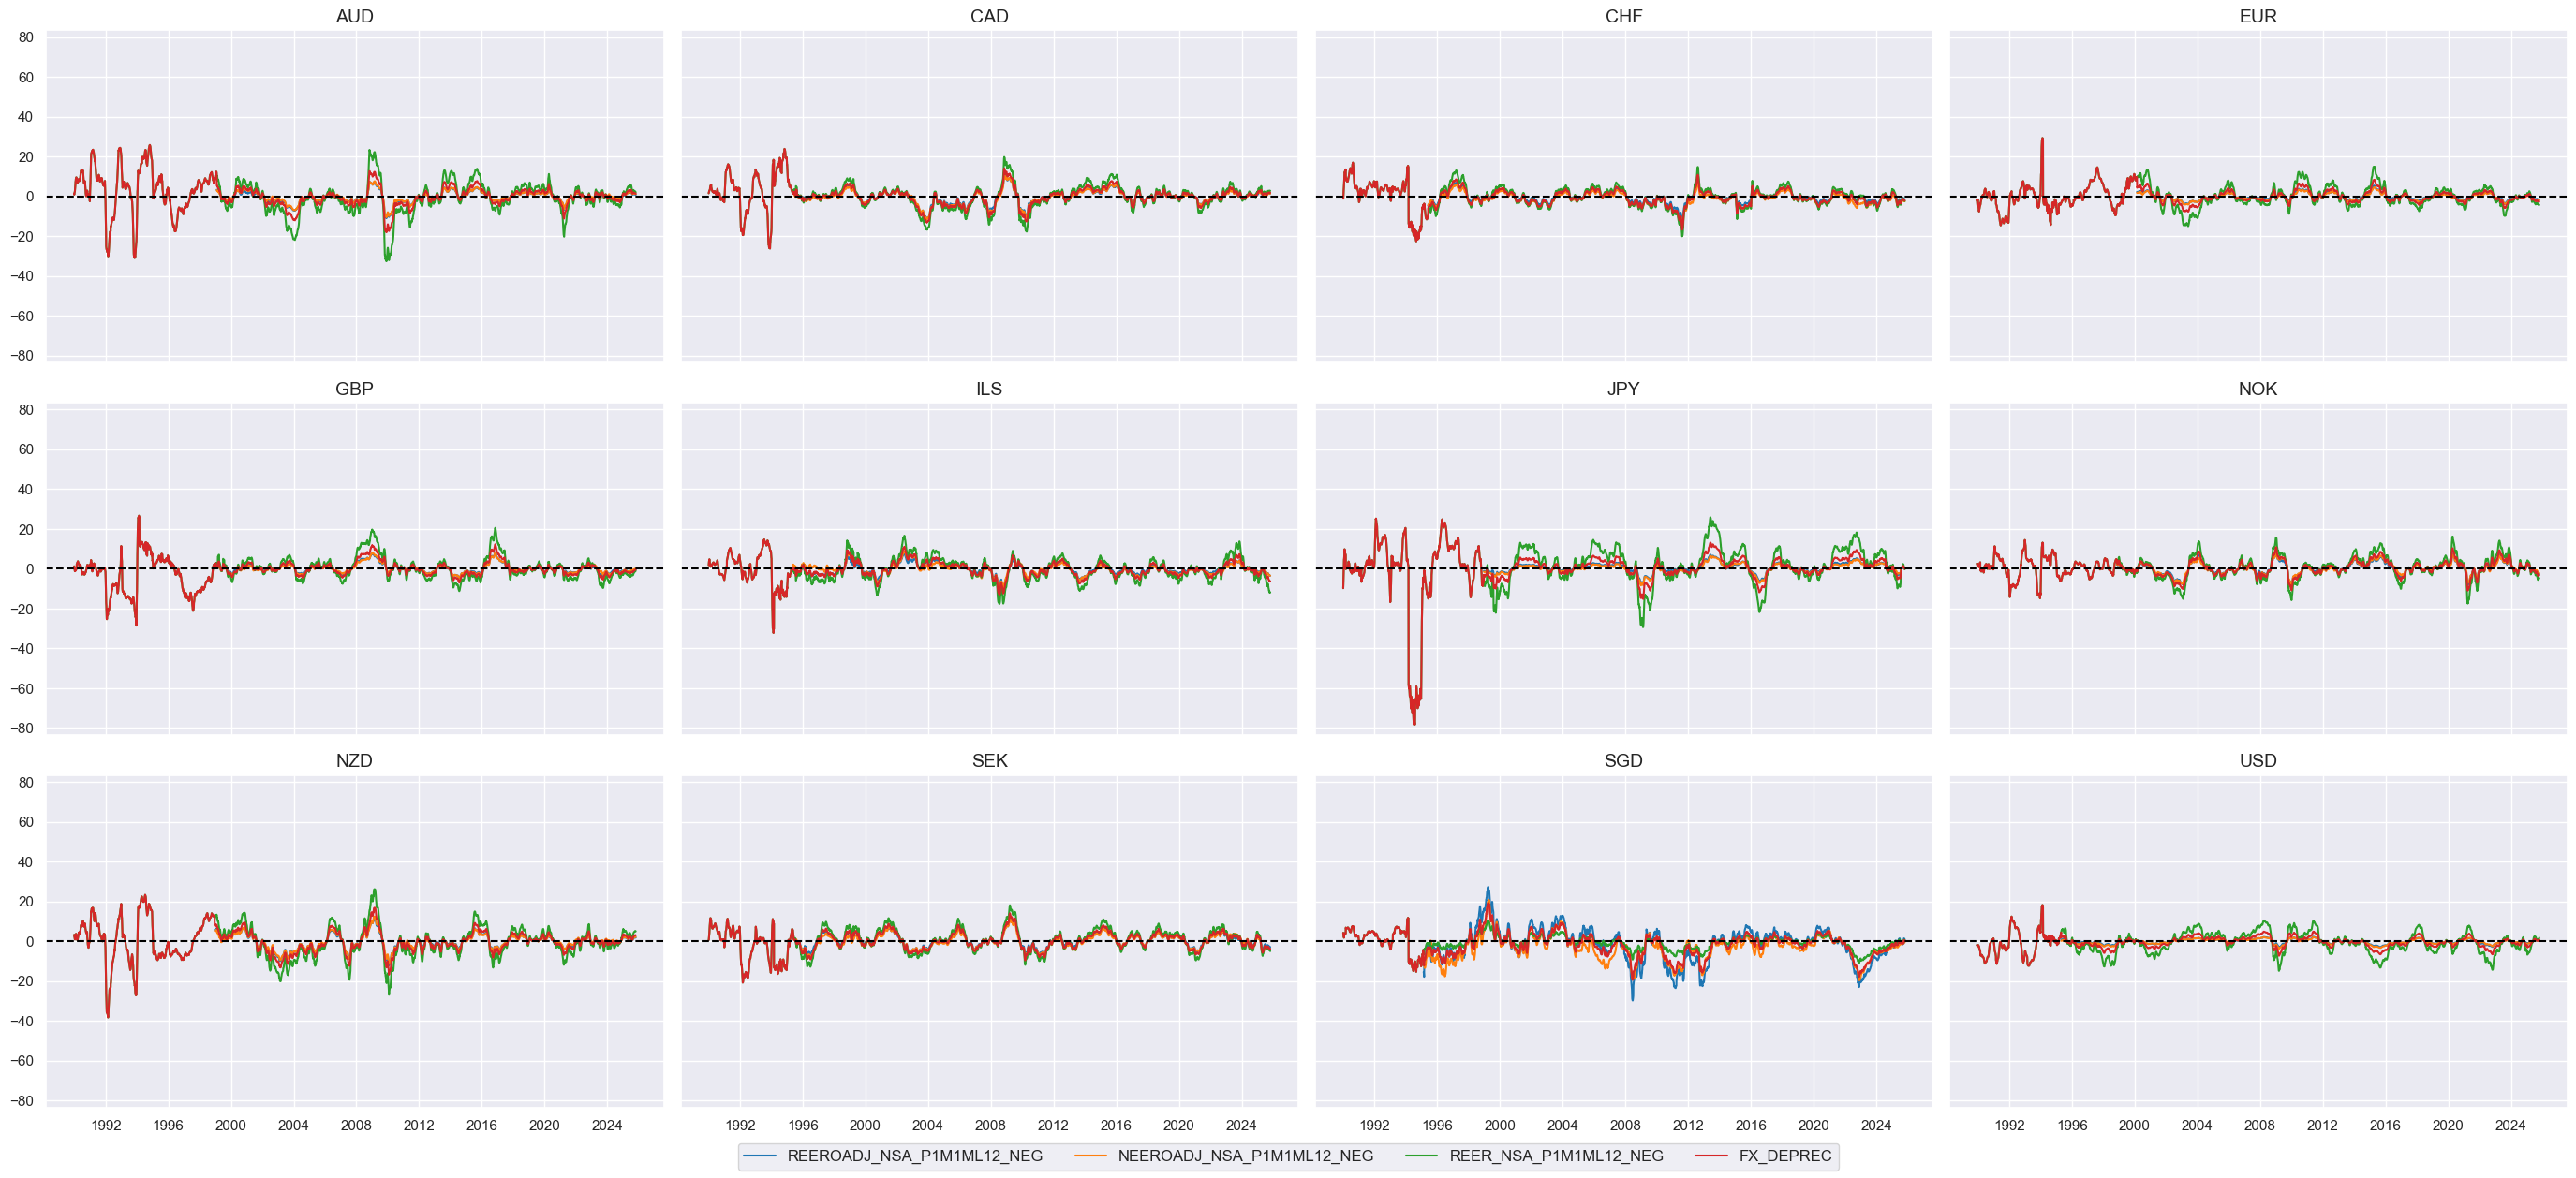
Effective currency depreciation #
cidx = cids_eqx

fxd_calcs = {
    f"{depr}_NEG": f"- {depr}" for depr in ecos_groups["FX_DEPREC"]
}
dfa = msp.panel_calculator(
    dfx,
    calcs=[" = ".join([k, v]) for k, v in fxd_calcs.items()],
    cids=cidx
)

dfx = msm.update_df(dfx, dfa)
# Combined depreciation metric

cidx = cids_eqx
xcatx = list(fxd_calcs.keys())


macro_cat = "FX_DEPREC"
combined_macro[macro_cat] = xcatx  # update summary dictionary

# combining the single indicators into a group-level indicator
dfa = msp.linear_composite(
    df=dfx,
    xcats=xcatx,
    cids=cidx,
    complete_xcats=False,
    new_xcat=macro_cat,
)
dfx = msm.update_df(dfx, dfa)
cidx = cids_eqx
xcatx = combined_macro["FX_DEPREC"] + ["FX_DEPREC"]

msp.view_ranges(
    dfx,
    xcats=xcatx,
    cids=cidx,
    start="2000-01-01",
    kind="bar",
)

msp.view_timelines(
    dfx,
    xcats=xcatx,
    cids=cidx,
    title=None,
    cumsum=False,
    ncol=4,
    same_y=True,
    all_xticks=False,
    xcat_grid=False,
)
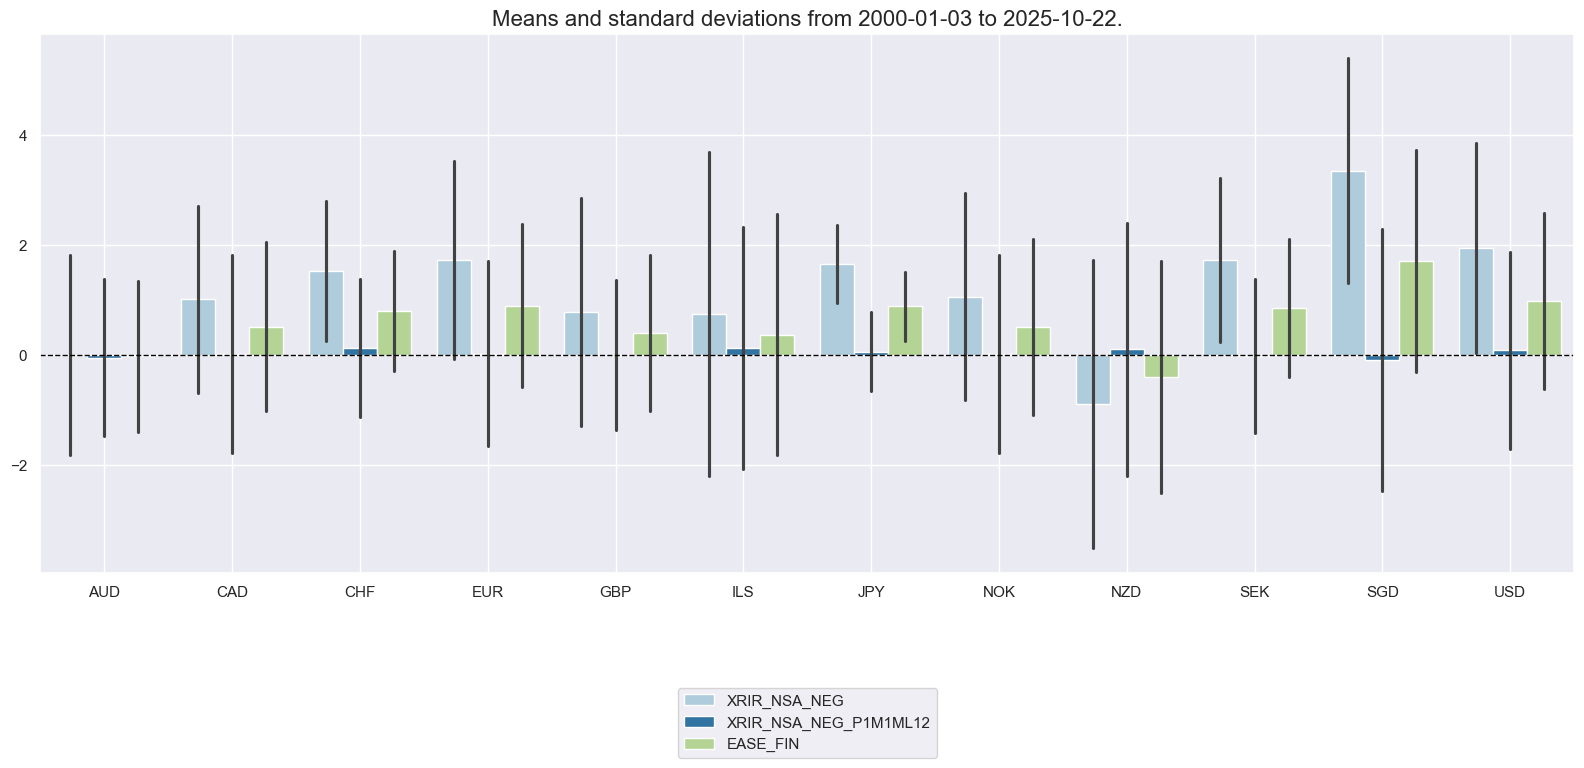
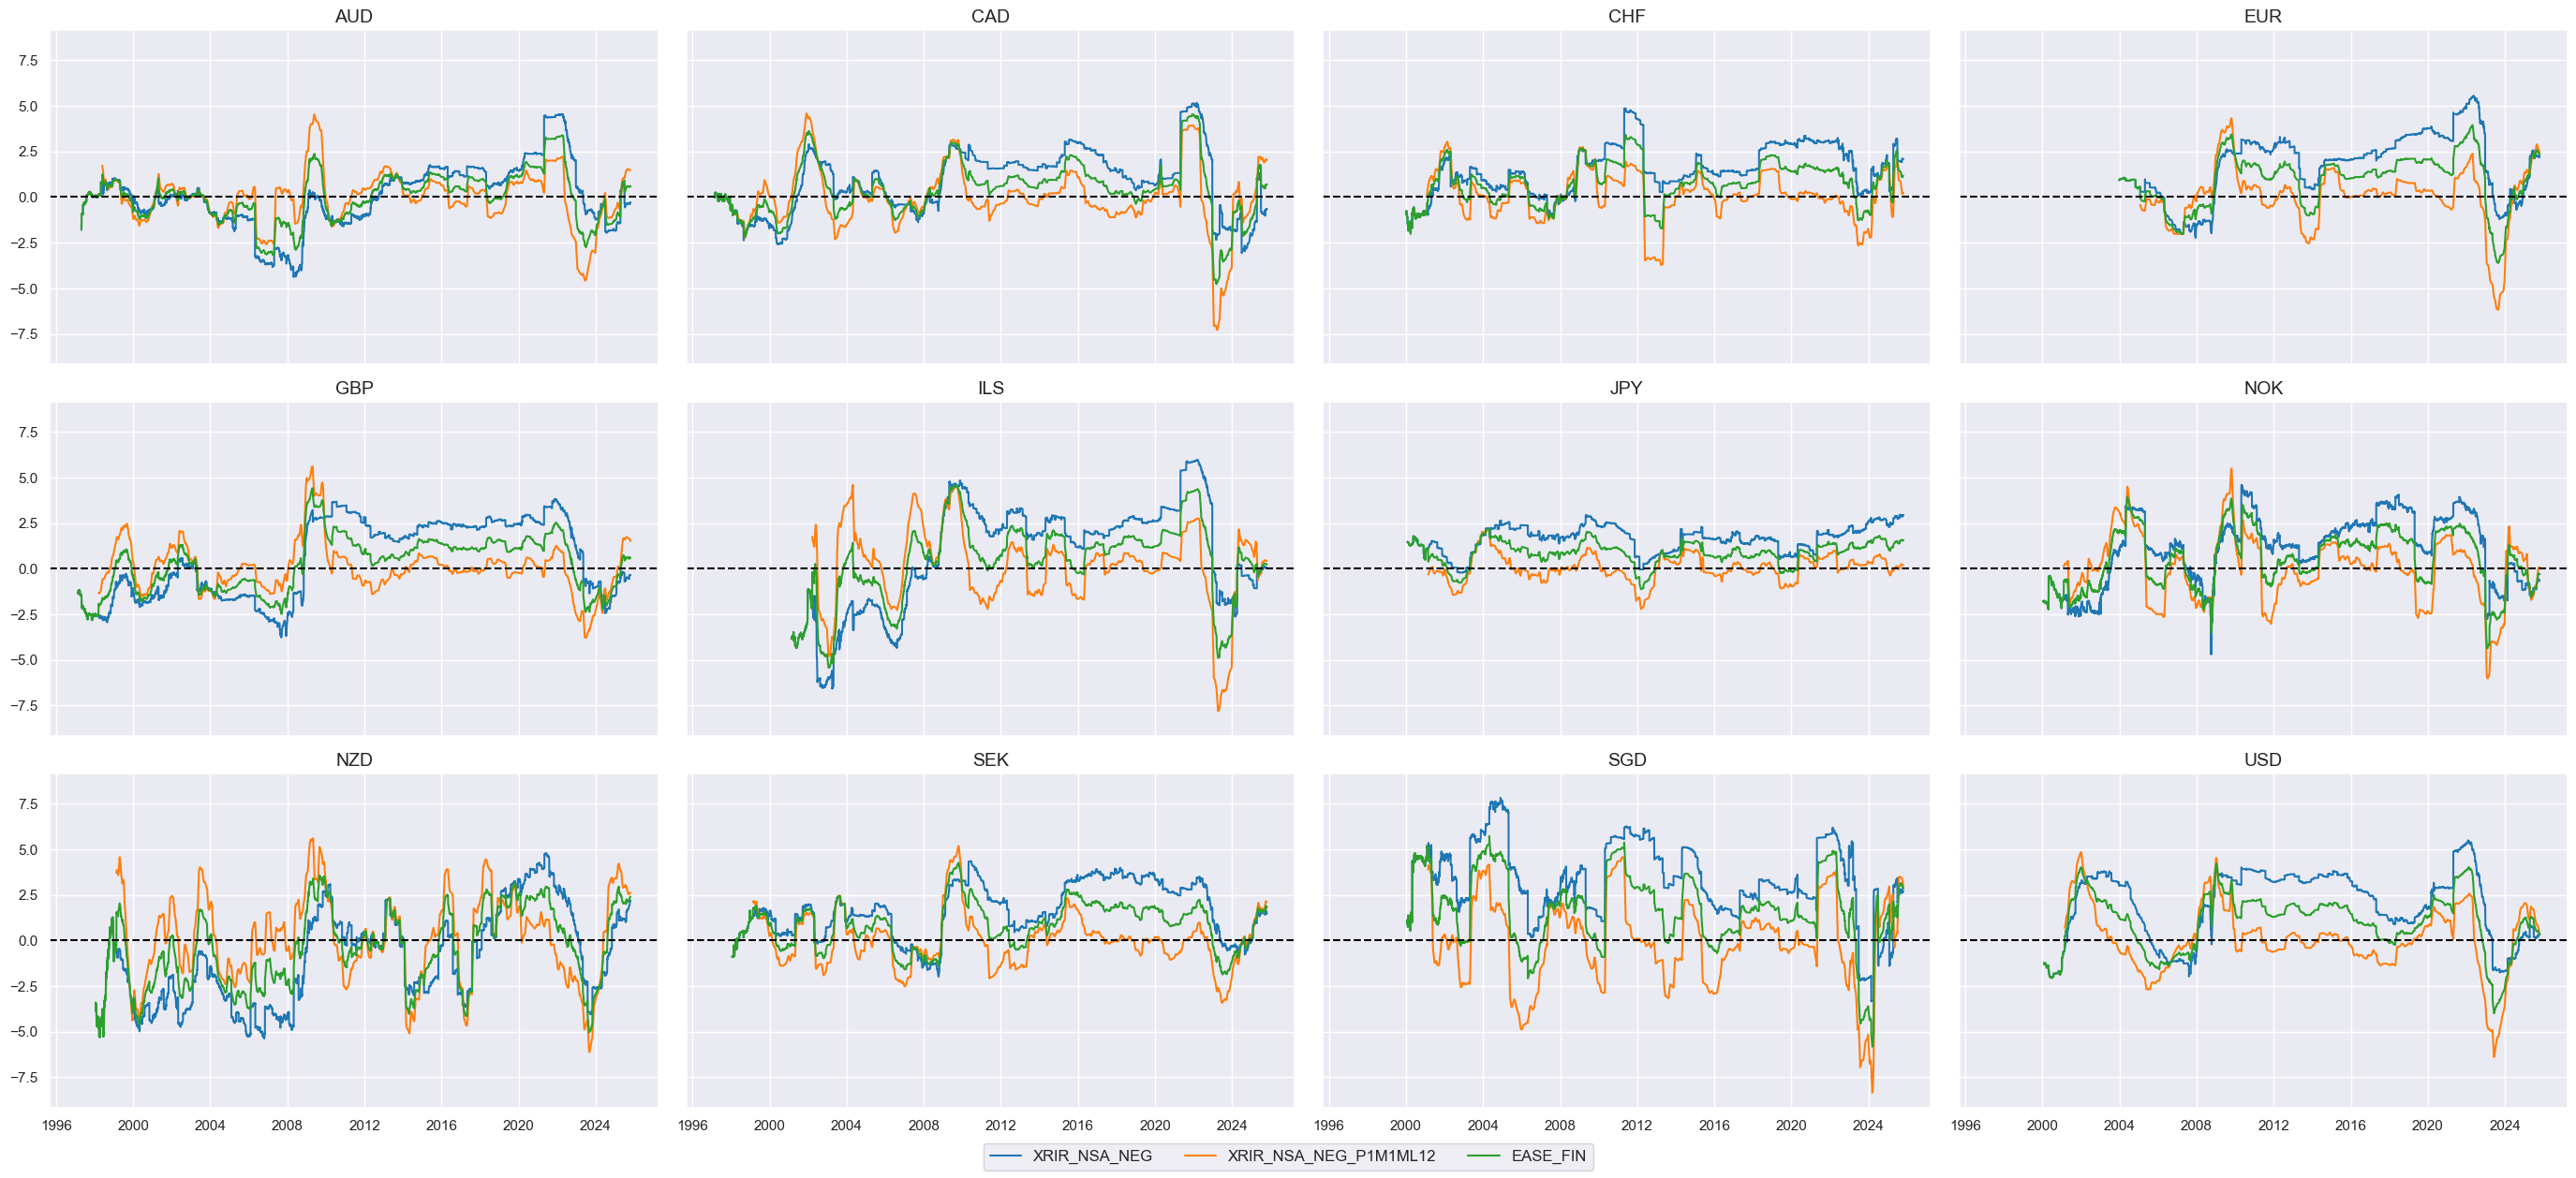
Ease of local finance #
# Real interest rate levels and changes

cidx = cids_eqx

elf_calcs = {
    "XRIR_NSA_NEG": "- ( RIR_NSA - INFTEFF_NSA + INFE1Y_JA ) + RGDP_SA_P1Q1QL4_20QMM - WFORCE_NSA_P1Q1QL4",
    "XRIR_NSA_NEG_P1M1ML12": "XRIR_NSA_NEG.rolling(21).mean() - XRIR_NSA_NEG.rolling(21).mean().shift(262)",
}
dfa = msp.panel_calculator(
    dfx,
    calcs=[" = ".join([k, v]) for k, v in elf_calcs.items()],
    cids=cidx
)

dfx = msm.update_df(dfx, dfa)
# Combined excess CPI inflation indicators

cidx = cids_eqx
xcatx = list(elf_calcs.keys())


macro_cat = "EASE_FIN"
combined_macro[macro_cat] = xcatx  # update summary dictionary

# combining the single indicators into a group-level indicator
dfa = msp.linear_composite(
    df=dfx,
    xcats=xcatx,
    cids=cidx,
    complete_xcats=False,
    new_xcat=macro_cat,
)
dfx = msm.update_df(dfx, dfa)
cidx = cids_eqx
xcatx = combined_macro["EASE_FIN"] + ["EASE_FIN"]

msp.view_ranges(
    dfx,
    xcats=xcatx,
    cids=cidx,
    start="2000-01-01",
    kind="bar",
)

msp.view_timelines(
    dfx,
    xcats=xcatx,
    cids=cidx,
    title=None,
    cumsum=False,
    ncol=4,
    same_y=True,
    all_xticks=False,
    xcat_grid=False,
)
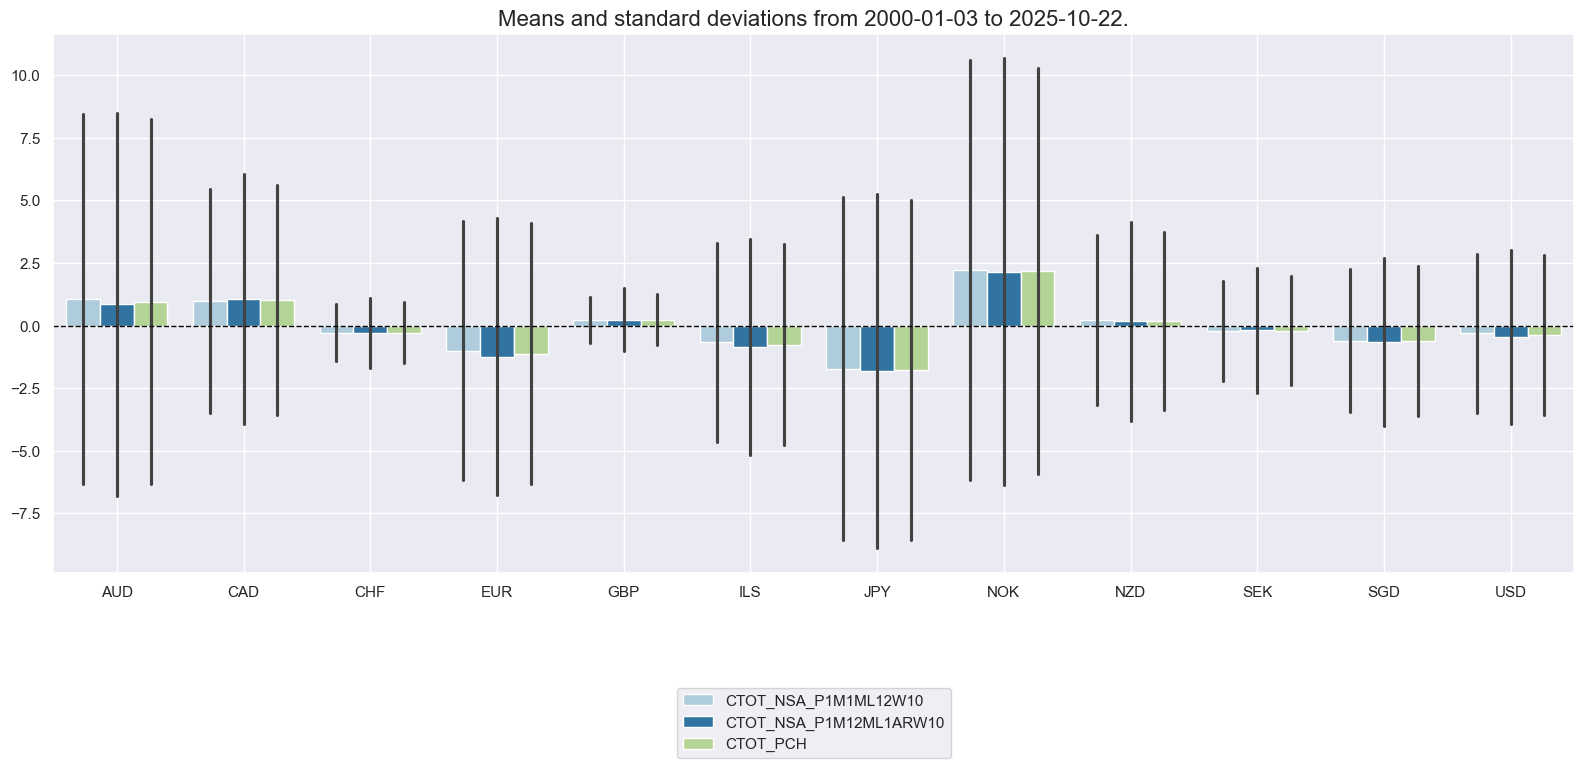
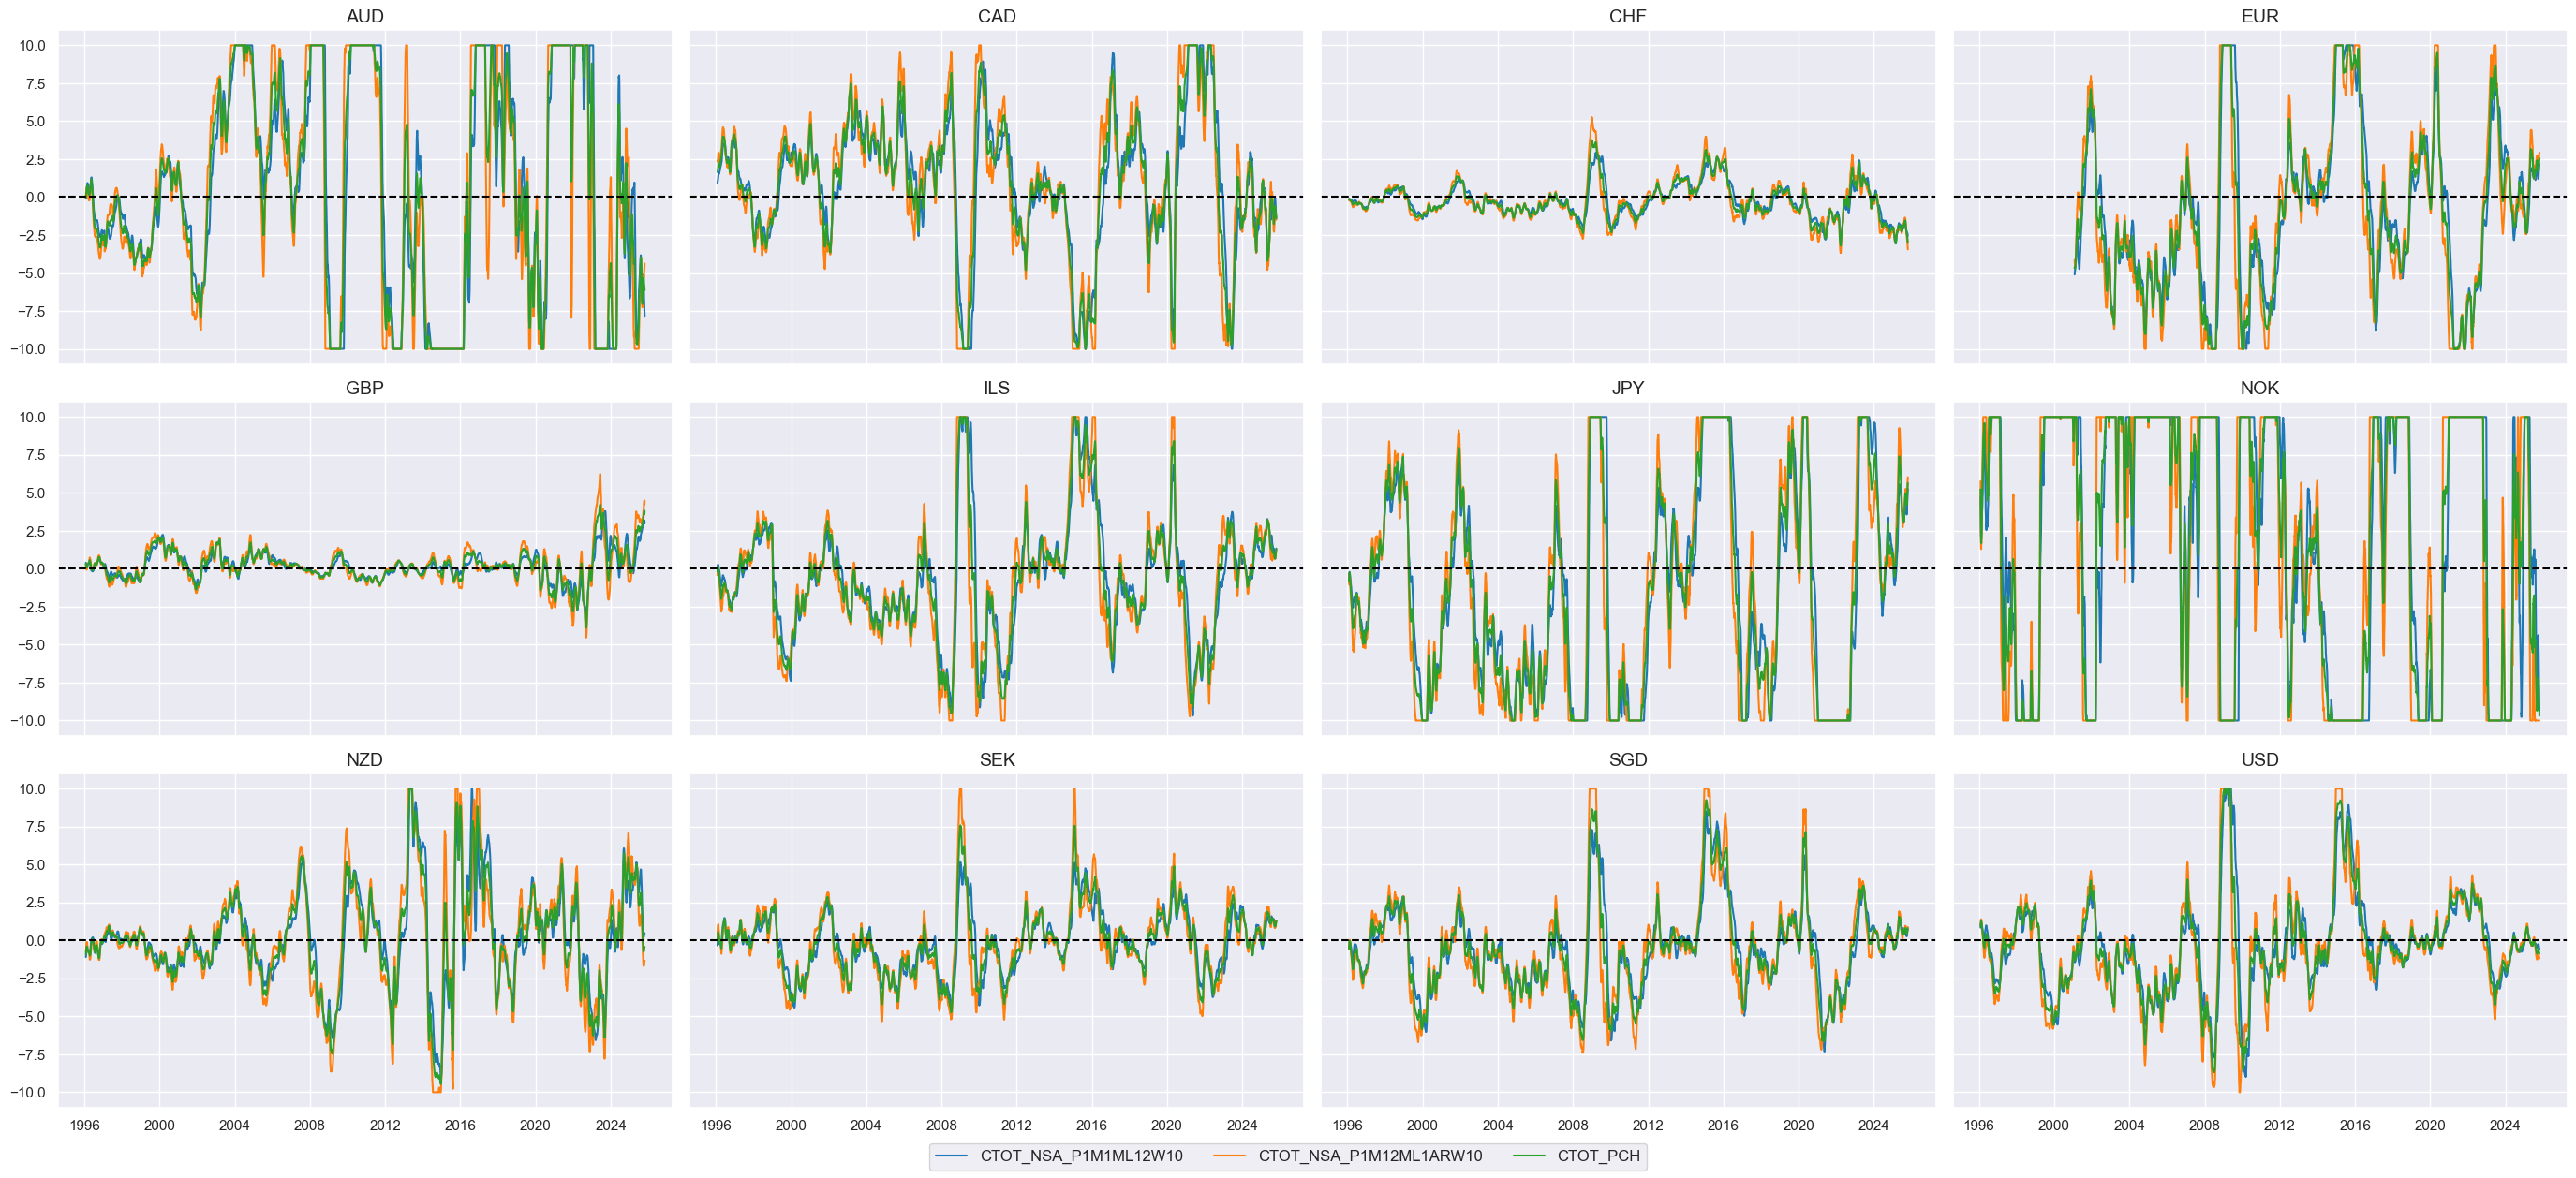
Terms of trade improvement #
# Winsorized terms-of-trade changes

tot_calcs = {
    "CTOT_NSA_P1M1ML12W10": "CTOT_NSA_P1M1ML12.clip(lower=-10, upper=10)",
    "CTOT_NSA_P1M12ML1ARW10": "( 2 * CTOT_NSA_P1M12ML1 ).clip(lower=-10, upper=10)",
}
dfa = msp.panel_calculator(
    dfx,
    calcs=[" = ".join([k, v]) for k, v in tot_calcs.items()],
    cids=cids
)

dfx = msm.update_df(dfx, dfa)
# Combined terms-of-trade dynamics

cidx = cids_eqx
xcatx = list(tot_calcs.keys())


macro_cat = "CTOT_PCH"
combined_macro[macro_cat] = xcatx  # update summary dictionary

# combining the single indicators into a group-level indicator
dfa = msp.linear_composite(
    df=dfx,
    xcats=xcatx,
    cids=cidx,
    complete_xcats=False,
    new_xcat=macro_cat,
)
dfx = msm.update_df(dfx, dfa)
cidx = cids_eqx
xcatx = combined_macro["CTOT_PCH"] + ["CTOT_PCH"]

msp.view_ranges(
    dfx,
    xcats=xcatx,
    cids=cidx,
    start="2000-01-01",
    kind="bar",
)

msp.view_timelines(
    dfx,
    xcats=xcatx,
    cids=cidx,
    title=None,
    cumsum=False,
    ncol=4,
    same_y=True,
    all_xticks=False,
    xcat_grid=False,
)
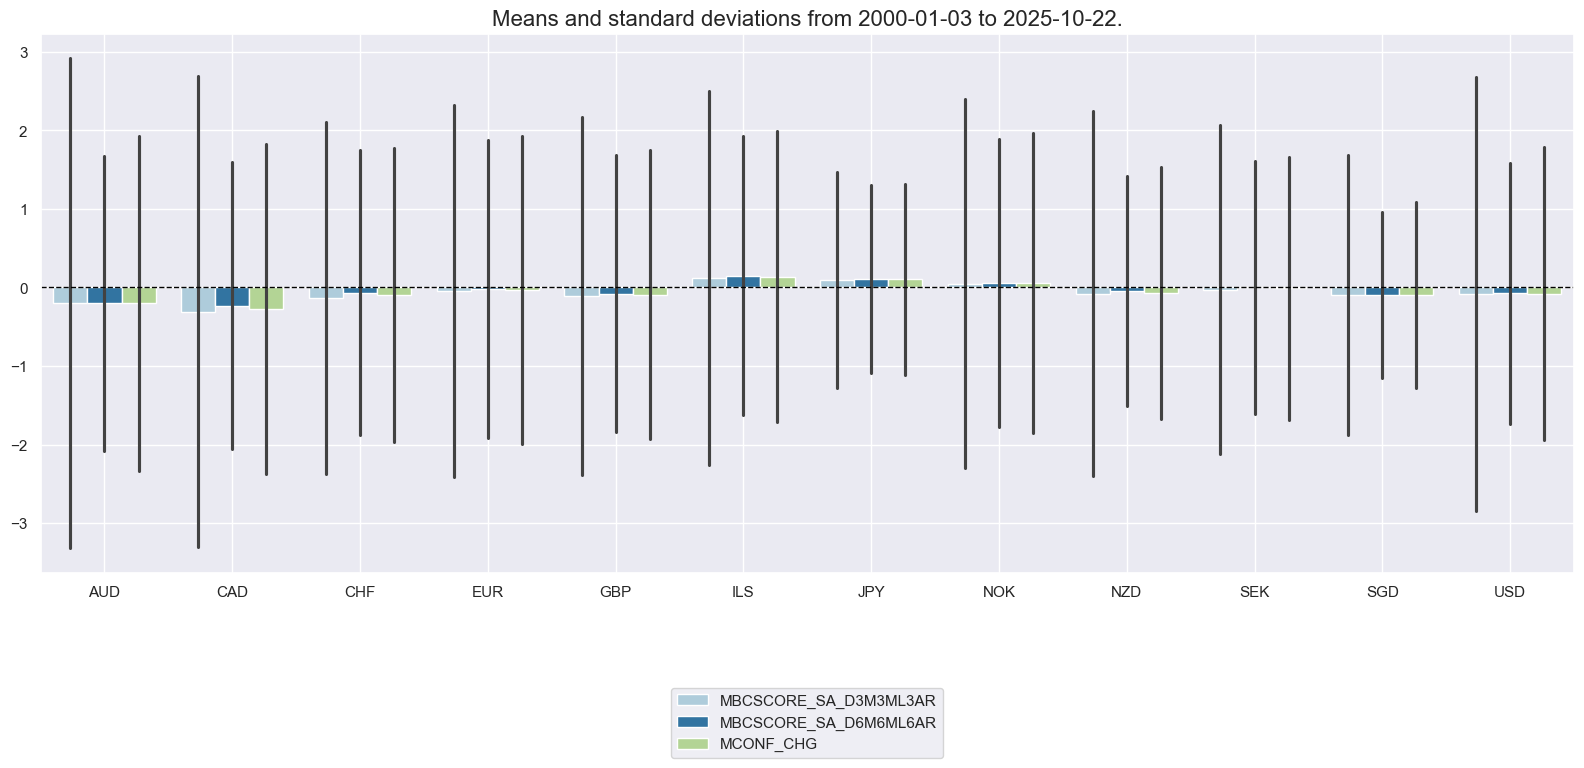
Manufacturing confidence improvement #
cidx = cids_eqx

man_calcs = {
     # Excess employment growth
    "MBCSCORE_SA_D3M3ML3AR": "4 * MBCSCORE_SA_D3M3ML3",
    "MBCSCORE_SA_D6M6ML6AR": "2 * MBCSCORE_SA_D6M6ML6"
}
dfa = msp.panel_calculator(
    dfx,
    calcs=[" = ".join([k, v]) for k, v in man_calcs.items()],
    cids=cidx
)

dfx = msm.update_df(dfx, dfa)
# Combined confidence increase indicator

cidx = cids_eqx
xcatx = list(man_calcs.keys())


macro_cat = "MCONF_CHG"
combined_macro[macro_cat] = xcatx  # update summary dictionary

# combining the single indicators into a group-level indicator
dfa = msp.linear_composite(
    df=dfx,
    xcats=xcatx,
    cids=cidx,
    complete_xcats=False,
    new_xcat=macro_cat,
)
dfx = msm.update_df(dfx, dfa)
cidx = cids_eqx
xcatx = combined_macro["MCONF_CHG"] + ["MCONF_CHG"]

msp.view_ranges(
    dfx,
    xcats=xcatx,
    cids=cidx,
    start="2000-01-01",
    kind="bar",
)

msp.view_timelines(
    dfx,
    xcats=xcatx,
    cids=cidx,
    title=None,
    cumsum=False,
    ncol=4,
    same_y=True,
    all_xticks=False,
    xcat_grid=False,
)

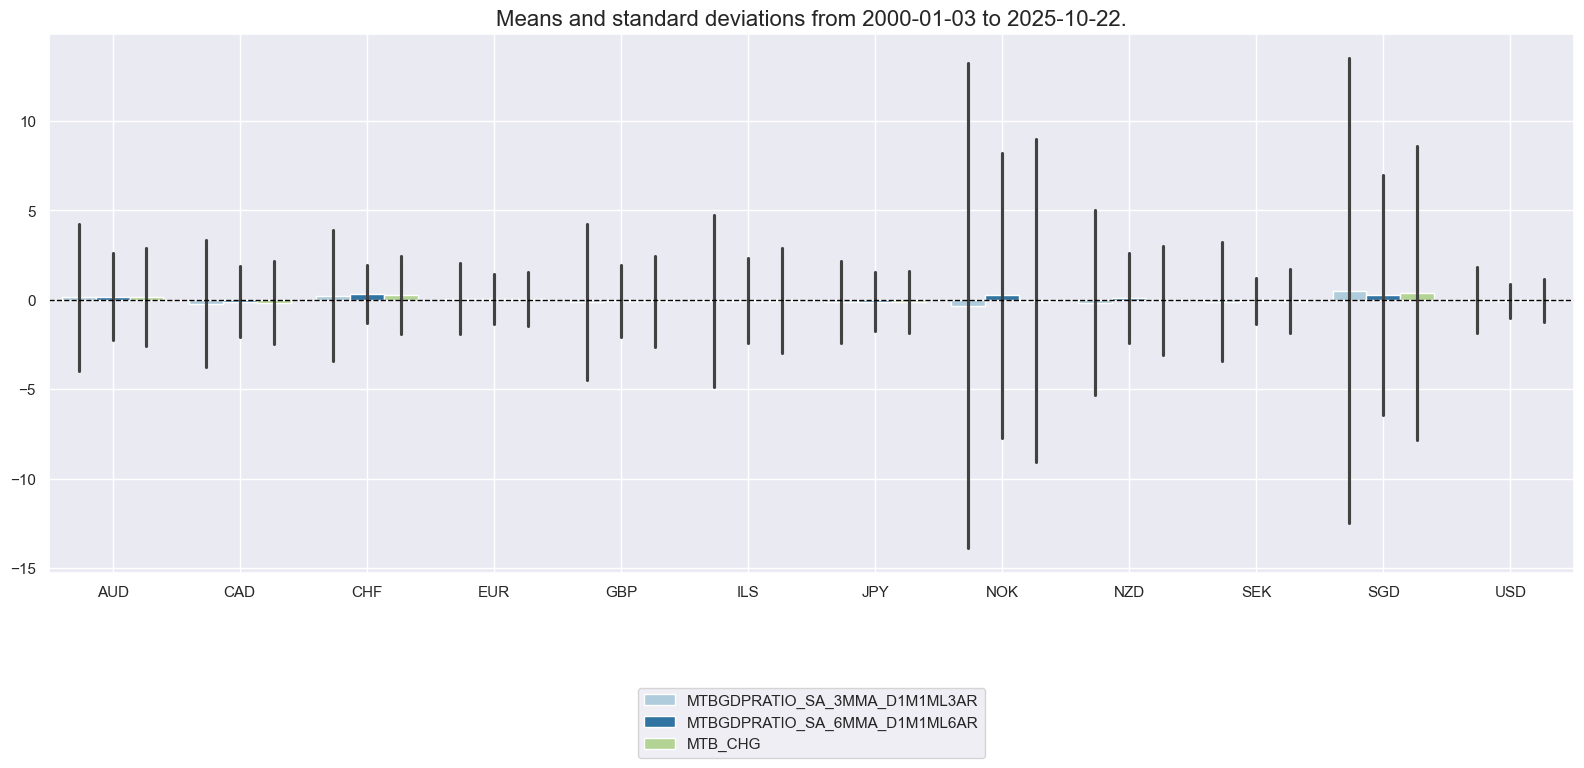
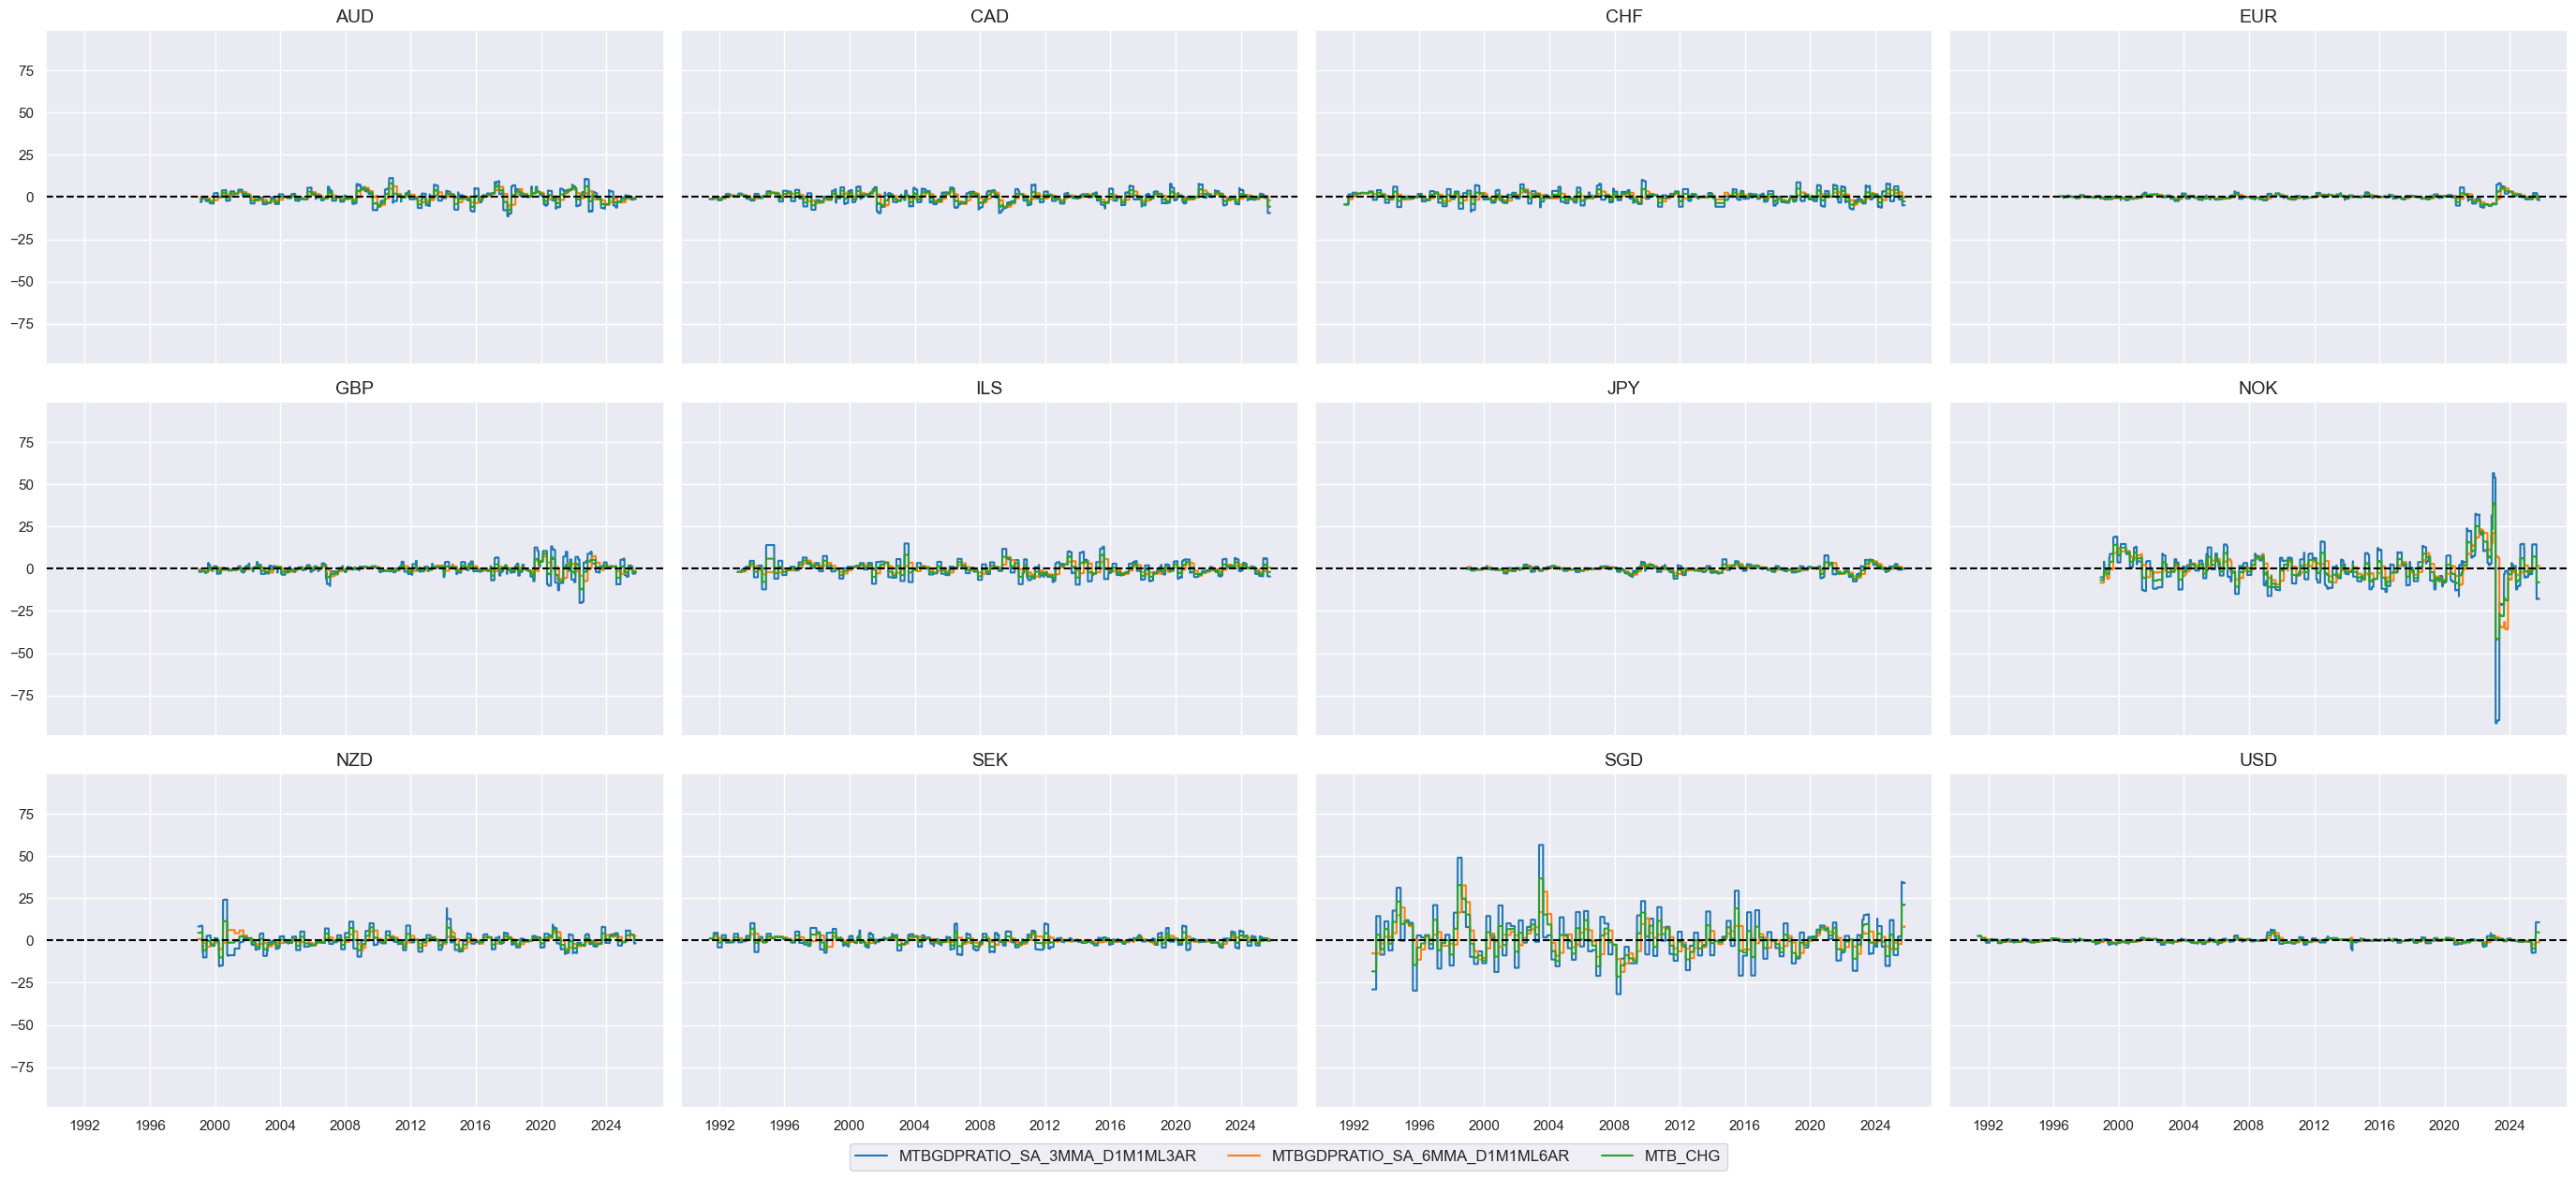
Trade balance improvement #
cidx = cids_eqx

mtb_calcs = {
    "MTBGDPRATIO_SA_3MMA_D1M1ML3AR": "4 * MTBGDPRATIO_SA_3MMA_D1M1ML3",
    "MTBGDPRATIO_SA_6MMA_D1M1ML6AR": "2 * MTBGDPRATIO_SA_6MMA_D1M1ML6"
}
dfa = msp.panel_calculator(
    dfx,
    calcs=[" = ".join([k, v]) for k, v in mtb_calcs.items()],
    cids=cidx
)

dfx = msm.update_df(dfx, dfa)
# Combined confidence increase indicator

cidx = cids_eqx
xcatx = list(mtb_calcs.keys())


macro_cat = "MTB_CHG"
combined_macro[macro_cat] = xcatx  # update summary dictionary

# combining the single indicators into a group-level indicator
dfa = msp.linear_composite(
    df=dfx,
    xcats=xcatx,
    cids=cidx,
    complete_xcats=False,
    new_xcat=macro_cat,
)
dfx = msm.update_df(dfx, dfa)
cidx = cids_eqx
xcatx = combined_macro["MTB_CHG"] + ["MTB_CHG"]

msp.view_ranges(
    dfx,
    xcats=xcatx,
    cids=cidx,
    start="2000-01-01",
    kind="bar",
)

msp.view_timelines(
    dfx,
    xcats=xcatx,
    cids=cidx,
    title=None,
    cumsum=False,
    ncol=4,
    same_y=True,
    all_xticks=False,
    xcat_grid=False,
)
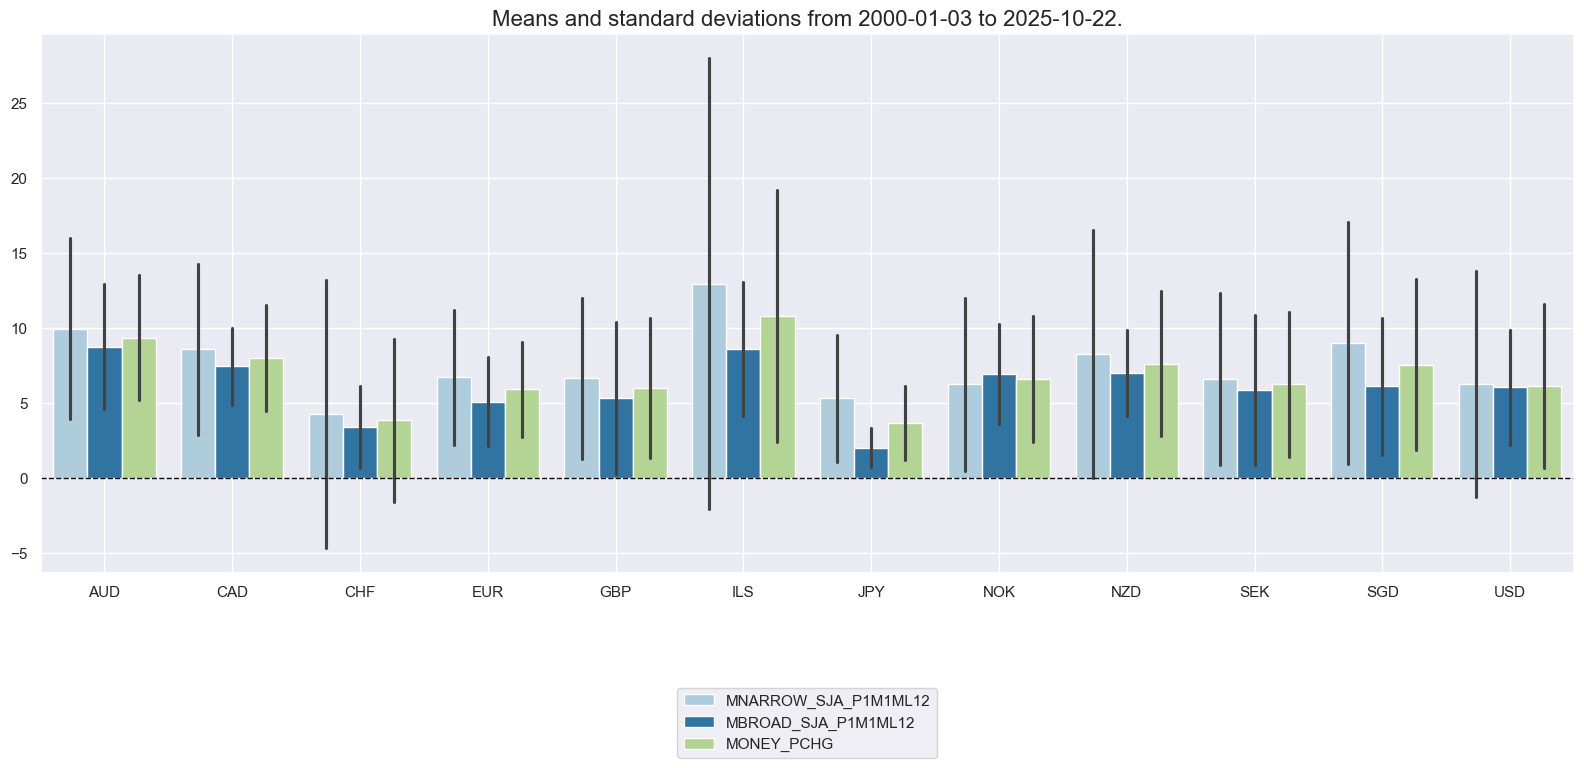
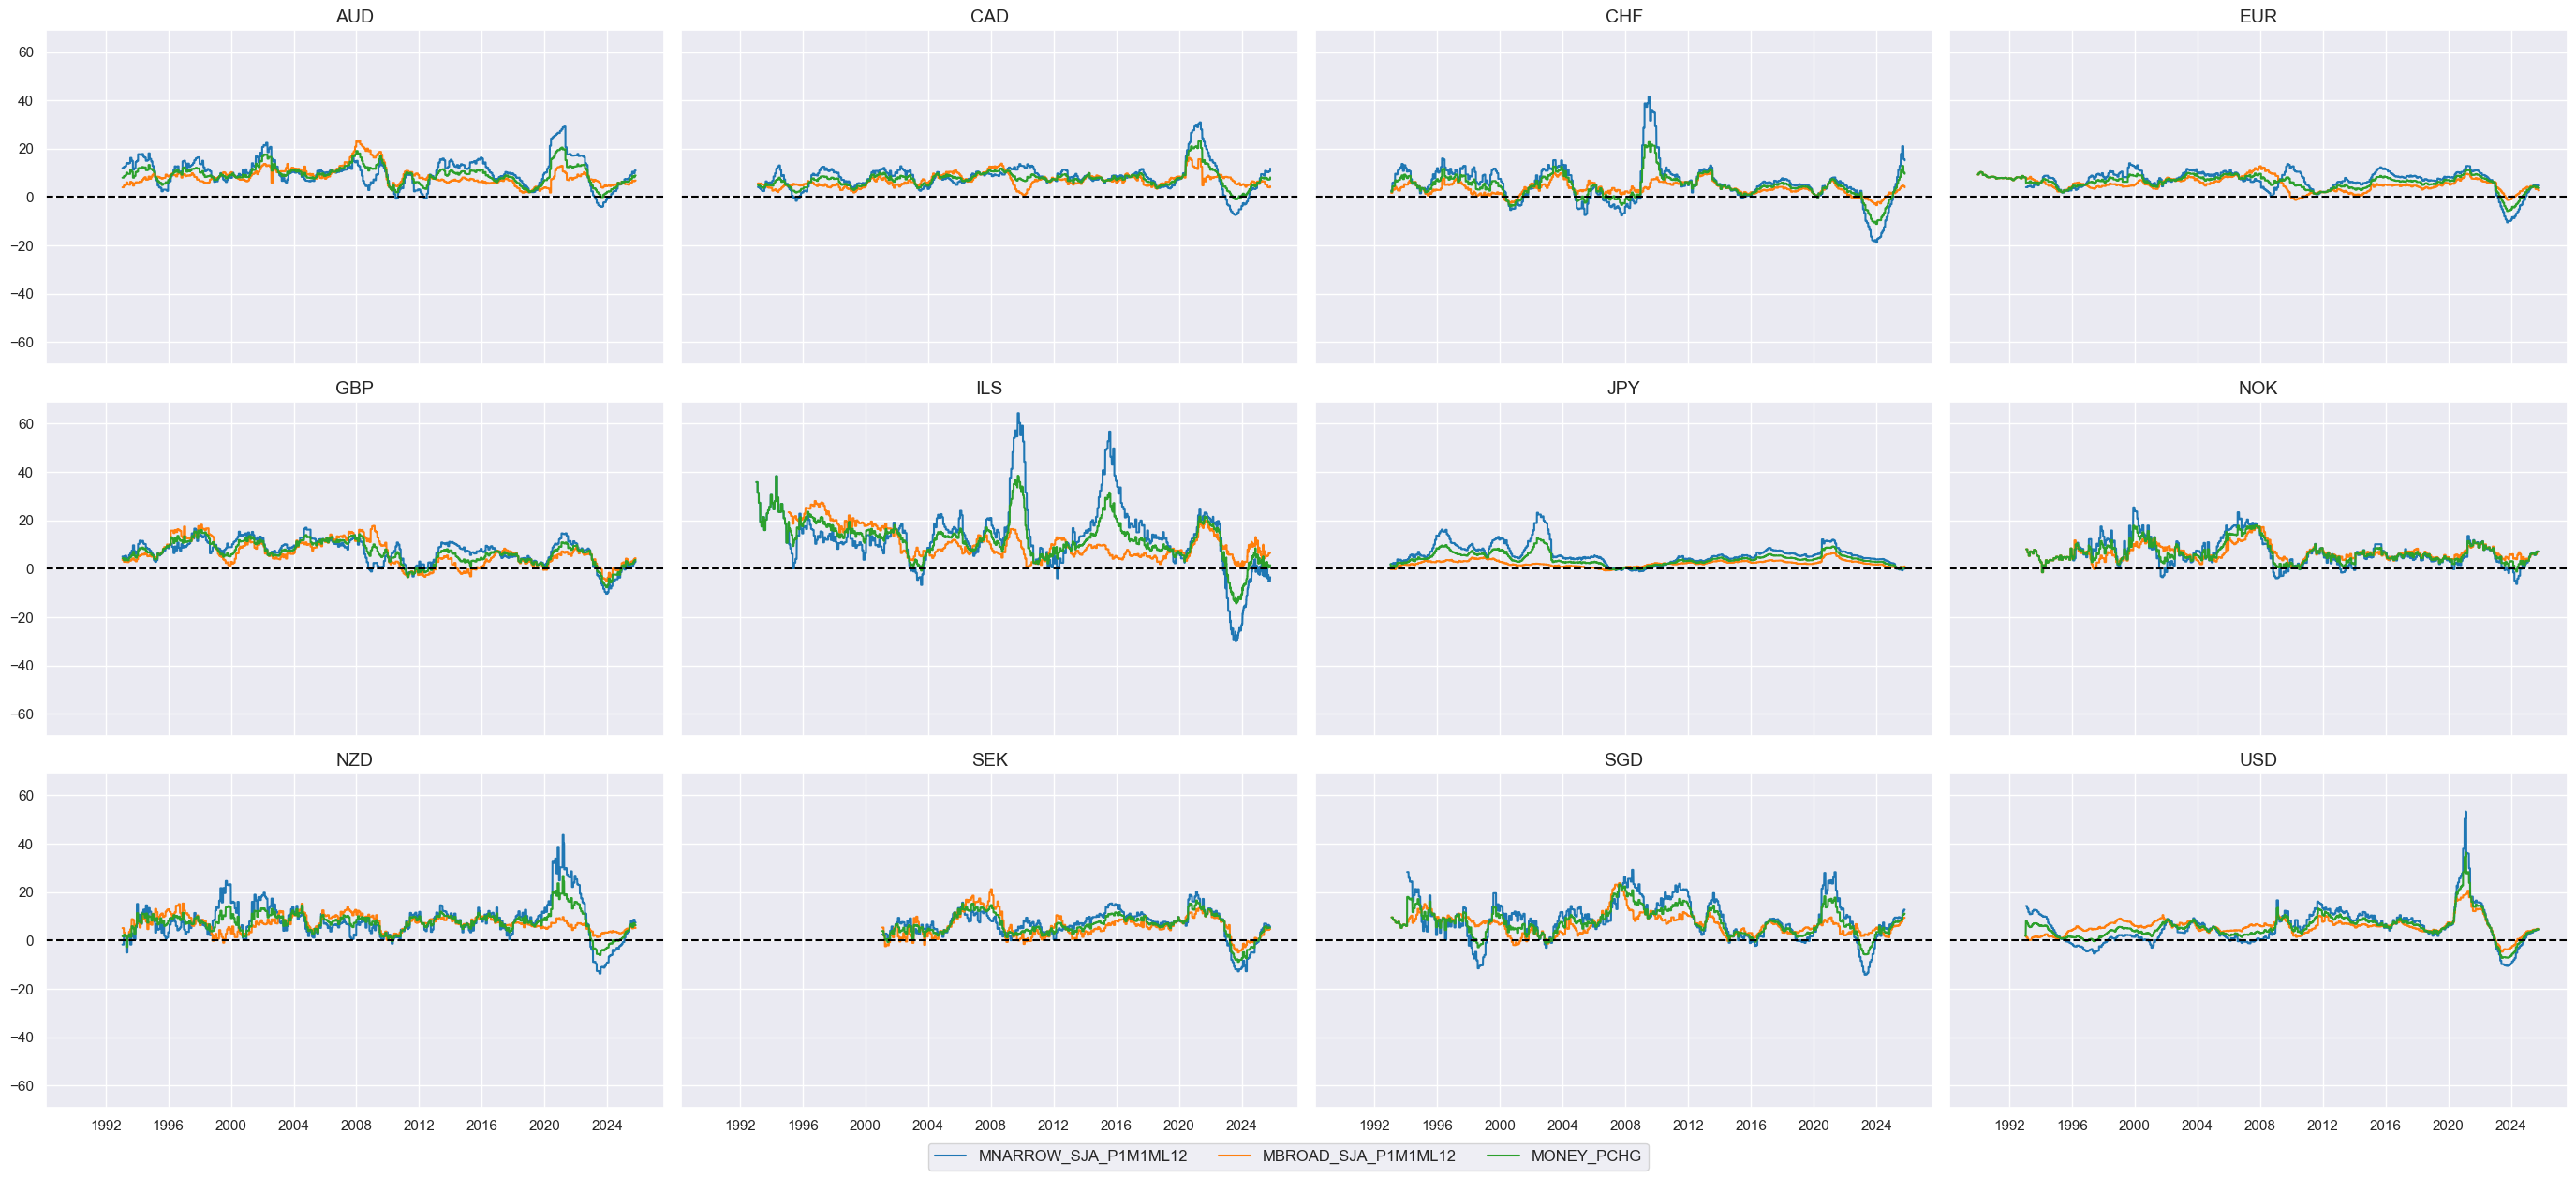
Money growth #
# Combined money growth

cidx = cids_eqx
xcatx = ecos_groups["MONEY_PCHG"]


macro_cat = "MONEY_PCHG"
combined_macro[macro_cat] = xcatx  # update summary dictionary

# combining the single indicators into a group-level indicator
dfa = msp.linear_composite(
    df=dfx,
    xcats=xcatx,
    cids=cidx,
    complete_xcats=False,
    new_xcat=macro_cat,
)
dfx = msm.update_df(dfx, dfa)
cidx = cids_eqx
xcatx = combined_macro["MONEY_PCHG"] + ["MONEY_PCHG"]

msp.view_ranges(
    dfx,
    xcats=xcatx,
    cids=cidx,
    start="2000-01-01",
    kind="bar",
)

msp.view_timelines(
    dfx,
    xcats=xcatx,
    cids=cidx,
    title=None,
    cumsum=False,
    ncol=4,
    same_y=True,
    all_xticks=False,
    xcat_grid=False,
)
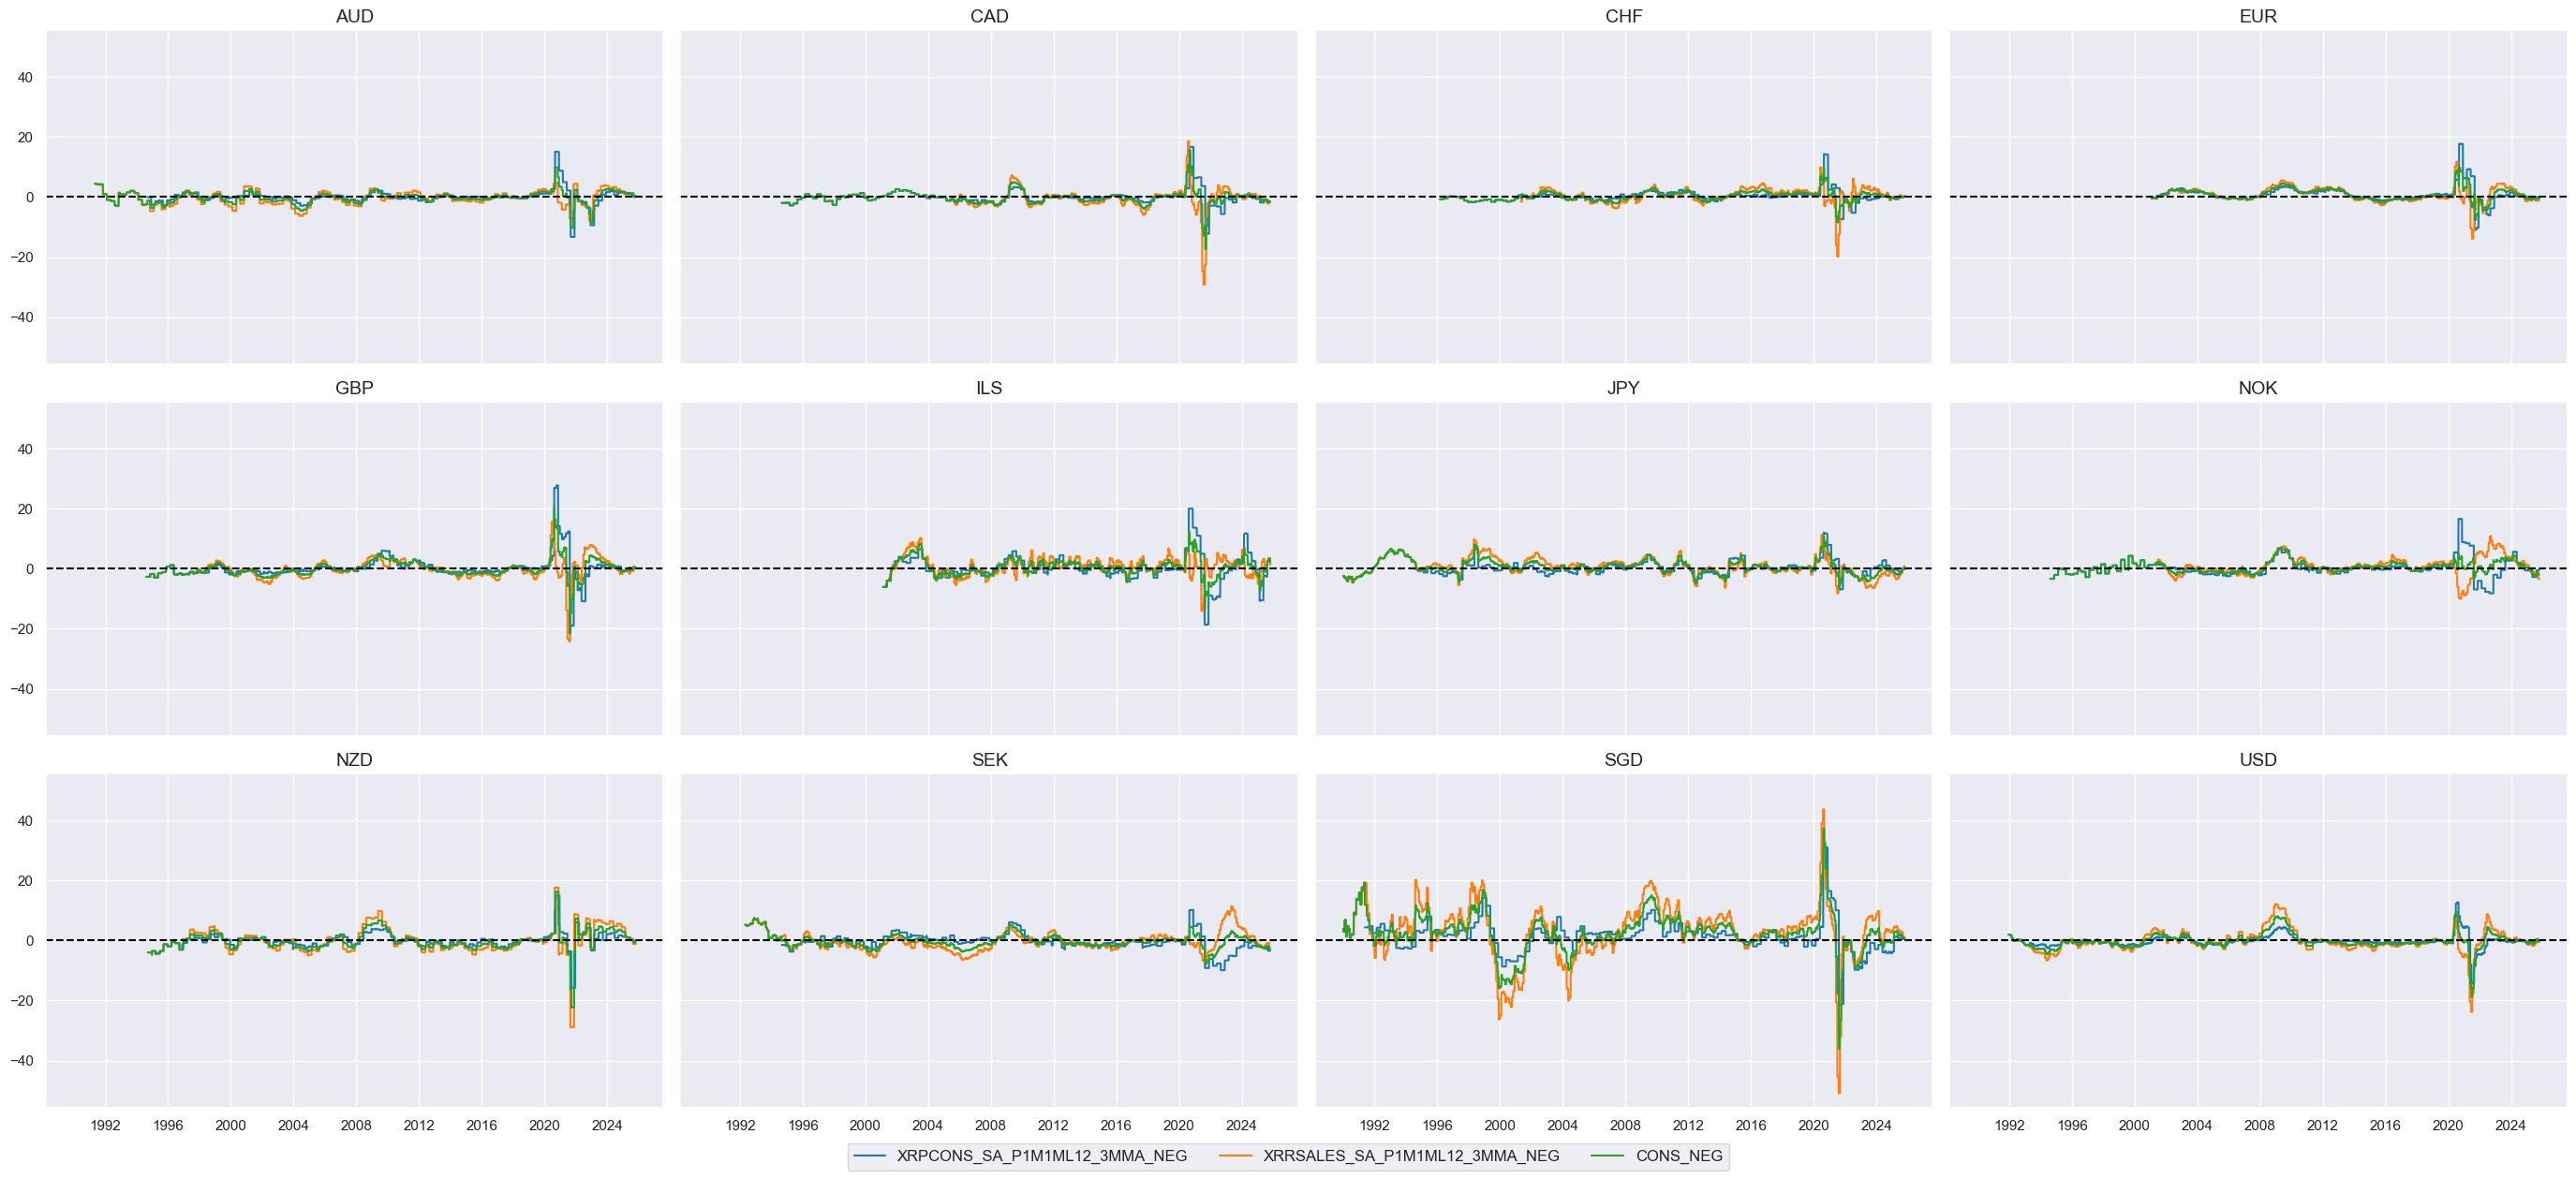
Excess private consumption growth #
con_calcs = {
    "XRPCONS_SA_P1M1ML12_3MMA_NEG": "- RPCONS_SA_P1M1ML12_3MMA + RGDP_SA_P1Q1QL4_20QMM",
    "XRRSALES_SA_P1M1ML12_3MMA_NEG": "- RRSALES_SA_P1M1ML12_3MMA + RGDP_SA_P1Q1QL4_20QMM",
}
dfa = msp.panel_calculator(
    dfx,
    calcs=[" = ".join([k, v]) for k, v in con_calcs.items()],
    cids=cids
)

dfx = msm.update_df(dfx, dfa)
# Combined confidence increase indicator

cidx = cids_eqx
xcatx = list(con_calcs.keys())


macro_cat = "CONS_NEG"
combined_macro[macro_cat] = xcatx  # update summary dictionary

# combining the single indicators into a group-level indicator
dfa = msp.linear_composite(
    df=dfx,
    xcats=xcatx,
    cids=cidx,
    complete_xcats=False,
    new_xcat=macro_cat,
)
dfx = msm.update_df(dfx, dfa)
cidx = cids_eqx
xcatx = combined_macro["CONS_NEG"] + ["CONS_NEG"]

msp.view_ranges(
    dfx,
    xcats=xcatx,
    cids=cidx,
    start="2000-01-01",
    kind="bar",
)

msp.view_timelines(
    dfx,
    xcats=xcatx,
    cids=cidx,
    title=None,
    cumsum=False,
    ncol=4,
    same_y=True,
    all_xticks=False,
    xcat_grid=False,
)

Directional factors with imputations #
xcatx = [x for x in combined_macro.keys()]
msm.check_availability(dfx, xcats=xcatx, cids=cids_eqx, missing_recent=False)

# Set parameters
impute_missing_cids = True
min_ratio_cids = 0.5

cidx = cids_eqx
# Impute cross-sectional values if majority of cross sections are available
macro_xcatx = [x for x in combined_macro.keys()]
# Exclude categories than cannot logically be imputed
non_imputables = []
imputables = list(set(macro_xcatx) - set(non_imputables))

if impute_missing_cids:

    general_imputer = MeanPanelImputer(
        df=dfx,
        xcats=xcatx,
        cids=cidx,
        start="1990-01-01",
        end=dfx.real_date.max().strftime("%Y-%m-%d"),
        min_cids=round(min_ratio_cids * len(cidx)),
        postfix="", # keeping the same category names
    )
    df_imputed = general_imputer.impute()
    dfx = msm.update_df(dfx, df_imputed)
macro_xcatx = [x for x in combined_macro.keys()]
msm.check_availability(dfx, xcats=macro_xcatx, cids=cids_eqx, missing_recent=False)
Standardized relative factors #
xcatx = [x for x in combined_macro.keys()]
cidx = cids_eqx

dfa = pd.DataFrame(columns=dfx.columns)
for xcat in xcatx:
    dfaa = msp.make_relative_value(
        dfx,
        xcats=xcatx,
        cids=cidx,
        start="1990-01-01",
        rel_meth="subtract",
        postfix="vGLB",
        blacklist=None
    )
    dfa = msm.update_df(dfa, dfaa)

dfx = msm.update_df(dfx, dfa)

relative_factors = list(dfa['xcat'].unique())
xcatx = relative_factors
cidx = cids_eqx

dfa = pd.DataFrame(columns=dfx.columns)
for xcat in xcatx:
    dfaa = msp.make_zn_scores(
        dfx,
        xcat=xcat,
        cids=cidx,
        sequential=True,
        min_obs=261 * 3,
        neutral="zero",
        pan_weight=1,
        thresh=3,
        postfix="_ZN",
        est_freq="m",
        blacklist=None
    )
    dfa = msm.update_df(dfa, dfaa)

dfx = msm.update_df(dfx, dfa)

rn_factors = list(dfa['xcat'].unique())
# Labelling dictionary

rnf_labels = {
    "XINF_NEGvGLB_ZN": "Relative inflation shortfall",
    "LAB_SLACKvGLB_ZN": "Relative labour market slack",
    "FX_DEPRECvGLB_ZN": "Relative FX depreciation",
    "EASE_FINvGLB_ZN": "Relative real rates conditions",
    "CTOT_PCHvGLB_ZN": "Relative terms-of-trade changes",
    "MCONF_CHGvGLB_ZN": "Relative industry confidence change",
    "MTB_CHGvGLB_ZN": "Relative trade balance change",
    "MONEY_PCHGvGLB_ZN": "Relative money growth",
    "CONS_NEGvGLB_ZN": "Relative consumption shortfall",
}
cidx = cids_eqx
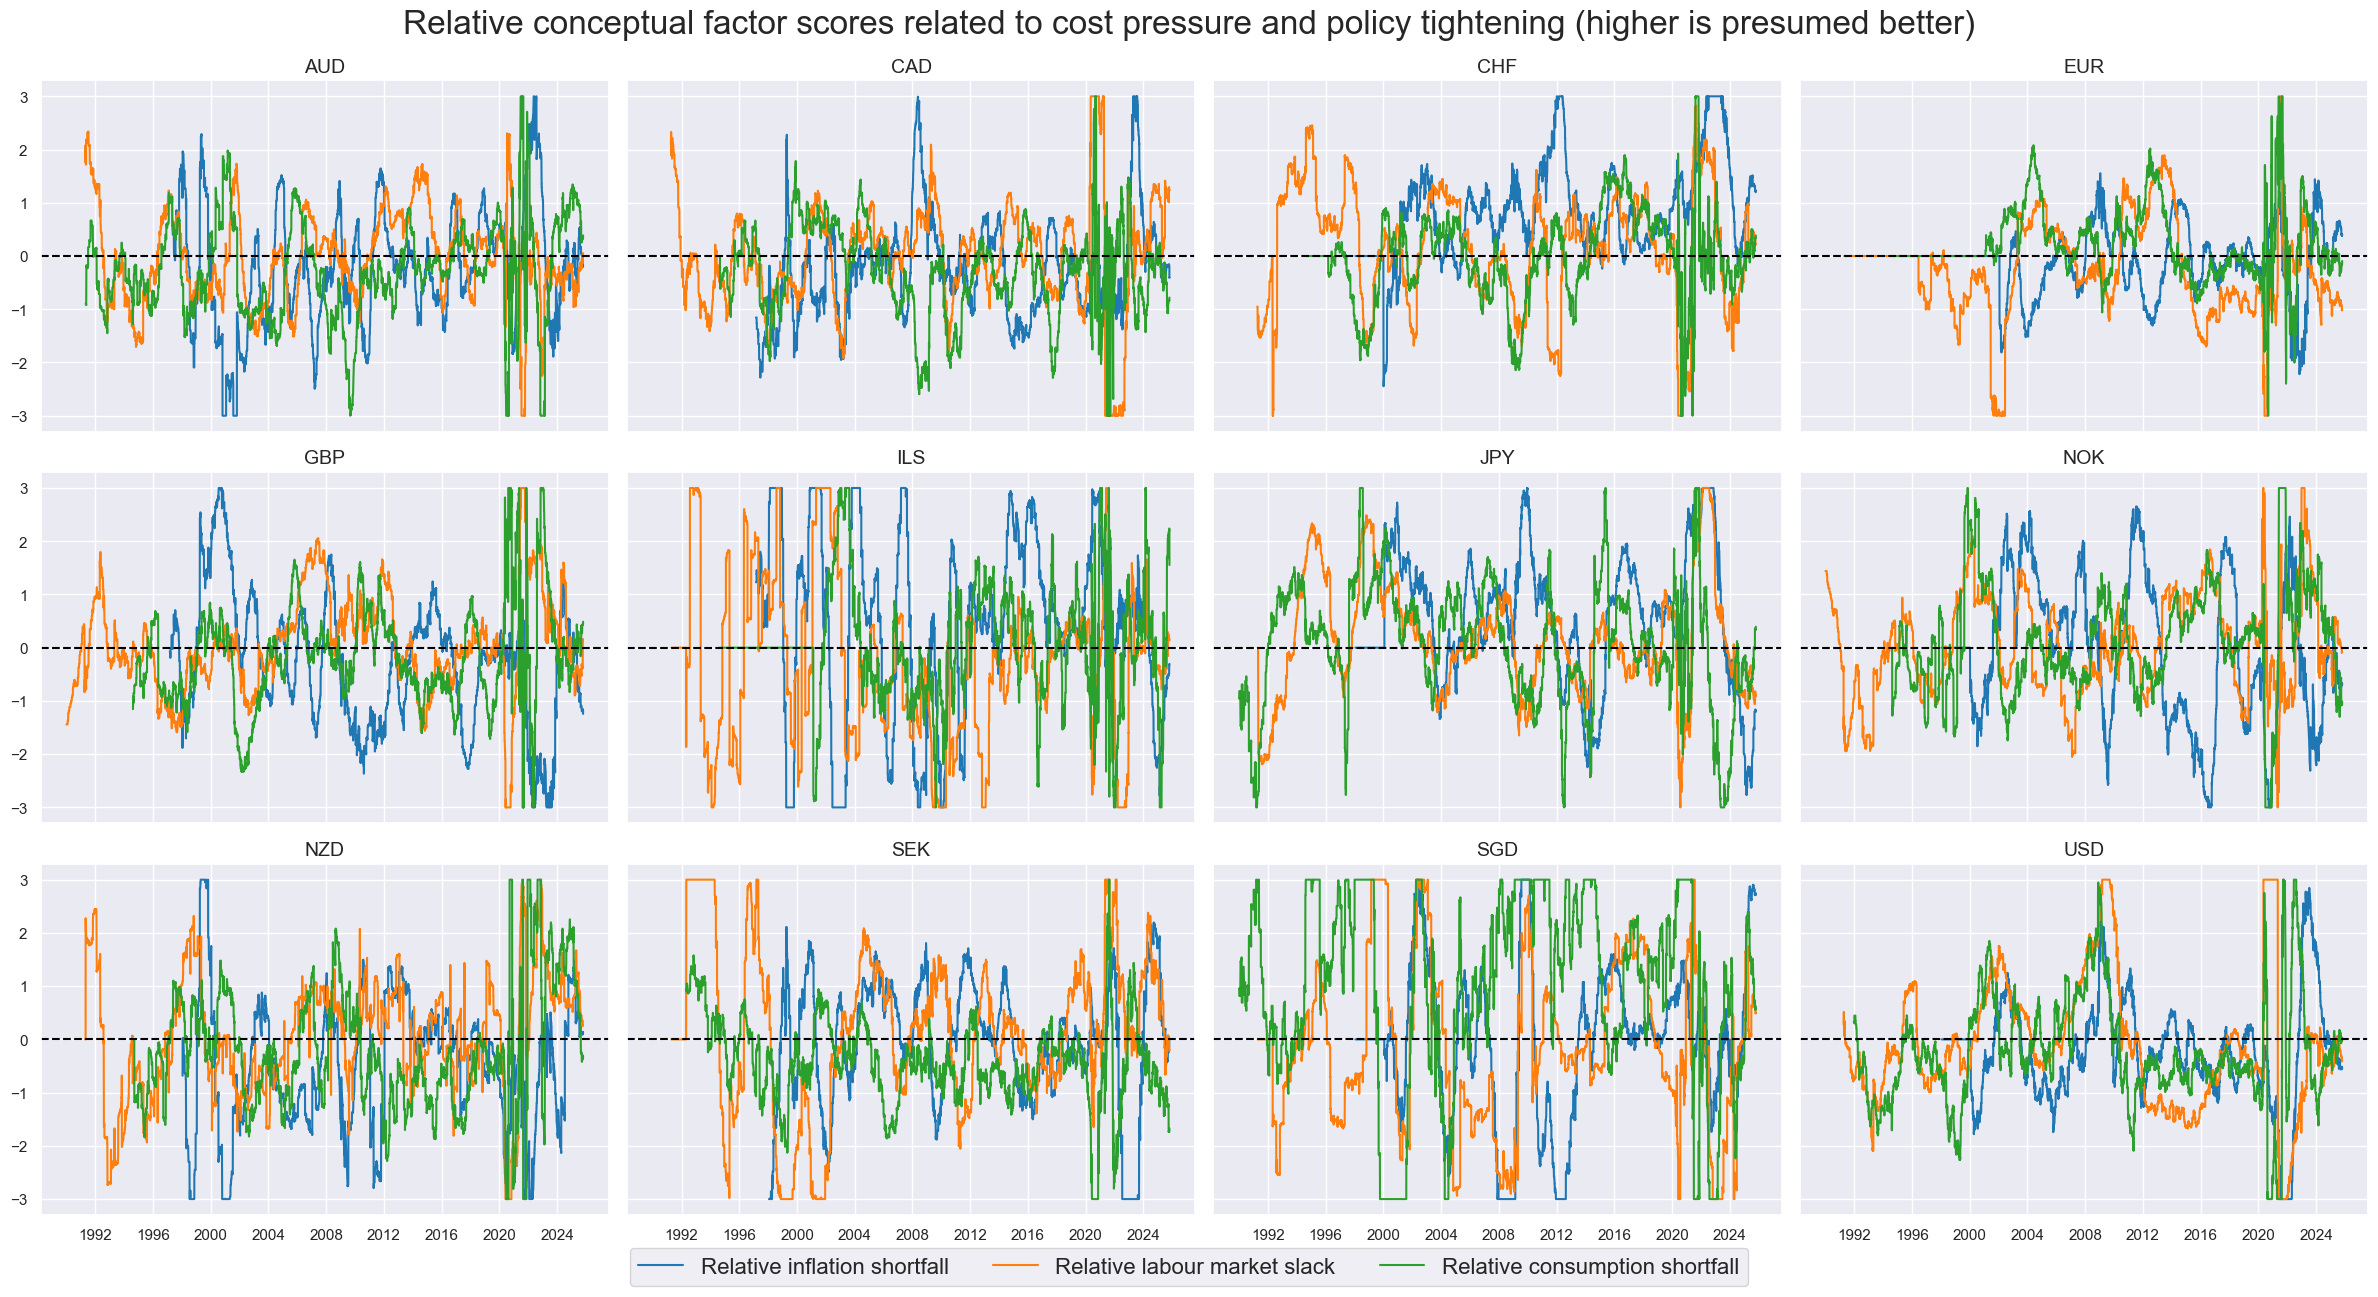
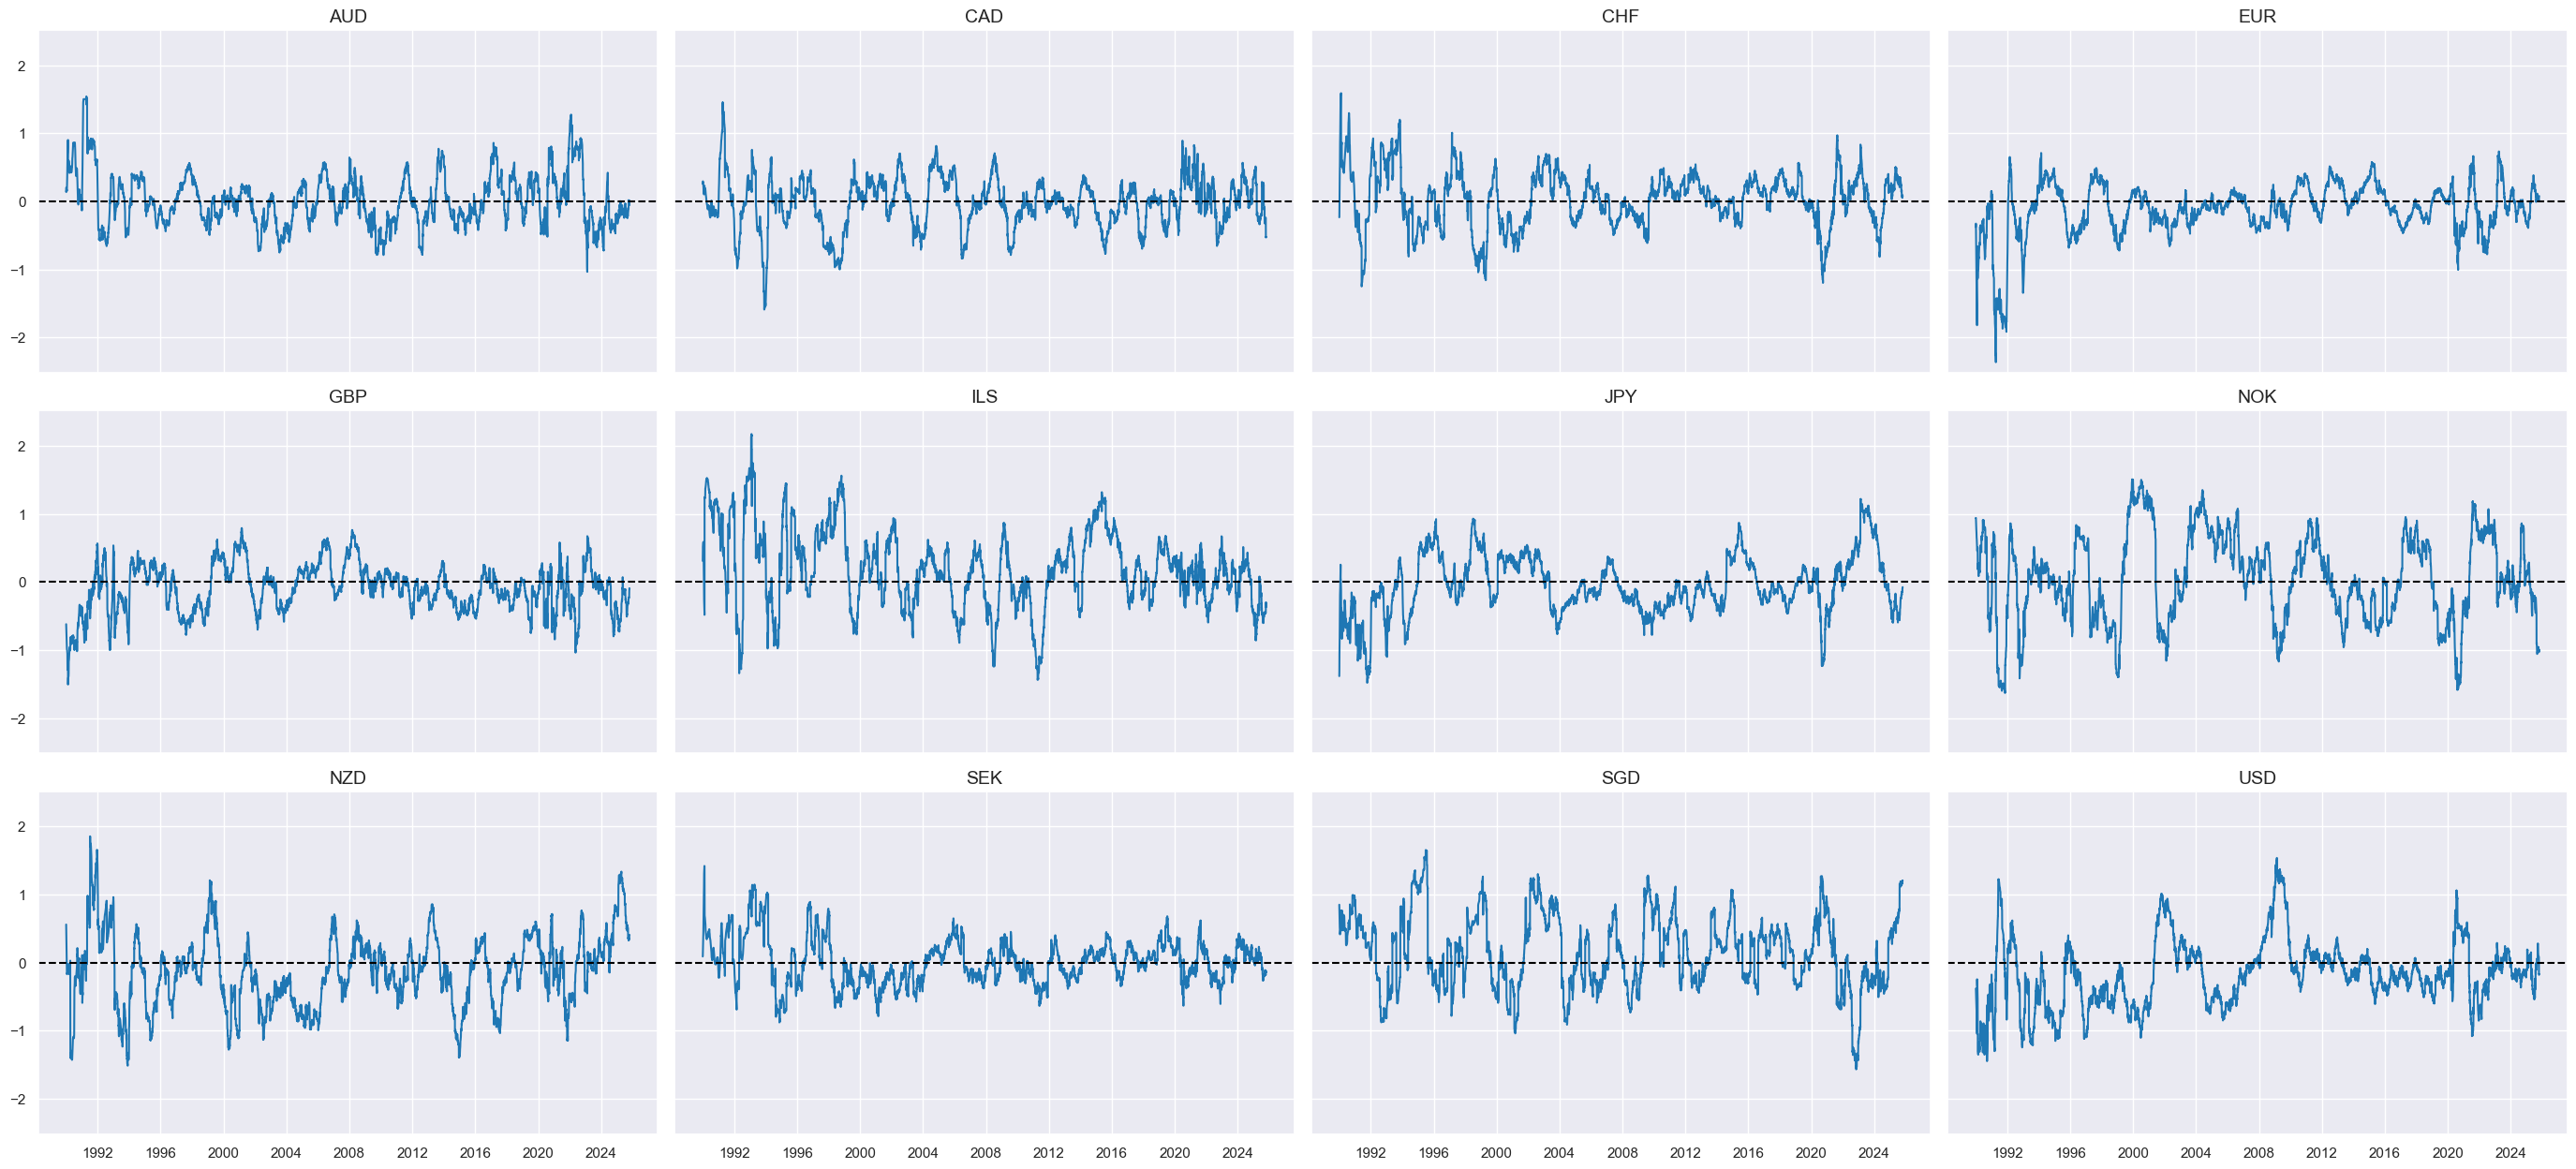
xcatx = ["XINF_NEGvGLB_ZN", "LAB_SLACKvGLB_ZN", "CONS_NEGvGLB_ZN"]
xcatx_labels = [rnf_labels[xc] for xc in xcatx]
msp.view_timelines(
dfx,
xcats=xcatx,
xcat_labels=xcatx_labels,
legend_fontsize=16,
cids=cidx,
title="Relative conceptual factor scores related to cost pressure and policy tightening (higher is presumed better)",
title_fontsize=24,
cumsum=False,
ncol=4,
same_y=True,
aspect=1.4,
size=(12, 7),
all_xticks=False,
xcat_grid=False,
)
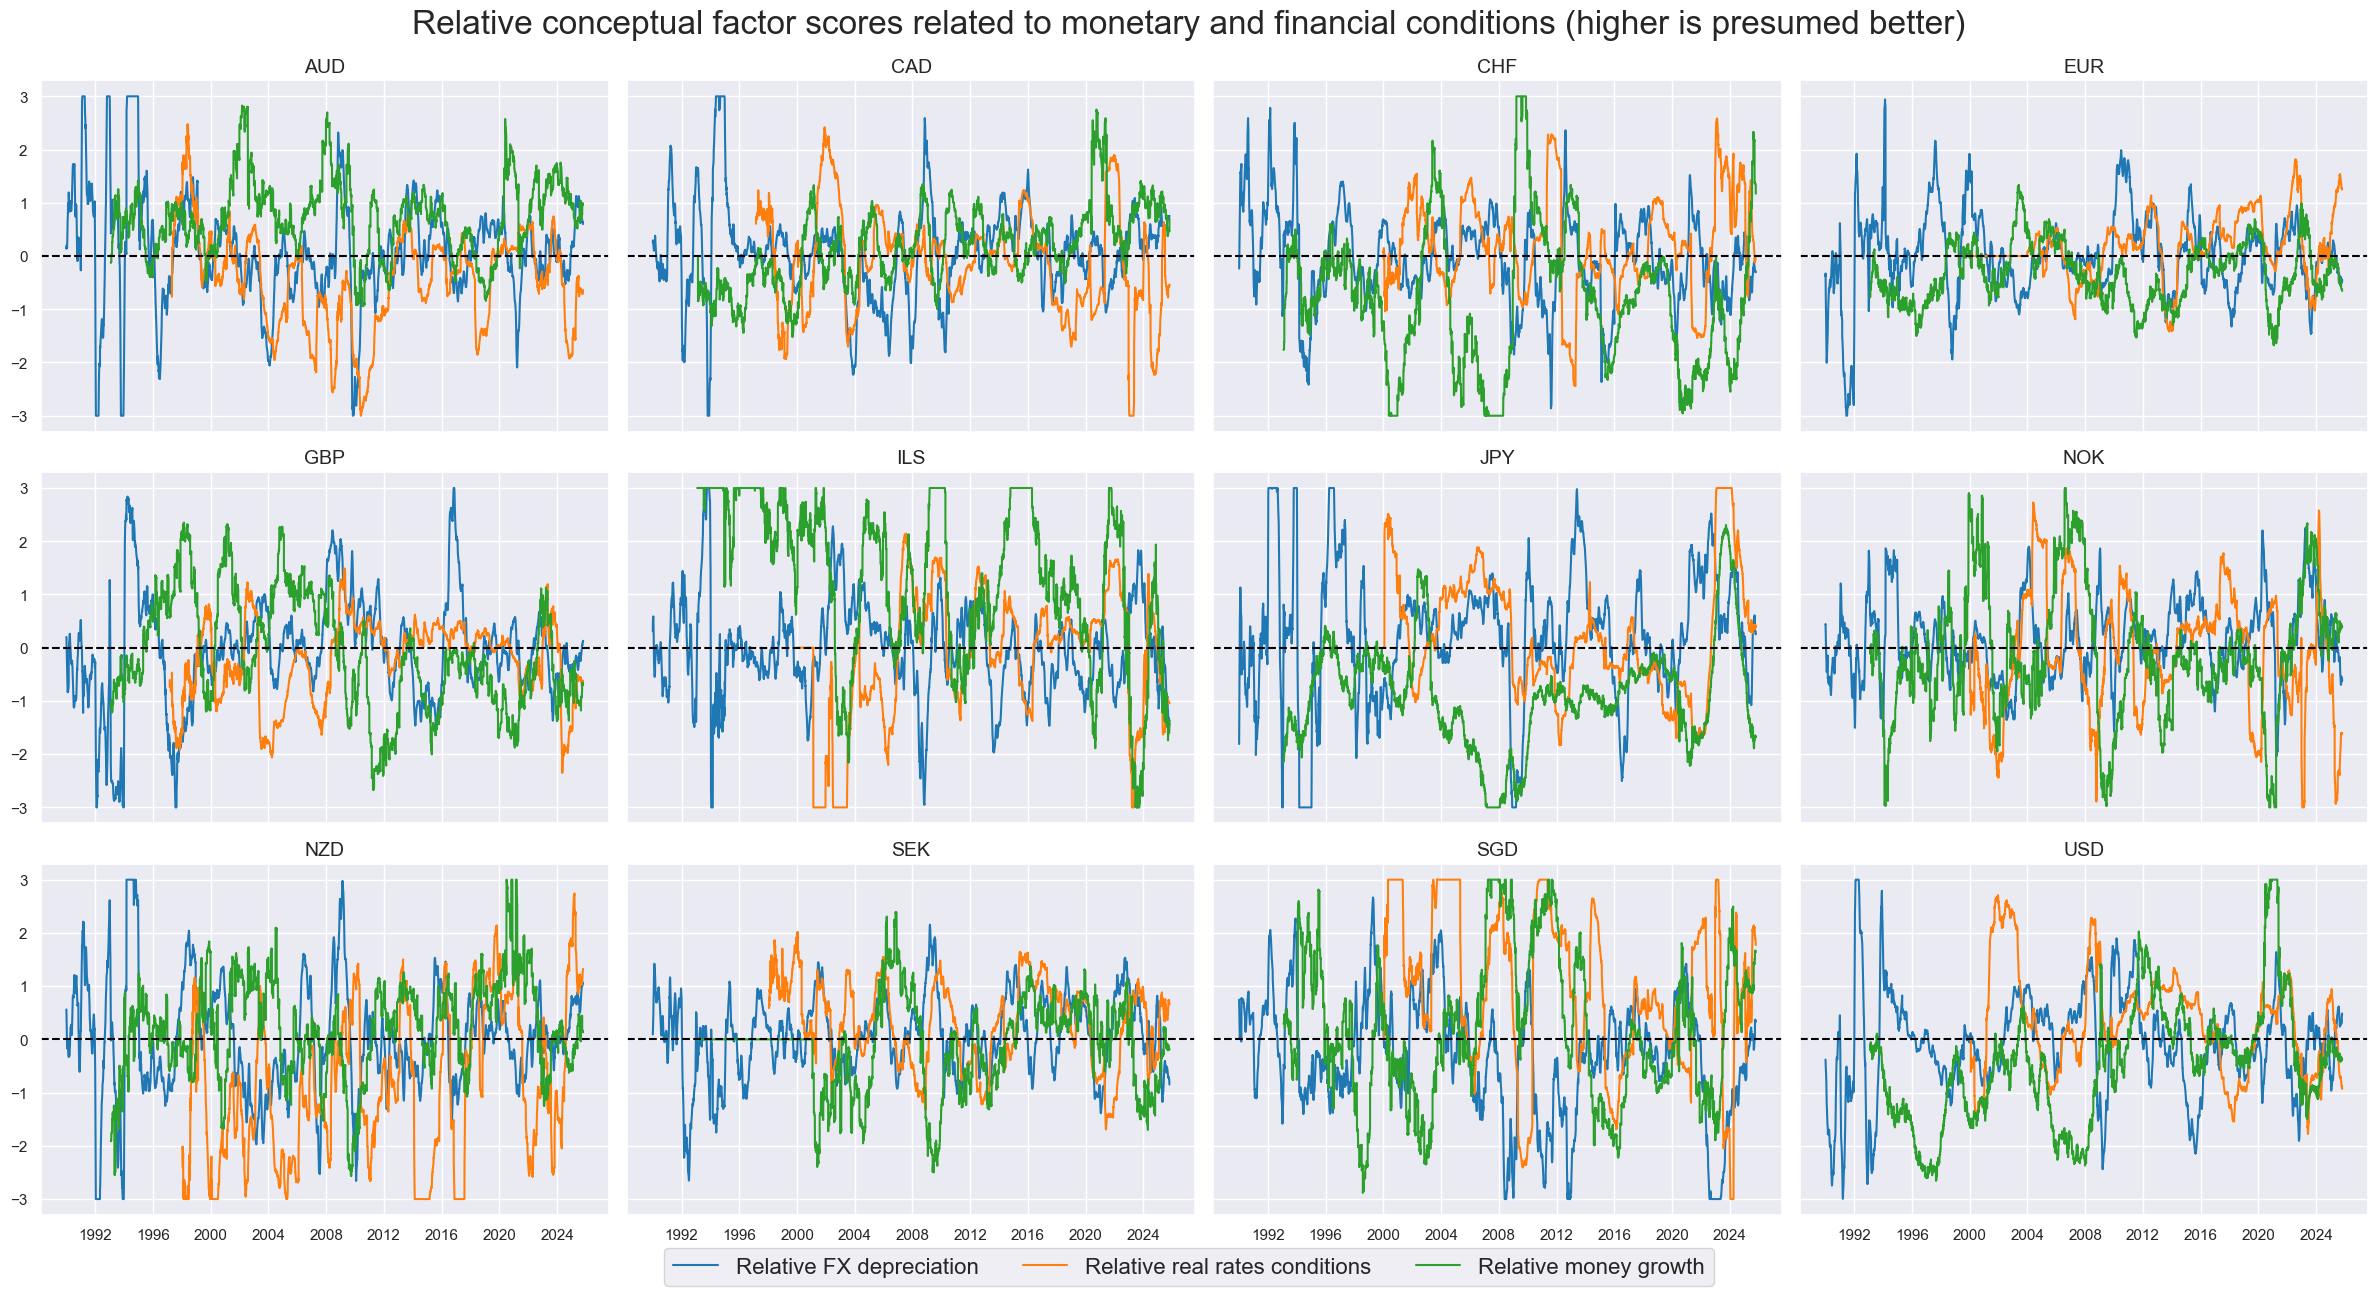
cidx = cids_eqx
xcatx =["FX_DEPRECvGLB_ZN", "EASE_FINvGLB_ZN", "MONEY_PCHGvGLB_ZN"]

xcatx_labels = [rnf_labels[xc] for xc in xcatx]

msp.view_timelines(
    dfx,
    xcats=xcatx,
    xcat_labels=xcatx_labels,
    legend_fontsize=16,
    cids=cidx,
    title="Relative conceptual factor scores related to monetary and financial conditions (higher is presumed better)",
    title_fontsize=24,
    cumsum=False,
    ncol=4,
    same_y=True,
    aspect=1.4,
    size=(12, 7),
    all_xticks=False,
    xcat_grid=False,
)
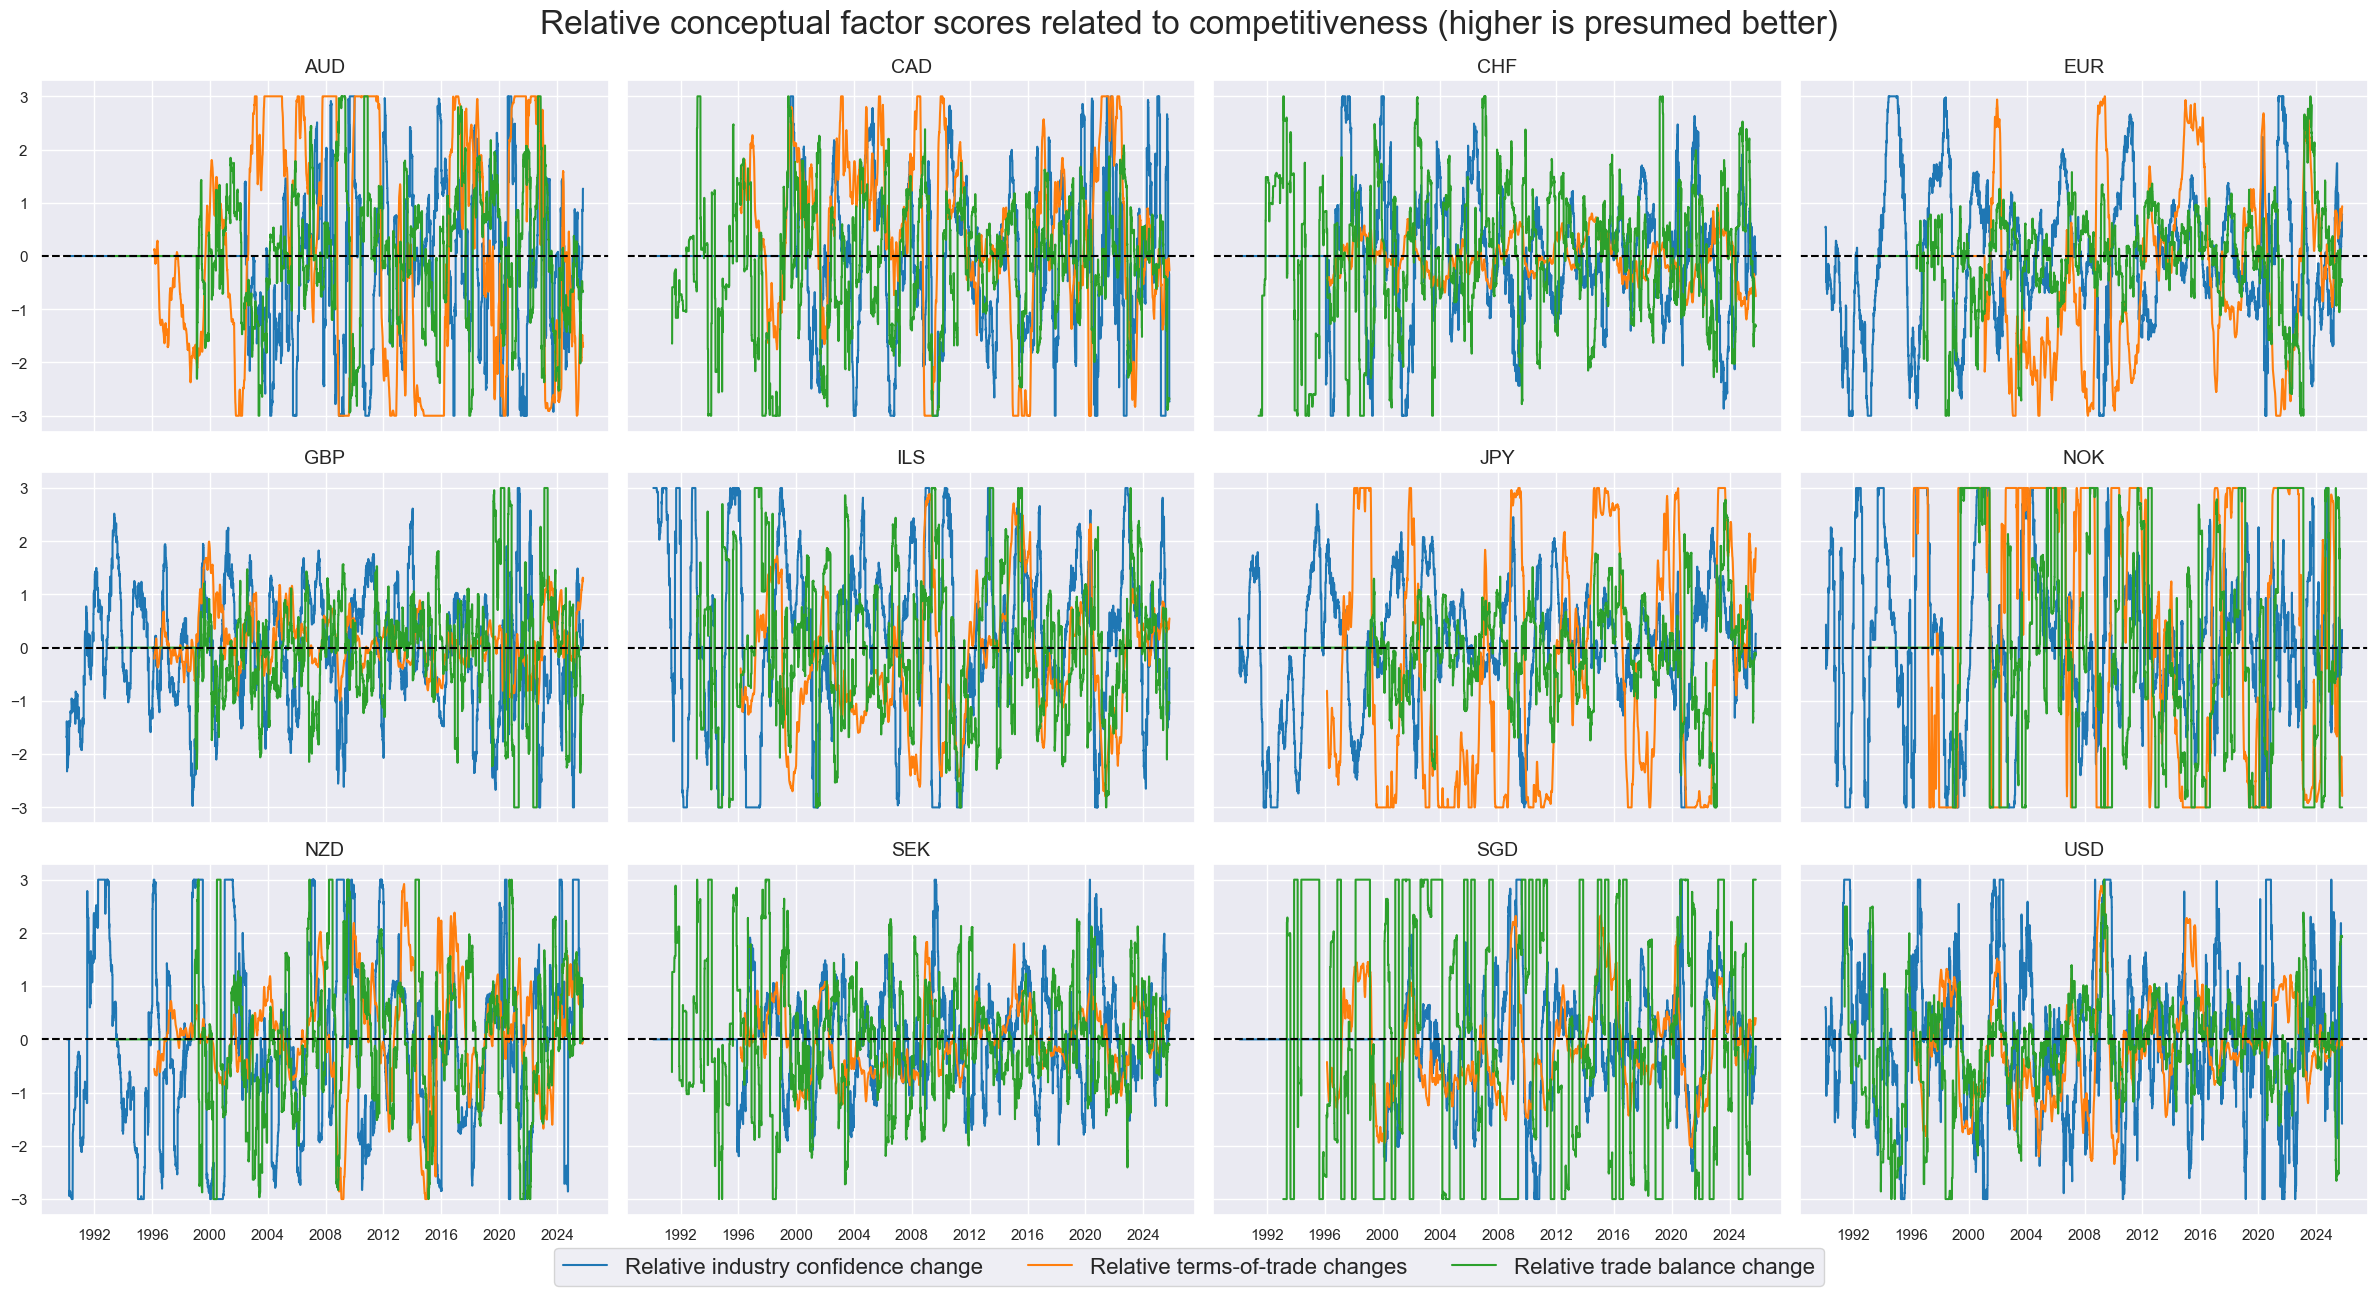
cidx = cids_eqx
xcatx =["MCONF_CHGvGLB_ZN", "CTOT_PCHvGLB_ZN", "MTB_CHGvGLB_ZN"]

xcatx_labels = [rnf_labels[xc] for xc in xcatx]

msp.view_timelines(
    dfx,
    xcats=xcatx,
    xcat_labels=xcatx_labels,
    legend_fontsize=16,
    cids=cidx,
    title="Relative conceptual factor scores related to competitiveness (higher is presumed better)",
    title_fontsize=24,
    cumsum=False,
    ncol=4,
    same_y=True,
    aspect=1.4,
    size=(12, 7),
    all_xticks=False,
    xcat_grid=False,
)
Conceptual parity signal #
xcatx = rn_factors
cidx = cids_eqx

dfa = msp.linear_composite(
    df=dfx,
    xcats=xcatx,
    cids=cidx,
    complete_xcats=False,
    new_xcat="MACROvGLB_ZN",
)
dfx = msm.update_df(dfx, dfa)
msp.view_timelines(
    dfx,
    xcats=["MACROvGLB_ZN"],
    cids=sorted(cidx),
    title=None,
    cumsum=False,
    ncol=4,
    same_y=True,
    size=(12, 7),
    all_xticks=False,
    xcat_grid=False,
)
xcatx = rn_factors # + ["MACROvGLB_ZN"]
cidx = cids_eqx
xcatx_labels = [rnf_labels[xc][9:].capitalize() for xc in xcatx]
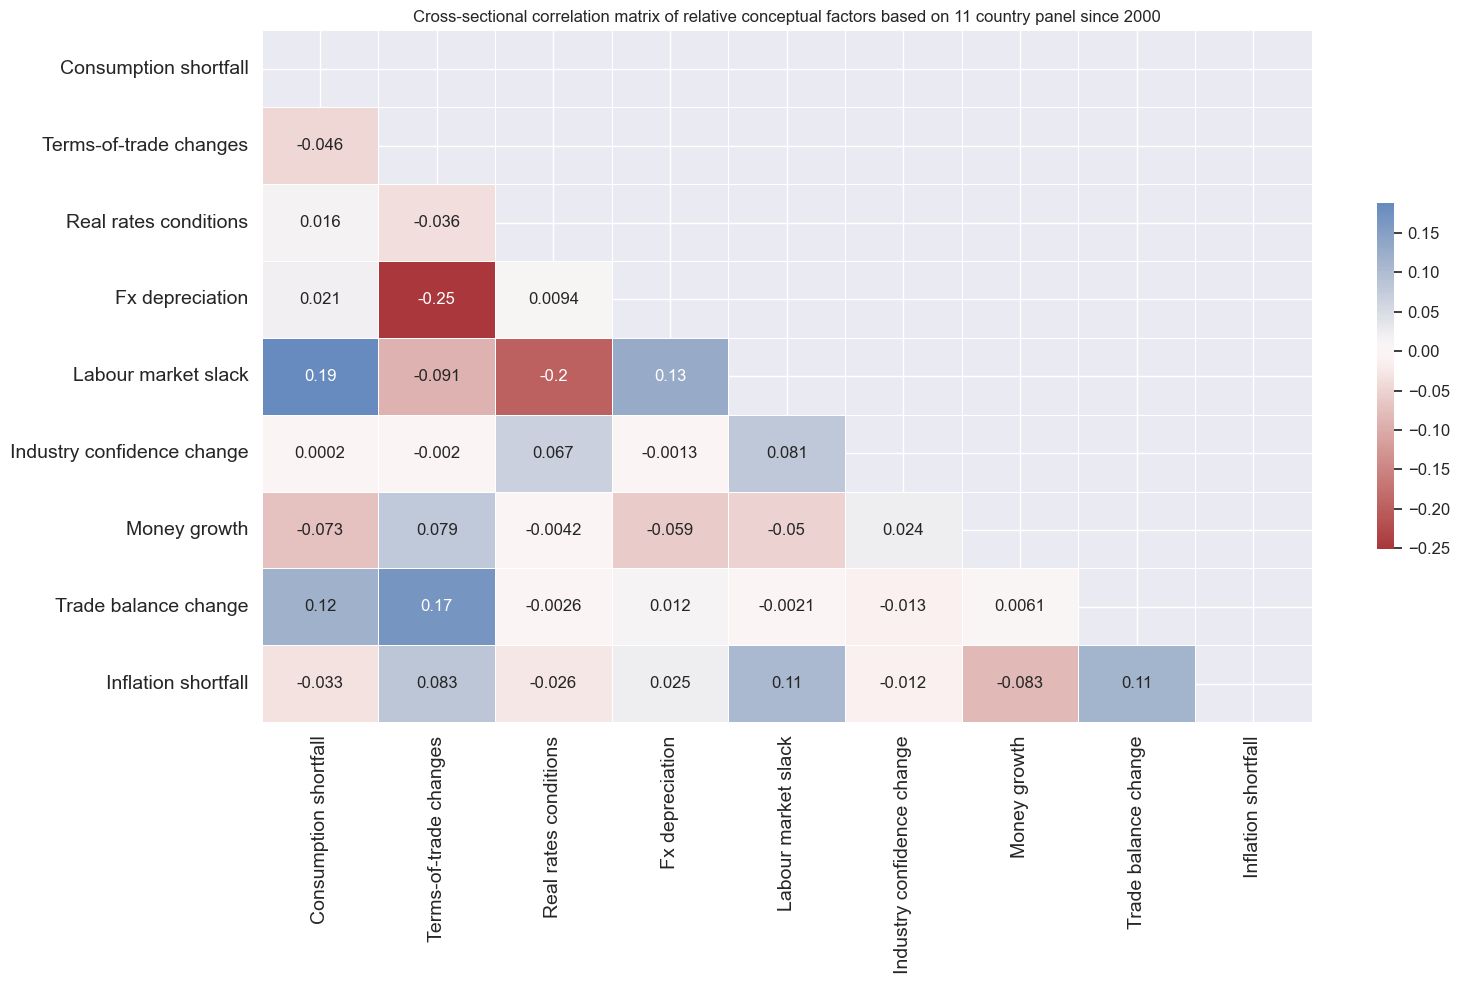
msp.correl_matrix(
dfx,
xcats=xcatx,
xcat_labels=xcatx_labels,
cids=cidx,
title="Cross-sectional correlation matrix of relative conceptual factors based on 11 country panel since 2000",
size=(16, 10),
show=True,
annot=True
)
Target: Intra-sector cross-country relative returns #
secx = secs + ["ALL"]
xcatx = [f"EQC{sec}XR_{adj}" for sec in secx for adj in ["NSA", "VT10"]]
cidx = cids_eqx

dfa = msp.make_relative_value(
    dfx,
    xcats=xcatx,
    cids=cidx,
    start="1990-01-01",
    rel_meth="subtract",
    postfix="vGLB",
)

dfx = msm.update_df(dfx, dfa)
cidx = cids_eqx
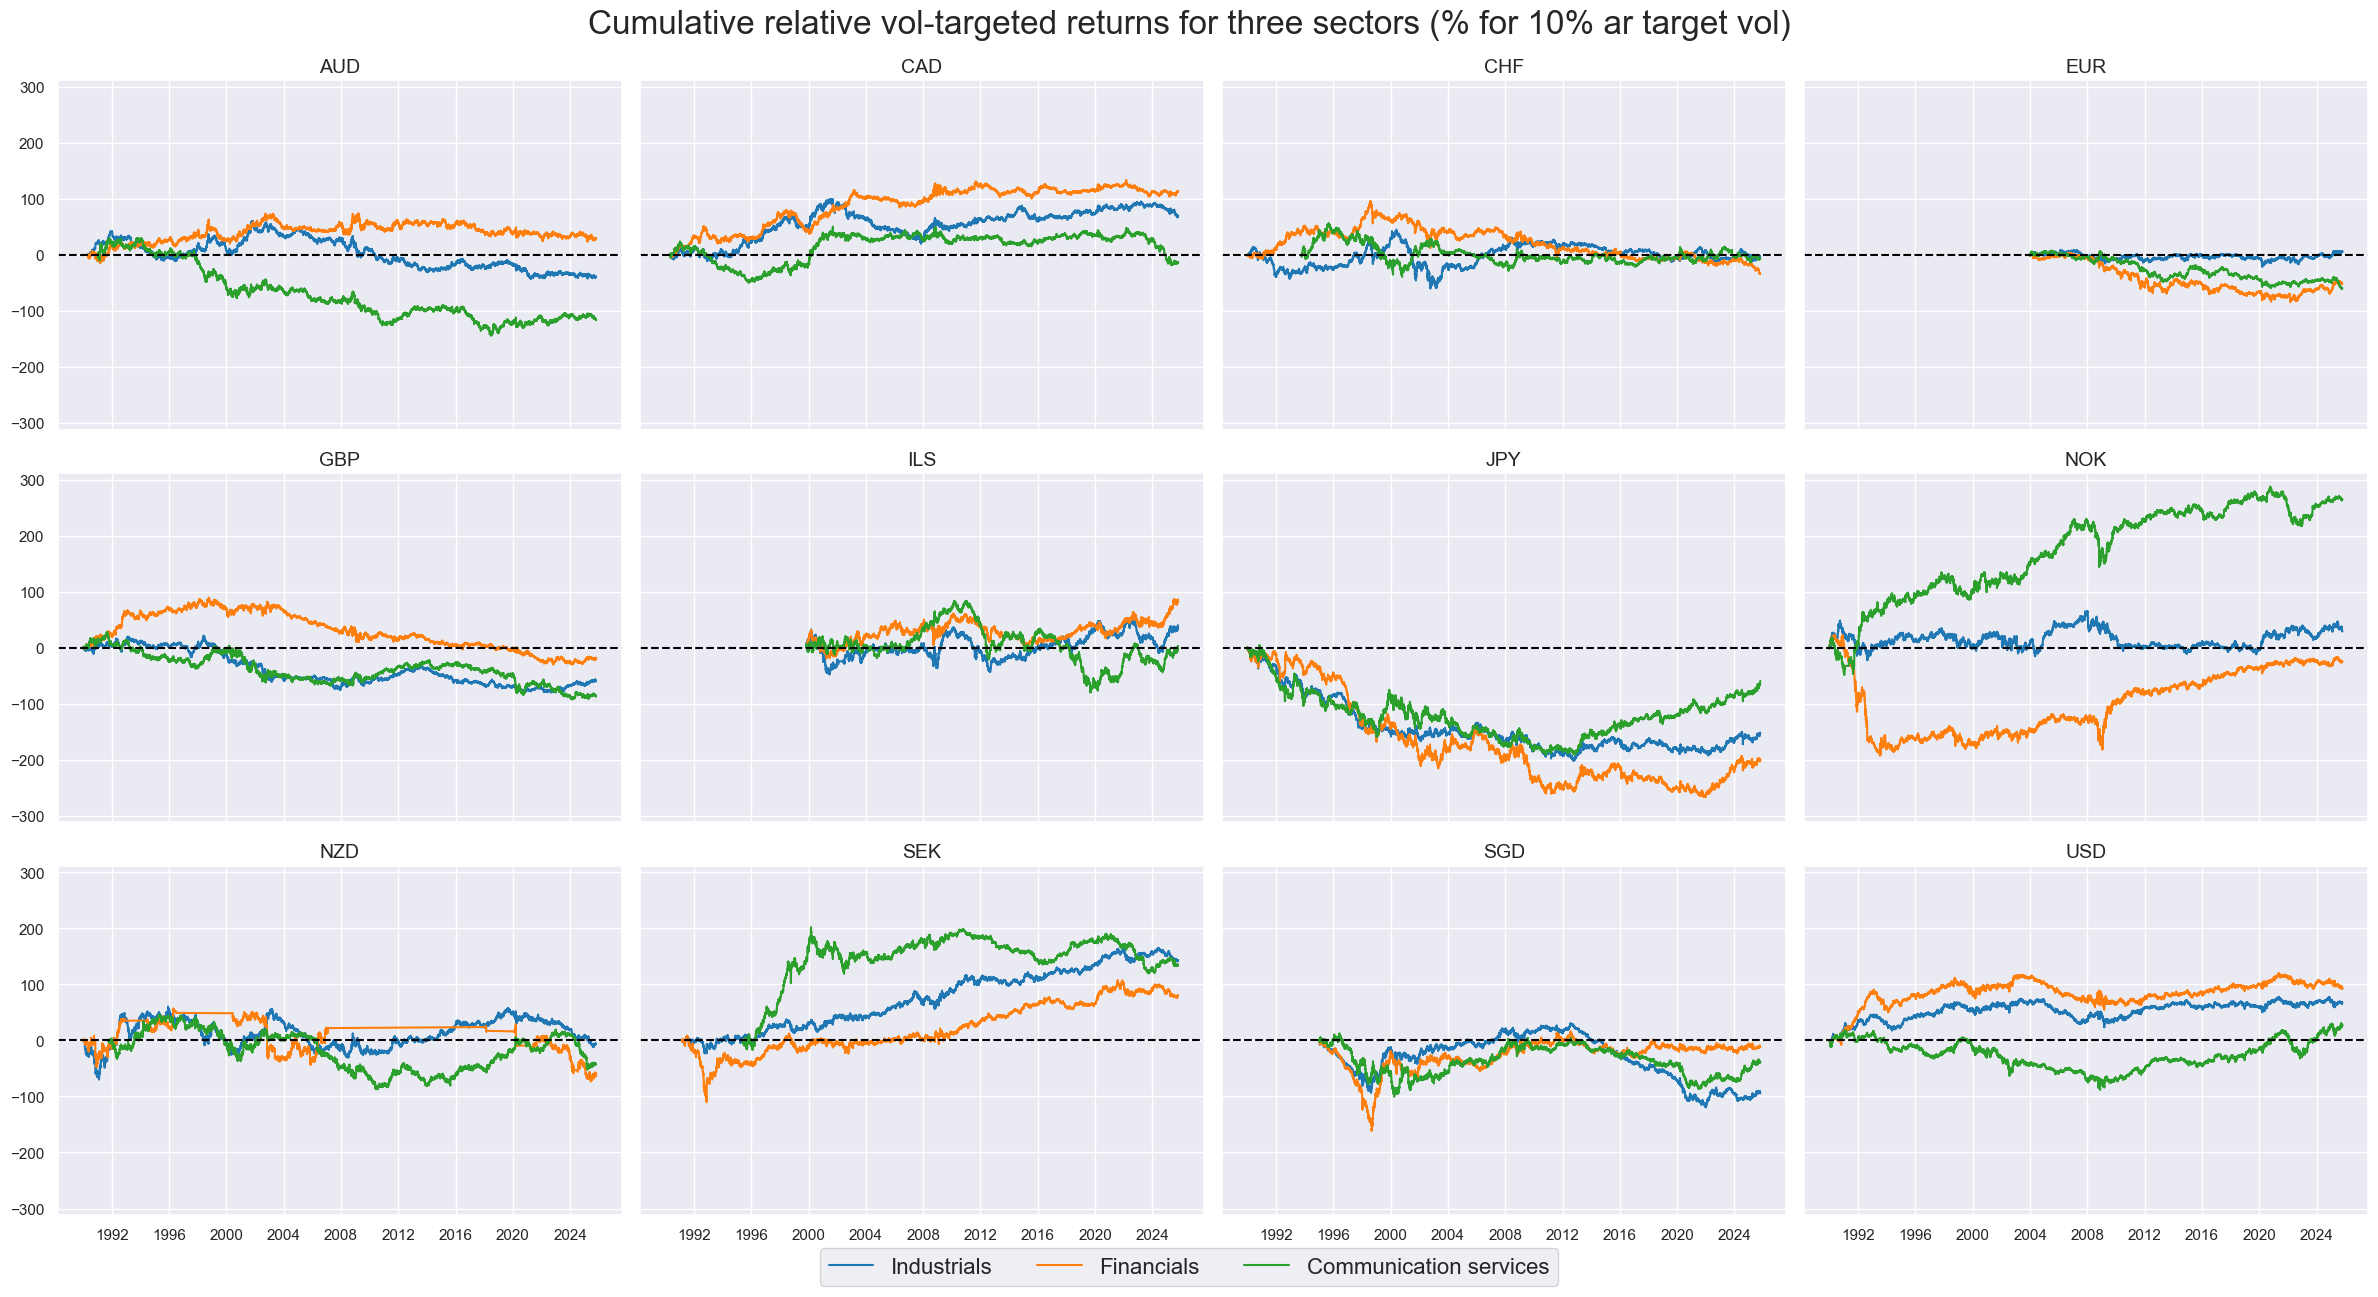
tss = ["IND", "FIN", "CSR"]
xcatx = [f"EQC{ts}XR_NSAvGLB" for ts in tss]
msp.view_timelines(
dfx,
xcats=xcatx,
xcat_labels=[sector_labels[ts] for ts in tss],
legend_fontsize=16,
cids=cidx,
title="Cumulative relative vol-targeted returns for three sectors (% for 10% ar target vol)",
title_fontsize=24,
cumsum=True,
ncol=4,
same_y=True,
aspect=1.4,
size=(12, 7),
all_xticks=False,
xcat_grid=False,
)
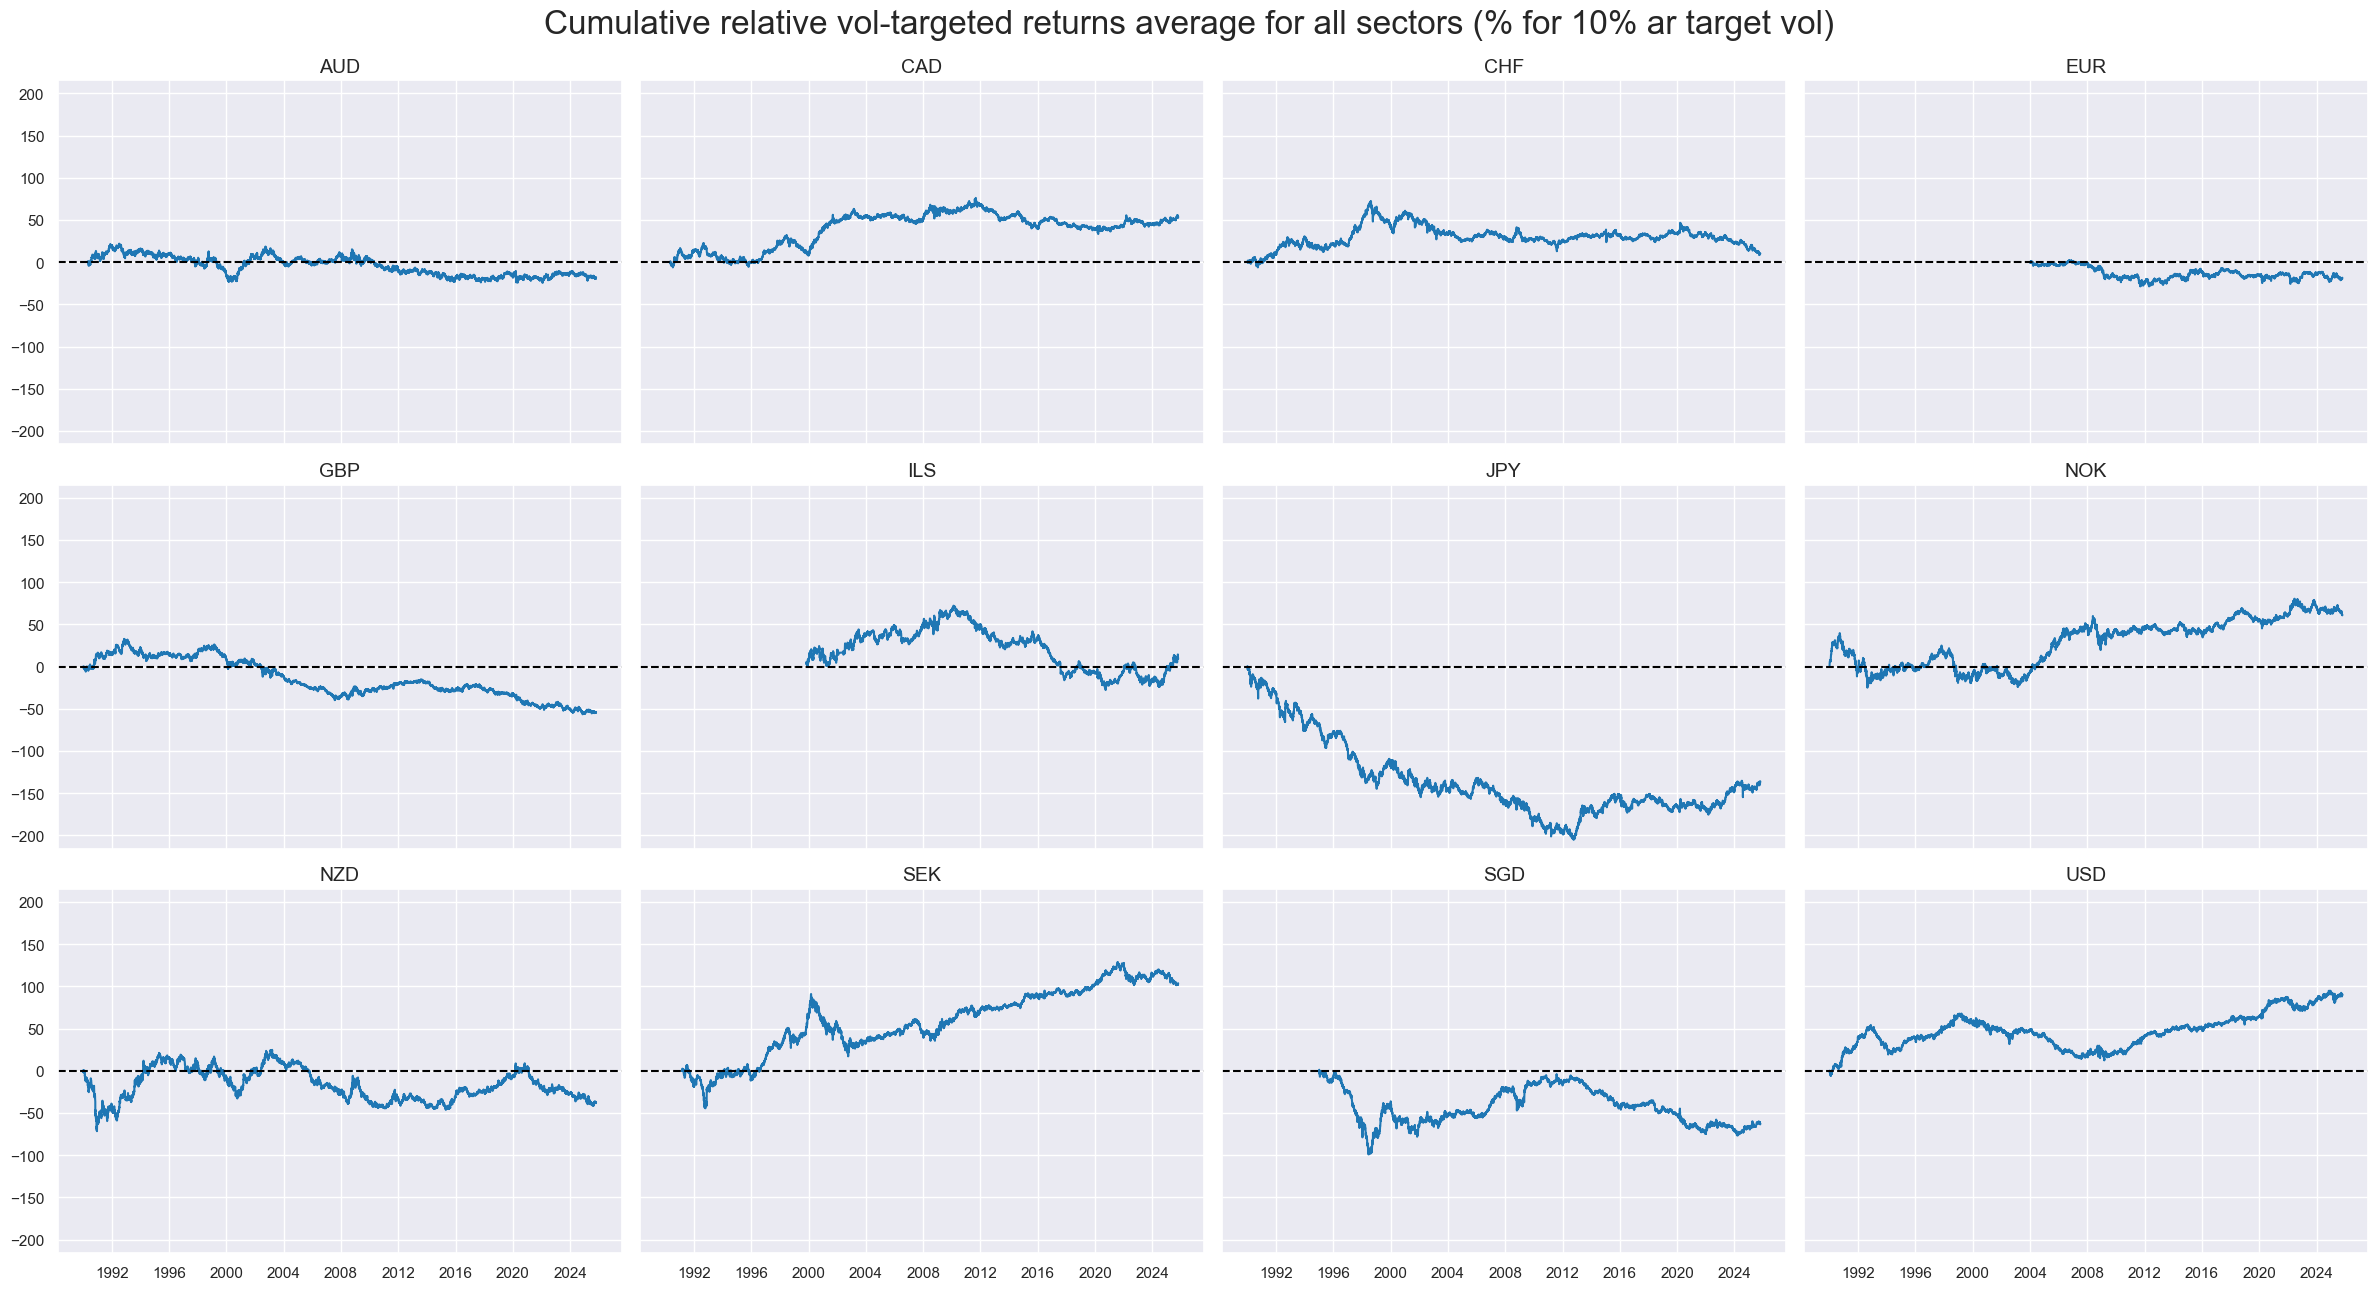
cidx = cids_eqx
xcatx = f"EQCALLXR_NSAvGLB"

msp.view_timelines(
    dfx,
    xcats=xcatx,
    legend_fontsize=16,
    cids=cidx,
    title="Cumulative relative vol-targeted returns average for all sectors (% for 10% ar target vol)",
    title_fontsize=24,
    cumsum=True,
    ncol=4,
    same_y=True,
    aspect=1.4,
    size=(12, 7),
    all_xticks=False,
    xcat_grid=False,
)
Sectoral return blacklisting #
Blacklisting is relevant when constructing the relative performance of sectoral indices across countries.
sector_blacklist = {}
for sec in secs:
    dfb = dfx[dfx["xcat"] == f"EQC{sec}UNTRADABLE_NSA"].loc[:, ["cid", "xcat", "real_date", "value"]]
    dfba = (
        dfb.groupby(["cid", "real_date"])
        .aggregate(value=pd.NamedAgg(column="value", aggfunc="max"))
        .reset_index()
    )
    dfba["xcat"] = f"EQC{sec}BLACK"

    sector_blacklist[sec] = msp.make_blacklist(dfba, f"EQC{sec}BLACK")
Value checks #
Statistical learning parameters #
default_target_type = "XR_VT10vGLB"

default_learn_config = {
    "scorer": {"negmse": make_scorer(mean_squared_error, greater_is_better=False)},
    "splitter": {"Expanding": msl.ExpandingKFoldPanelSplit(n_splits=3)},
     # retraining interval in months
    "test_size": 3,
    # minimum number of cids to start predicting
    "min_cids": 2,
    # minimum number of periods to start predicting
    "min_periods": 24,
    "split_functions": {"Expanding": lambda n: n // 24}
}
# List of dictionaries for two learning pipelines

learning_models = [
    {
        "ols": Pipeline(
          [
              ("predictor", msl.ModifiedLinearRegression(method = "analytic", fit_intercept=False)),
          ]
        ),
        "twls": Pipeline(
          [
              ("predictor", msl.ModifiedTimeWeightedLinearRegression(method = "analytic", fit_intercept=False)),
          ]
        ),
    },
]


# Hyperparameter grid
learning_grid = [
    {
        "ols": {
            "predictor__positive": [True, False],
        },
        "twls": {
           "predictor__positive": [True, False],
           "predictor__half_life": [12, 24, 36, 60],
        },

    },
]

# list of tuples containg both the model specification and the corresponding hyperparameter grid search
model_and_grids = list(zip(learning_models, learning_grid))
# Wrapper to avoid repetitive code below

def run_single_signal_optimizer(
    df: pd.DataFrame,
    xcats: list,
    cids: list,
    blacklist,
    signal_freq: str,
    signal_name: str,
    models: dict,
    hyperparameters: dict,
    learning_config: dict,
) -> tuple:
    """
    Wrapping function around msl.SignalOptimizer for a given set of models and hyperparameters

    """
    assert set(models.keys()) == set(hyperparameters.keys()), "The provided pair of model and grid names do not match."

    required_config = ["scorer", "splitter", "test_size", "min_cids", "min_periods", "split_functions"]
    assert all([learning_config.get(x, None) is not None for x in required_config])

    so = msl.SignalOptimizer(
        df=df,
        xcats=xcats,
        cids=cids,
        blacklist=blacklist,
        freq=signal_freq,
        lag=1,
        xcat_aggs=["last", "sum"],
    )
    so.calculate_predictions(
        name=signal_name,
        models=models,
        scorers=learning_config.get("scorer"),
        hyperparameters=hyperparameters,
        inner_splitters=learning_config.get("splitter"),
        test_size=learning_config.get("test_size"),
        min_cids=learning_config.get("min_cids"),
        min_periods=learning_config.get("min_periods"),
        n_jobs_outer=-1,
        split_functions=learning_config.get("split_functions"),
    )
    # cleanup
    gc.collect()

    return so
PnL generation parameters #
default_start_date = "2003-01-31" # start date for the PnL analysis
Sector average #
Specify analysis #
sector = "ALL"

all_dict = {
    "sec": sector,
    "name": sector_labels[sector],
    "factors": rn_factors,
    "cidx": cids_eqx,
    "ret": f"EQC{sector}{default_target_type}",
    "freq": "M",
    "black": None,
    "models": None,
    "signals": None,
    "catregs": None,
    "pnls": None,
}
General learning models and signals #
dix = all_dict

sec = dix["sec"]
factors = dix["factors"]
ret = dix["ret"]
cidx = dix["cidx"]
freq = dix["freq"]
blax = dix["black"]

trained_models = {}
for pair in model_and_grids:

    model, grid = pair

    opt_pipeline_name = '-'.join(list(model.keys()))
    signal_name = opt_pipeline_name.upper() + sec.upper()

    print(
        f"Running the signal learning for {opt_pipeline_name} over {sec} returns."
    )

    trained_models[signal_name] = run_single_signal_optimizer(
        df=dfx,
        xcats=factors + [ret],
        cids=cidx,
        blacklist=blax,
        signal_freq=freq,
        signal_name=signal_name,
        models=model,
        hyperparameters=grid,
        learning_config=default_learn_config,
    )

    dfa = trained_models[signal_name].get_optimized_signals()
    dfx = msm.update_df(dfx, dfa)

dix["models"] = trained_models.values()
dix["signals"] = ["MACROvGLB_ZN"] + list(trained_models.keys())
Running the signal learning for ols-twls over ALL returns.
dix = all_dict
sec = dix["sec"]
trained_models = list(dix["models"])
sigx = dix["signals"][-1]
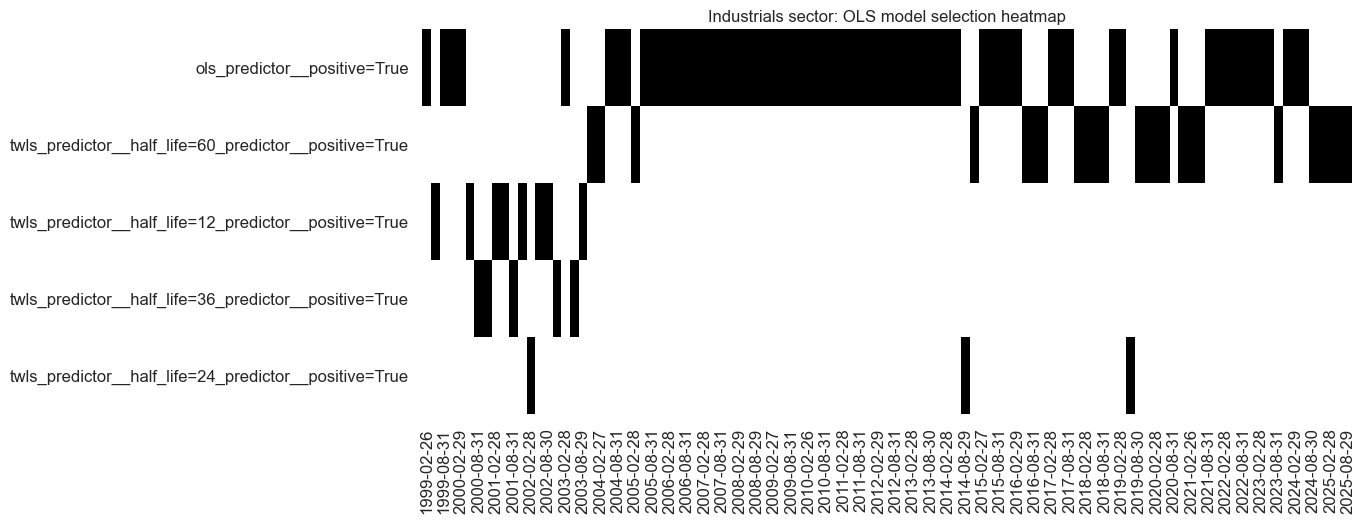
trained_models[0].models_heatmap(
sigx,
cap=10,
figsize=(12, 5),
title=f"{sector_labels[sec.upper()]} sector: OLS model selection heatmap",
)
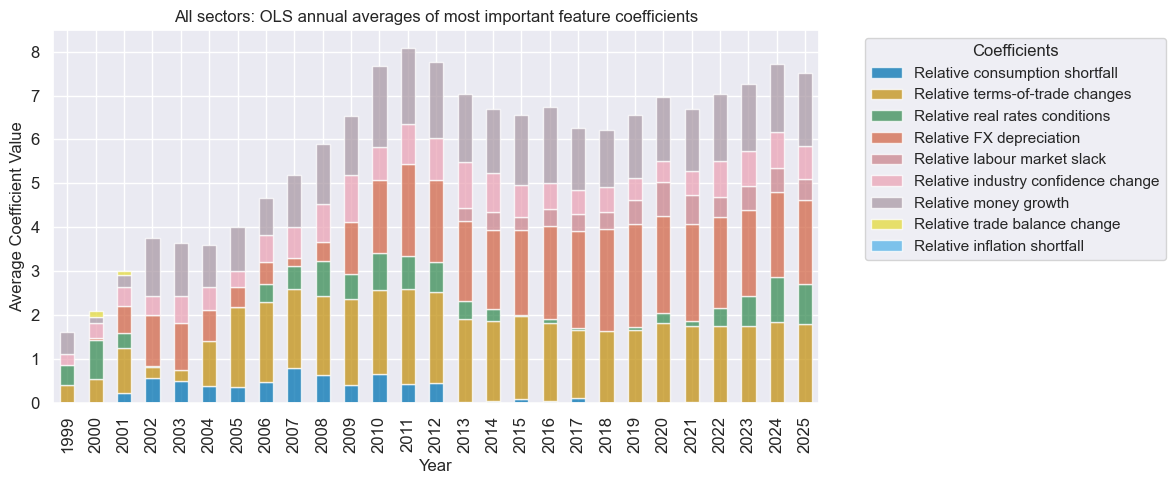
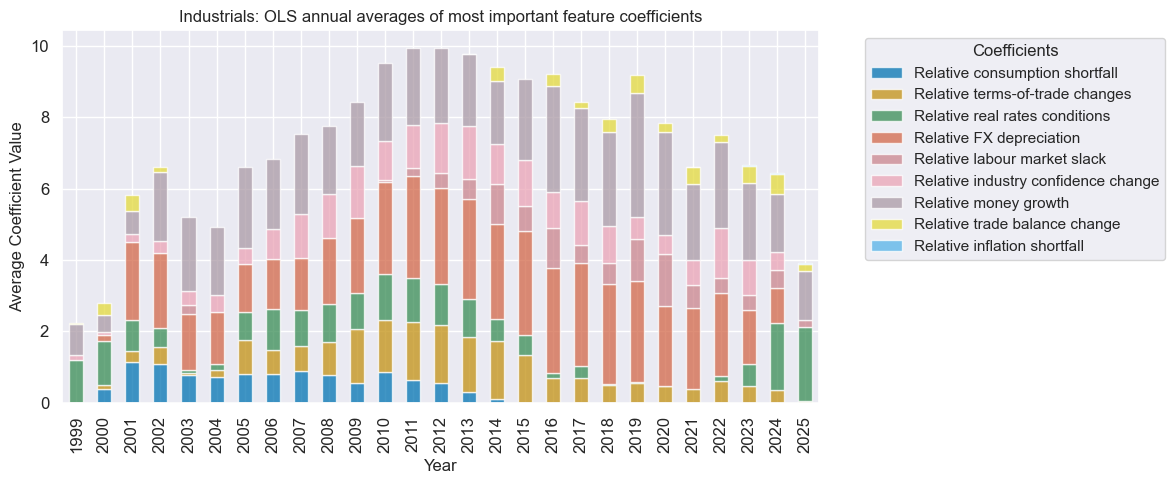
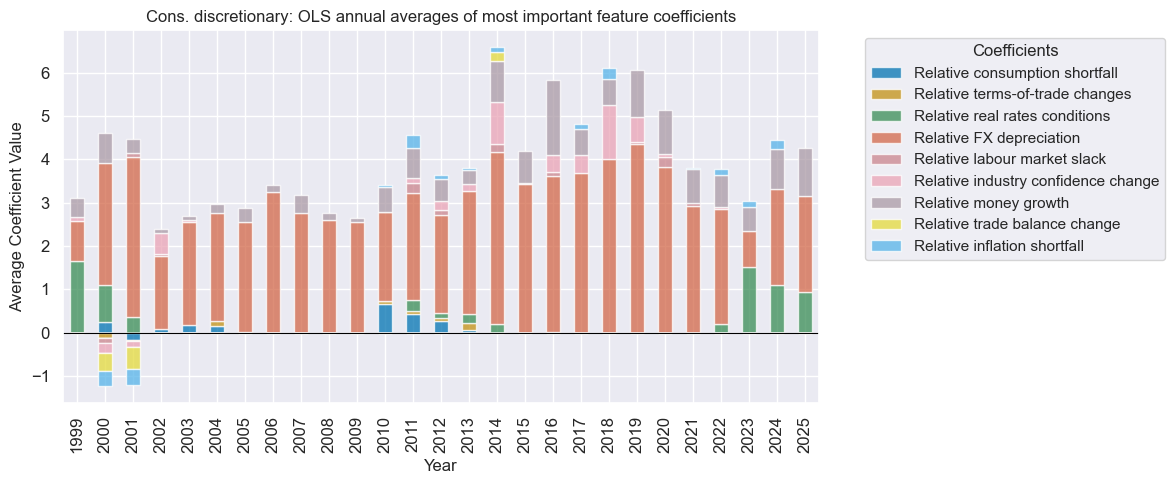
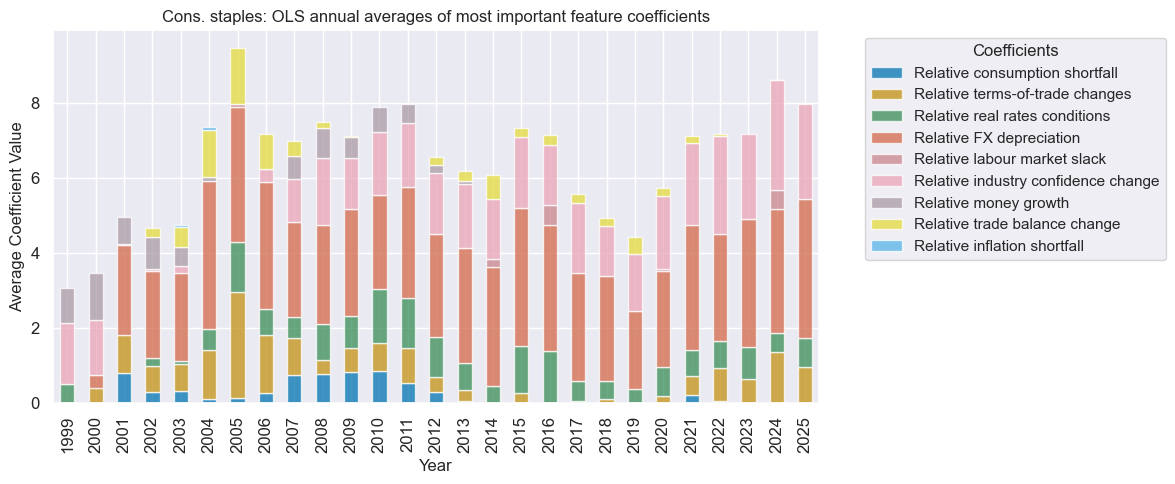
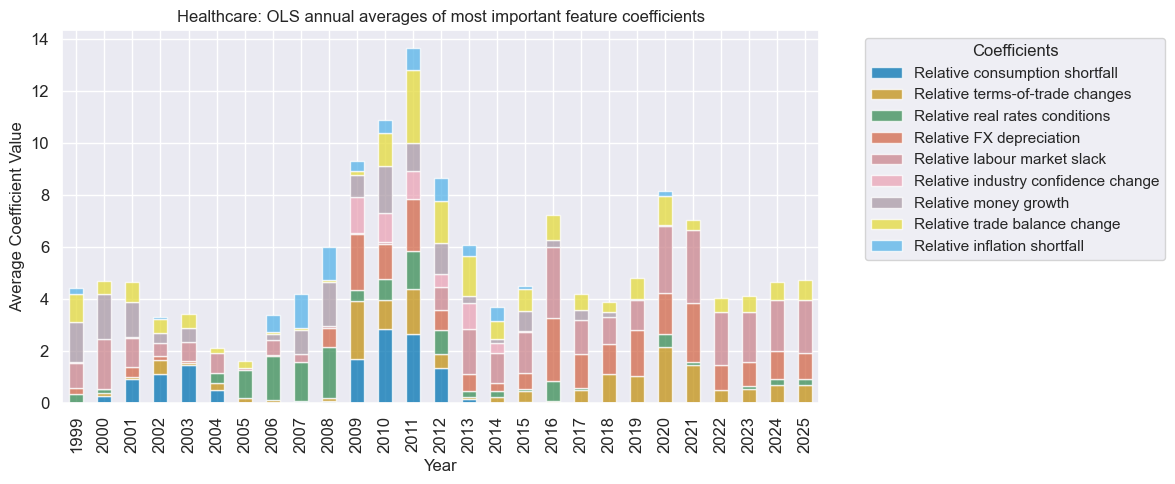
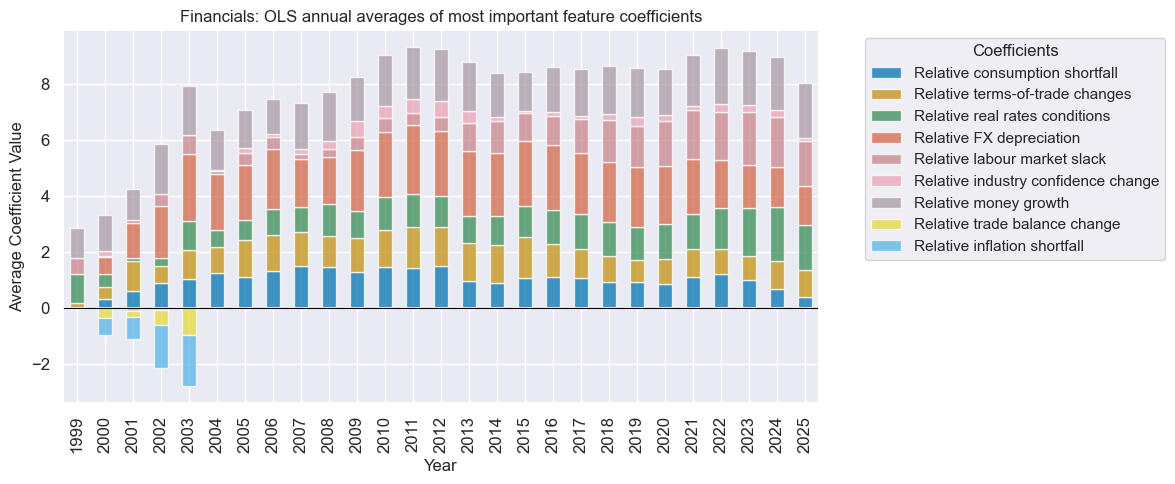
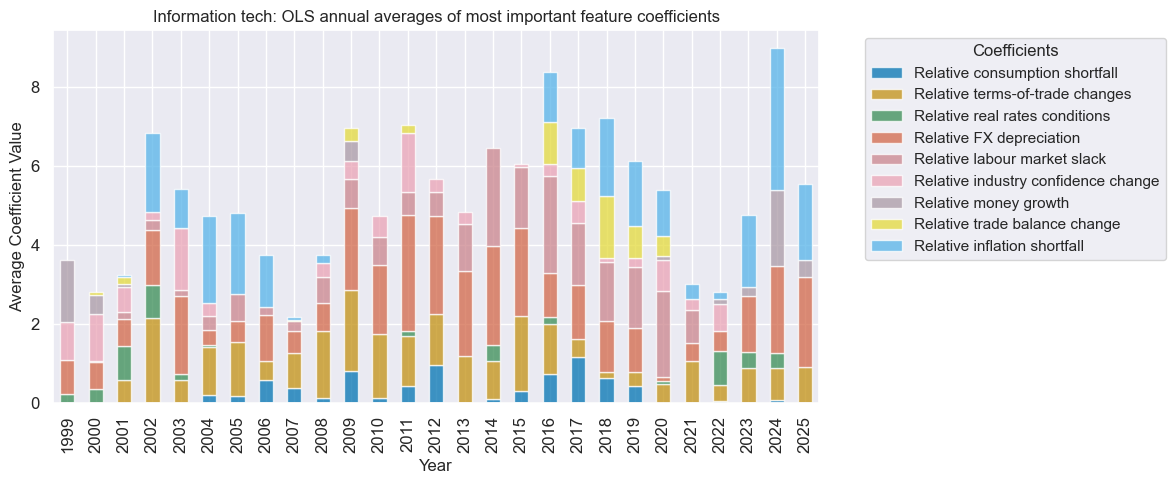
trained_models[0].coefs_stackedbarplot(
name=sigx,
figsize=(12, 5),
ftrs_renamed=rnf_labels,
title=f"{sector_labels[sec.upper()]}: OLS annual averages of most important feature coefficients",
)

Signal quality check #
dix = all_dict

cidx = dix["cidx"]
sec = dix["name"]
sigs = dix["signals"]
ret = dix["ret"]
freq = dix["freq"]
blax = dix["black"]

catregs = {
    x: msp.CategoryRelations(
        df=dfx,
        xcats=[x, ret],
        cids=cidx,
        freq=freq,
        lag=1,
        blacklist=blax,
        xcat_aggs=["last", "sum"],
        slip=1,
    )
    for x in sigs
}

dix["catregs"] = catregs
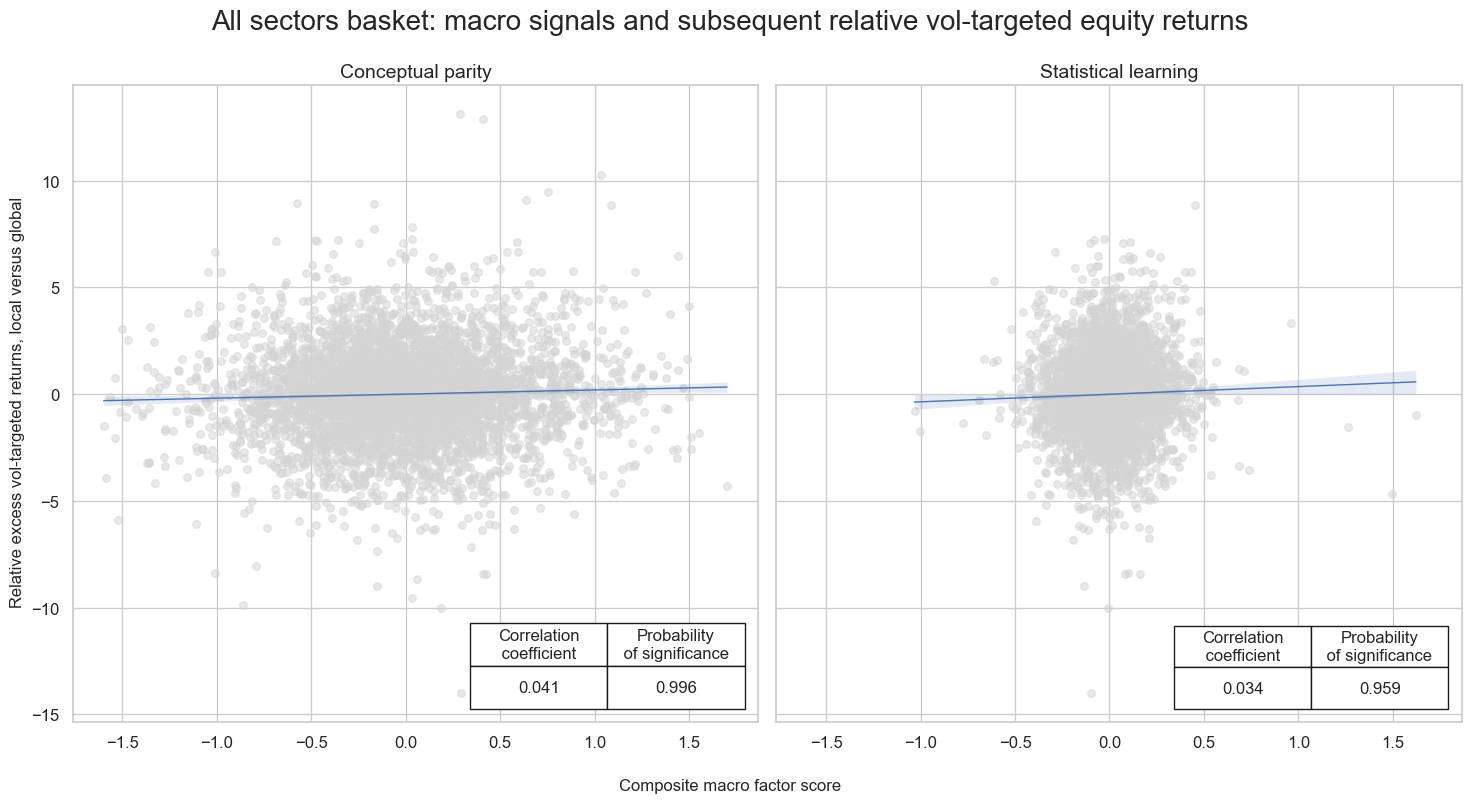
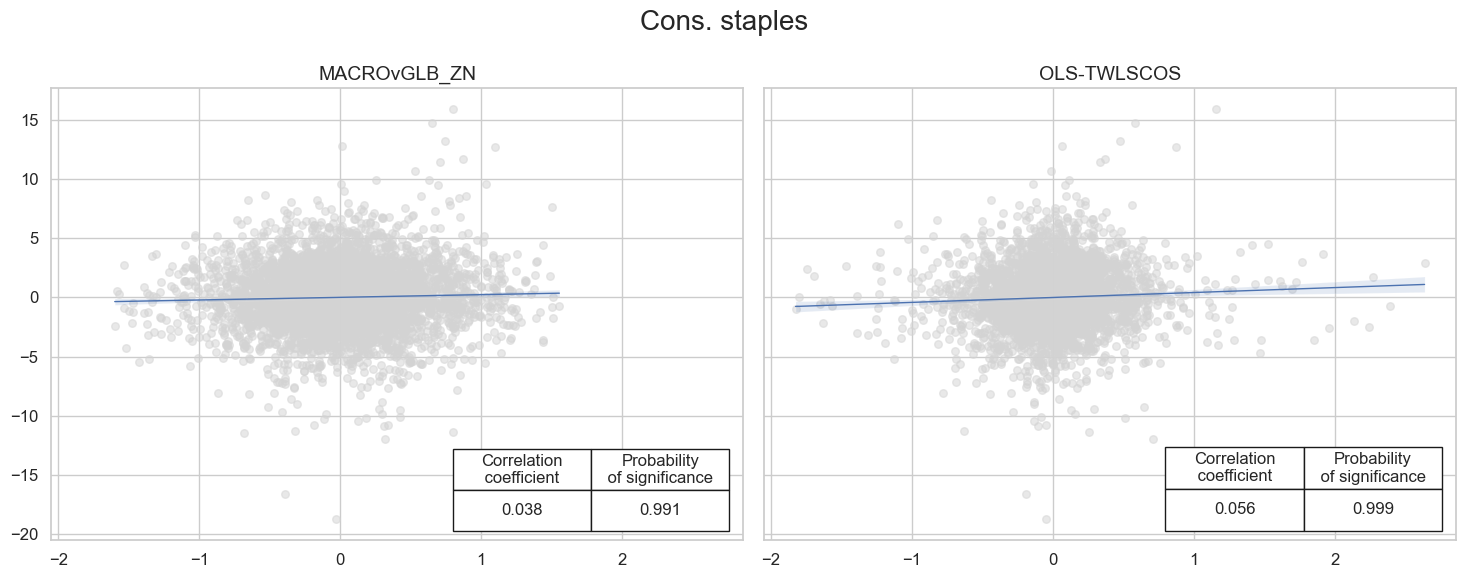
dix = all_dict
catregs = dix["catregs"]
sigs = dix["signals"]
name = dix["name"]

msv.multiple_reg_scatter(
    cat_rels=list(catregs.values()),
    ncol=2,
    nrow=1,
    figsize=(15, 8),
    title=f"{name} basket: macro signals and subsequent relative vol-targeted equity returns",
    title_xadj=0.5,
    title_yadj=0.99,
    title_fontsize=20,
    xlab="Composite macro factor score",
    ylab="Relative excess vol-targeted returns, local versus global",
    coef_box="lower right",
    prob_est="map",
    single_chart=True,
    subplot_titles=["Conceptual parity", "Statistical learning"],
)
Naive PnL #
dix = all_dict

cidx = dix["cidx"]
sigs = dix["signals"]
ret = dix["ret"]
freq = dix["freq"]
blax = dix["black"]

pnl = msn.NaivePnL(
    df=dfx,
    ret=ret,
    sigs=sigs,
    cids=cidx,
    start=default_start_date,
    blacklist=blax,
    bms=["USD_EQXR_NSA"],
)

for sig in sigs:
    pnl.make_pnl(
        sig=sig,
        sig_op="zn_score_pan",
        rebal_freq="monthly",
        neutral="zero",
        rebal_slip=1,
        vol_scale = None,
        thresh=3,
        pnl_name=f"PNL_{sig}_PZN" if sig != "MACROvGLB_ZN" else f"PNL_{sig}{dix['sec']}_PZN",
    )

dix["pnls"] = pnl
dix = all_dict

pnl = dix["pnls"]
name = dix["name"]
sigs = dix["signals"]
pns = [f"PNL_{sig}_PZN" if sig != "MACROvGLB_ZN" else f"PNL_{sig}{dix['sec']}_PZN" for sig in sigs]

pnl.plot_pnls(
    pnl_cats=pnl.pnl_names,
    title=f"{name} basket: naive PnLs of local positions versus global basket",
    xcat_labels=["Conceptual parity", "Statistical learning"],
    title_fontsize=14
)

display(pnl.evaluate_pnls(pnl_cats=pnl.pnl_names))
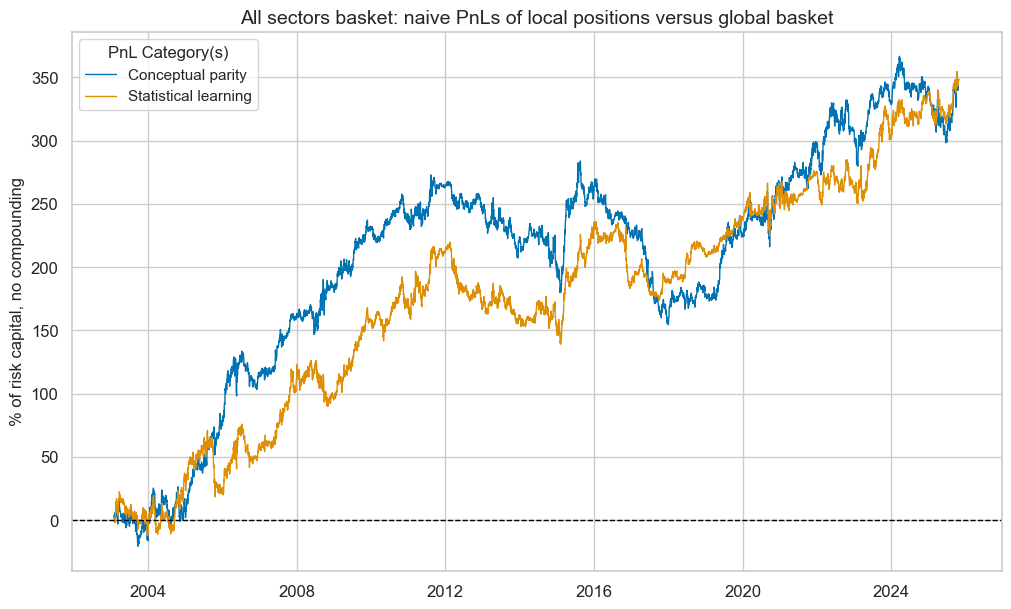
| xcat | PNL_MACROvGLB_ZNALL_PZN | PNL_OLS-TWLSALL_PZN |
|---|---|---|
| Return % | 15.33054 | 15.300824 |
| St. Dev. % | 40.720684 | 36.848527 |
| Sharpe Ratio | 0.37648 | 0.415236 |
| Sortino Ratio | 0.538702 | 0.595861 |
| Max 21-Day Draw % | -29.45794 | -44.994345 |
| Max 6-Month Draw % | -66.148789 | -46.055318 |
| Peak to Trough Draw % | -129.437317 | -80.594426 |
| Top 5% Monthly PnL Share | 0.896164 | 0.709751 |
| USD_EQXR_NSA correl | -0.022459 | -0.01336 |
| Traded Months | 274 | 274 |
Energy sector #
Specify analysis #
sector = "ENR"

enr_dict = {
    "sec": sector,
    "name": sector_labels[sector],
    "factors": rn_factors,
    "cidx": list(set(cids_eqx) - {"CHF"}),
    "ret": f"EQC{sector}{default_target_type}",
    "freq": "M",
    "black": sector_blacklist[sector],
    "models": None,
    "signals": None,
    "catregs": None,
    "pnls": None,
}
General learning models and signals #
dix = enr_dict

sec = dix["sec"]
factors = dix["factors"]
ret = dix["ret"]
cidx = dix["cidx"]
freq = dix["freq"]
blax = dix["black"]

trained_models = {}
for pair in model_and_grids:

    model, grid = pair

    opt_pipeline_name = '-'.join(list(model.keys()))
    signal_name = opt_pipeline_name.upper() + sec.upper()

    print(
        f"Running the signal learning for {opt_pipeline_name} over {sec} returns."
    )

    trained_models[signal_name] = run_single_signal_optimizer(
        df=dfx,
        xcats=factors + [ret],
        cids=cidx,
        blacklist=blax,
        signal_freq=freq,
        signal_name=signal_name,
        models=model,
        hyperparameters=grid,
        learning_config=default_learn_config,
    )

    dfa = trained_models[signal_name].get_optimized_signals()
    dfx = msm.update_df(dfx, dfa)

dix["models"] = trained_models.values()
dix["signals"] = ["MACROvGLB_ZN"] + list(trained_models.keys())
Running the signal learning for ols-twls over ENR returns.
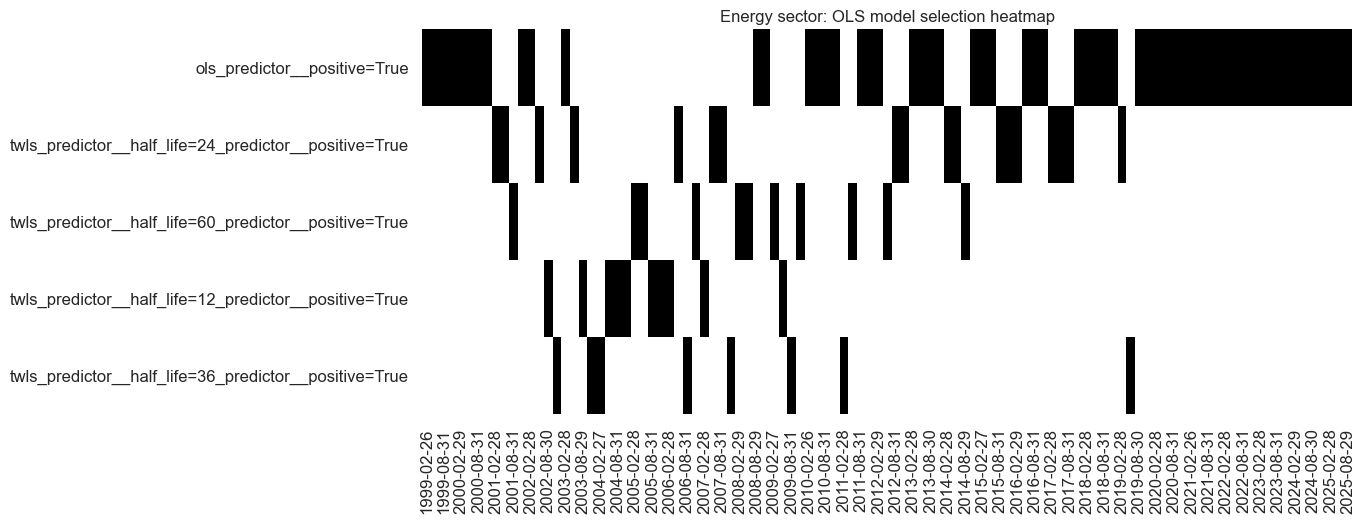
dix = enr_dict

sec = dix["sec"]
trained_models = list(dix["models"])
sigx = dix["signals"][-1]

trained_models[0].models_heatmap(
    sigx,
    cap=10,
    figsize=(12, 5),
    title=f"{sector_labels[sec.upper()]} sector: OLS model selection heatmap",
)

trained_models[0].coefs_stackedbarplot(
    name=sigx,
    figsize=(12, 5),
    ftrs_renamed=rnf_labels,
    title=f"{sector_labels[sec.upper()]}: OLS annual averages of most important feature coefficients",
)

Signal quality check #
dix = enr_dict

cidx = dix["cidx"]
sec = dix["name"]
sigs = dix["signals"]
ret = dix["ret"]
freq = dix["freq"]
blax = dix["black"]

catregs = {
    x: msp.CategoryRelations(
        df=dfx,
        xcats=[x, ret],
        cids=cidx,
        freq=freq,
        lag=1,
        blacklist=blax,
        xcat_aggs=["last", "sum"],
        slip=1,
    )
    for x in sigs
}

dix["catregs"] = catregs
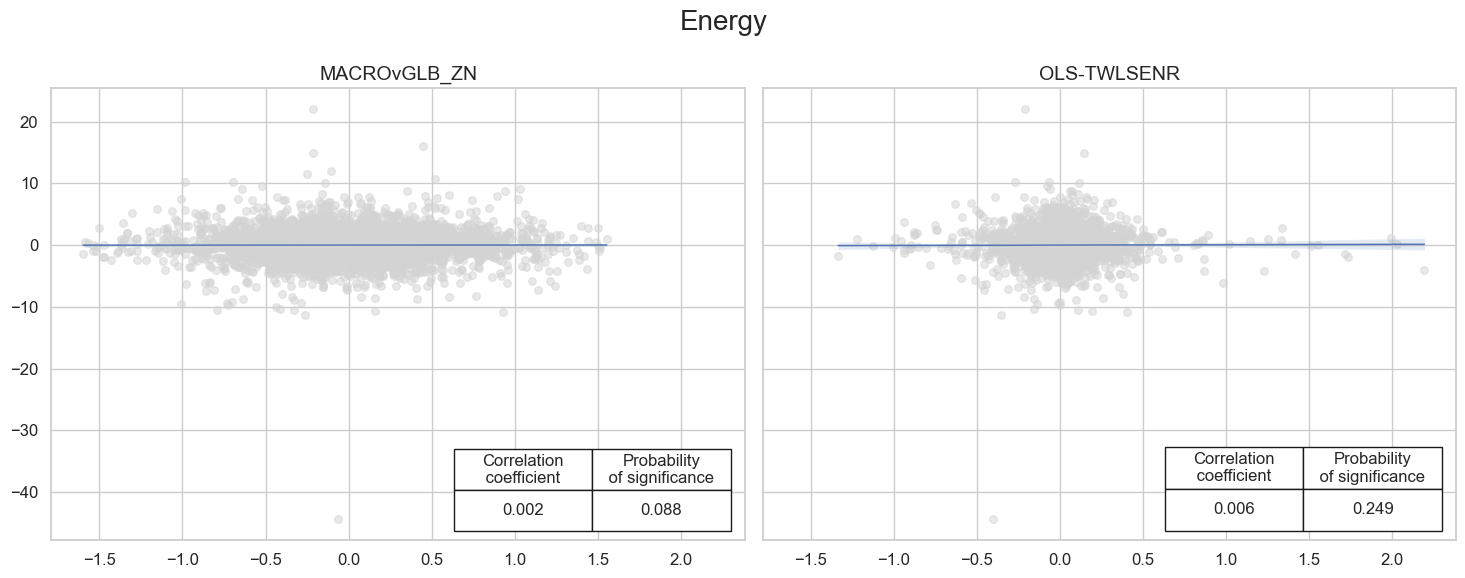
dix = enr_dict
catregs = dix["catregs"]
sigs = dix["signals"]
name = dix["name"]

msv.multiple_reg_scatter(
    cat_rels=list(catregs.values()),
    ncol=2,
    nrow=1,
    figsize=(15, 6),
    title=name,
    title_xadj=0.5,
    title_yadj=0.99,
    title_fontsize=20,
    xlab=None,
    ylab=None,
    coef_box="lower right",
    prob_est="map",
    single_chart=True,
    subplot_titles=list(sigs),
)
Naive PnL #
dix = enr_dict

cidx = dix["cidx"]
sigs = dix["signals"]
ret = dix["ret"]
freq = dix["freq"]
blax = dix["black"]

pnl = msn.NaivePnL(
    df=dfx,
    ret=ret,
    sigs=sigs,
    cids=cidx,
    start=default_start_date,
    blacklist=blax,
    bms=["USD_EQXR_NSA"],
)

for sig in sigs:
    pnl.make_pnl(
        sig=sig,
        sig_op="zn_score_pan",
        rebal_freq="monthly",
        neutral="zero",
        rebal_slip=1,
        vol_scale = None,
        thresh=3,
        pnl_name=f"PNL_{sig}_PZN" if sig != "MACROvGLB_ZN" else f"PNL_{sig}{dix['sec']}_PZN",
    )

dix["pnls"] = pnl
dix = enr_dict

pnl = dix["pnls"]
name = dix["name"]
sigs = dix["signals"]
pns = [f"PNL_{sig}_PZN" if sig != "MACROvGLB_ZN" else f"PNL_{sig}{dix['sec']}_PZN" for sig in sigs]

pnl.plot_pnls(
    pnl_cats=pnl.pnl_names,
    title=f"{name} sector: naive PnLs of local positions versus global basket",
    title_fontsize=14
)

display(pnl.evaluate_pnls(pnl_cats=pnl.pnl_names))
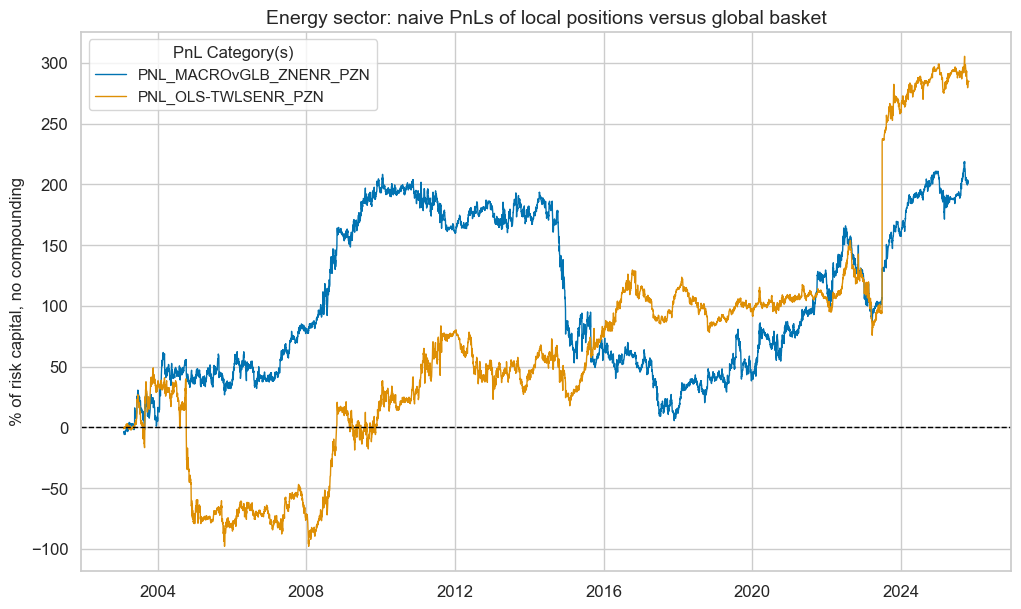
| xcat | PNL_MACROvGLB_ZNENR_PZN | PNL_OLS-TWLSENR_PZN |
|---|---|---|
| Return % | 8.922574 | 12.519594 |
| St. Dev. % | 41.586185 | 49.175064 |
| Sharpe Ratio | 0.214556 | 0.254592 |
| Sortino Ratio | 0.302186 | 0.441703 |
| Max 21-Day Draw % | -56.477477 | -75.906299 |
| Max 6-Month Draw % | -118.133071 | -117.388372 |
| Peak to Trough Draw % | -202.672455 | -146.848974 |
| Top 5% Monthly PnL Share | 1.539681 | 1.371595 |
| USD_EQXR_NSA correl | 0.010363 | 0.088825 |
| Traded Months | 274 | 274 |
Materials sector #
Specify analysis #
sector = "MAT"

mat_dict = {
    "sec": sector,
    "name": sector_labels[sector],
    "factors": rn_factors,
    "cidx": cids_eqx,
    "ret": f"EQC{sector}{default_target_type}",
    "freq": "M",
    "black": sector_blacklist[sector],
    "models": None,
    "signals": None,
    "catregs": None,
    "pnls": None,
}
General learning models and signals #
dix = mat_dict

sec = dix["sec"]
factors = dix["factors"]
ret = dix["ret"]
cidx = dix["cidx"]
freq = dix["freq"]
blax = dix["black"]

trained_models = {}
for pair in model_and_grids:

    model, grid = pair

    opt_pipeline_name = '-'.join(list(model.keys()))
    signal_name = opt_pipeline_name.upper() + sec.upper()

    print(
        f"Running the signal learning for {opt_pipeline_name} over {sec} returns."
    )

    trained_models[signal_name] = run_single_signal_optimizer(
        df=dfx,
        xcats=factors + [ret],
        cids=cidx,
        blacklist=blax,
        signal_freq=freq,
        signal_name=signal_name,
        models=model,
        hyperparameters=grid,
        learning_config=default_learn_config,
    )

    dfa = trained_models[signal_name].get_optimized_signals()
    dfx = msm.update_df(dfx, dfa)

dix["models"] = trained_models.values()
dix["signals"] = ["MACROvGLB_ZN"] + list(trained_models.keys())
Running the signal learning for ols-twls over MAT returns.
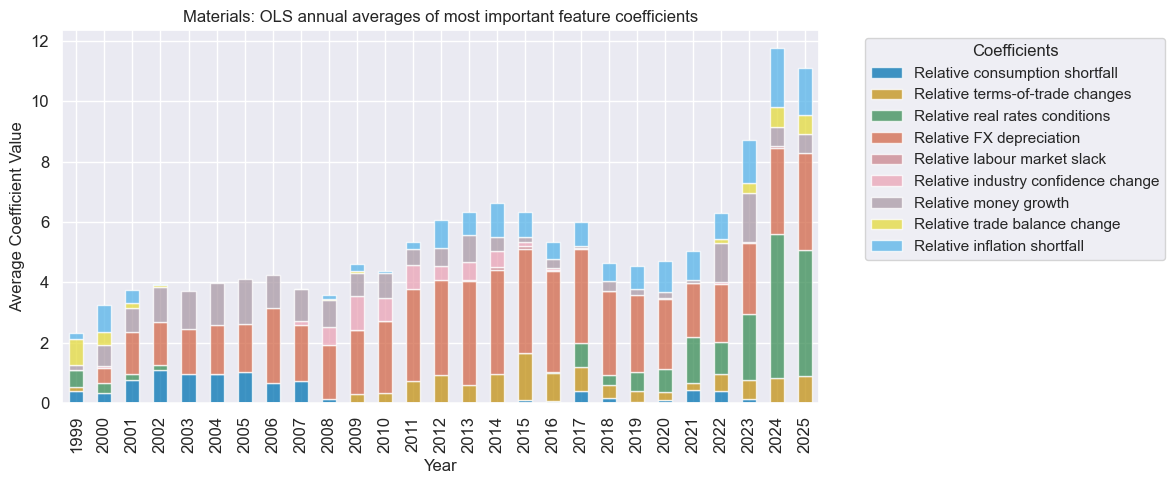
dix = mat_dict

sec = dix["sec"]
trained_models = list(dix["models"])
sigx = dix["signals"][-1]

trained_models[0].models_heatmap(
    sigx,
    cap=10,
    figsize=(12, 5),
    title=f"{sector_labels[sec.upper()]} sector: OLS model selection heatmap",
)

trained_models[0].coefs_stackedbarplot(
    name=sigx,
    figsize=(12, 5),
    ftrs_renamed=rnf_labels,
    title=f"{sector_labels[sec.upper()]}: OLS annual averages of most important feature coefficients",
)

Signal quality check #
dix = mat_dict

cidx = dix["cidx"]
sec = dix["name"]
sigs = dix["signals"]
ret = dix["ret"]
freq = dix["freq"]
blax = dix["black"]

catregs = {
    x: msp.CategoryRelations(
        df=dfx,
        xcats=[x, ret],
        cids=cidx,
        freq=freq,
        lag=1,
        blacklist=blax,
        xcat_aggs=["last", "sum"],
        slip=1,
    )
    for x in sigs
}

dix["catregs"] = catregs
dix = mat_dict
catregs = dix["catregs"]
sigs = dix["signals"]
name = dix["name"]

msv.multiple_reg_scatter(
    cat_rels=list(catregs.values()),
    ncol=2,
    nrow=1,
    figsize=(15, 6),
    title=name,
    title_xadj=0.5,
    title_yadj=0.99,
    title_fontsize=20,
    xlab=None,
    ylab=None,
    coef_box="lower right",
    prob_est="map",
    single_chart=True,
    subplot_titles=list(sigs),
)

Naive PnL #
dix = mat_dict

cidx = dix["cidx"]
sigs = dix["signals"]
ret = dix["ret"]
freq = dix["freq"]
blax = dix["black"]

pnl = msn.NaivePnL(
    df=dfx,
    ret=ret,
    sigs=sigs,
    cids=cidx,
    start=default_start_date,
    blacklist=blax,
    bms=["USD_EQXR_NSA"],
)

for sig in sigs:
    pnl.make_pnl(
        sig=sig,
        sig_op="zn_score_pan",
        rebal_freq="monthly",
        neutral="zero",
        rebal_slip=1,
        vol_scale = None,
        thresh=3,
        pnl_name=f"PNL_{sig}_PZN" if sig != "MACROvGLB_ZN" else f"PNL_{sig}{dix['sec']}_PZN",
    )

dix["pnls"] = pnl
dix = mat_dict

pnl = dix["pnls"]
name = dix["name"]
sigs = dix["signals"]
pns = [f"PNL_{sig}_PZN" if sig != "MACROvGLB_ZN" else f"PNL_{sig}{dix['sec']}_PZN" for sig in sigs]

pnl.plot_pnls(
    pnl_cats=pnl.pnl_names,
    title=f"{name} sector: naive PnLs of local positions versus global basket",
    xcat_labels=["Conceptual parity", "Statistical learning"],
    title_fontsize=14
)

display(pnl.evaluate_pnls(pnl_cats=pnl.pnl_names))
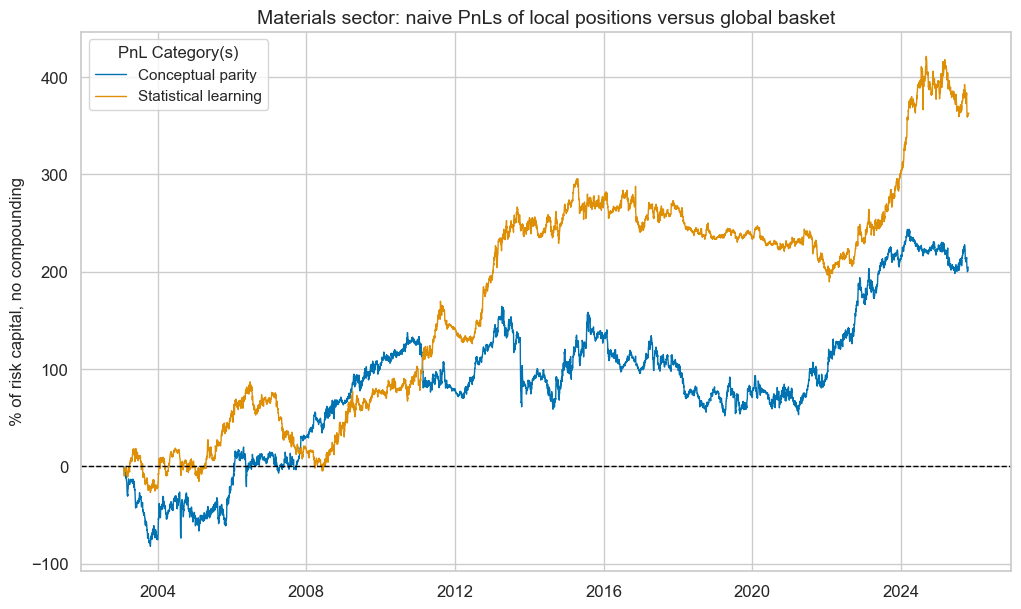
| xcat | PNL_MACROvGLB_ZNMAT_PZN | PNL_OLS-TWLSMAT_PZN |
|---|---|---|
| Return % | 9.014093 | 15.954342 |
| St. Dev. % | 42.324661 | 38.873806 |
| Sharpe Ratio | 0.212975 | 0.410414 |
| Sortino Ratio | 0.304503 | 0.590596 |
| Max 21-Day Draw % | -71.208186 | -38.602104 |
| Max 6-Month Draw % | -97.564803 | -55.234275 |
| Peak to Trough Draw % | -112.460895 | -105.905909 |
| Top 5% Monthly PnL Share | 1.553197 | 0.846248 |
| USD_EQXR_NSA correl | -0.008499 | -0.025143 |
| Traded Months | 274 | 274 |
Industrials sector #
Specify analysis #
sector = "IND"

ind_dict = {
    "sec": sector,
    "name": sector_labels[sector],
    "factors": rn_factors,
    "cidx": cids_eqx,
    "ret": f"EQC{sector}{default_target_type}",
    "freq": "M",
    "black": sector_blacklist[sector],
    "models": None,
    "signals": None,
    "catregs": None,
    "pnls": None,
}
General learning models and signals #
dix = ind_dict

sec = dix["sec"]
factors = dix["factors"]
ret = dix["ret"]
cidx = dix["cidx"]
freq = dix["freq"]
blax = dix["black"]

trained_models = {}
for pair in model_and_grids:

    model, grid = pair

    opt_pipeline_name = '-'.join(list(model.keys()))
    signal_name = opt_pipeline_name.upper() + sec.upper()

    print(
        f"Running the signal learning for {opt_pipeline_name} over {sec} returns."
    )

    trained_models[signal_name] = run_single_signal_optimizer(
        df=dfx,
        xcats=factors + [ret],
        cids=cidx,
        blacklist=blax,
        signal_freq=freq,
        signal_name=signal_name,
        models=model,
        hyperparameters=grid,
        learning_config=default_learn_config,
    )

    dfa = trained_models[signal_name].get_optimized_signals()
    dfx = msm.update_df(dfx, dfa)

dix["models"] = trained_models.values()
dix["signals"] = ["MACROvGLB_ZN"] + list(trained_models.keys())
Running the signal learning for ols-twls over IND returns.
dix = ind_dict

sec = dix["sec"]
trained_models = list(dix["models"])
sigx = dix["signals"][-1]

trained_models[0].models_heatmap(
    sigx,
    cap=10,
    figsize=(12, 5),
    title=f"{sector_labels[sec.upper()]} sector: OLS model selection heatmap",
)

trained_models[0].coefs_stackedbarplot(
    name=sigx,
    figsize=(12, 5),
    ftrs_renamed=rnf_labels,
    title=f"{sector_labels[sec.upper()]}: OLS annual averages of most important feature coefficients",
)
Signal quality check #
dix = ind_dict

cidx = dix["cidx"]
sec = dix["name"]
sigs = dix["signals"]
ret = dix["ret"]
freq = dix["freq"]
blax = dix["black"]

catregs = {
    x: msp.CategoryRelations(
        df=dfx,
        xcats=[x, ret],
        cids=cidx,
        freq=freq,
        lag=1,
        blacklist=blax,
        xcat_aggs=["last", "sum"],
        slip=1,
    )
    for x in sigs
}

dix["catregs"] = catregs
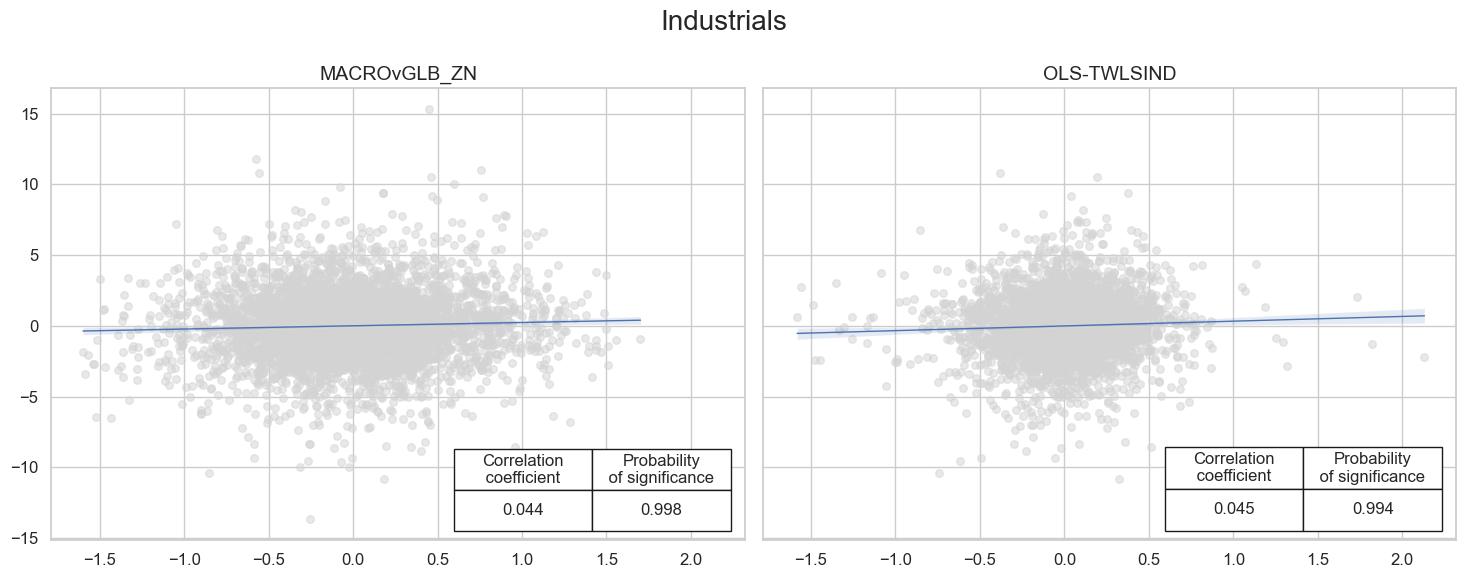
dix = ind_dict
catregs = dix["catregs"]
sigs = dix["signals"]
name = dix["name"]

msv.multiple_reg_scatter(
    cat_rels=list(catregs.values()),
    ncol=2,
    nrow=1,
    figsize=(15, 6),
    title=name,
    title_xadj=0.5,
    title_yadj=0.99,
    title_fontsize=20,
    xlab=None,
    ylab=None,
    coef_box="lower right",
    prob_est="map",
    single_chart=True,
    subplot_titles=list(sigs),
)
Naive PnL #
dix = ind_dict

cidx = dix["cidx"]
sigs = dix["signals"]
ret = dix["ret"]
freq = dix["freq"]
blax = dix["black"]

pnl = msn.NaivePnL(
    df=dfx,
    ret=ret,
    sigs=sigs,
    cids=cidx,
    start=default_start_date,
    blacklist=blax,
    bms=["USD_EQXR_NSA"],
)

for sig in sigs:
    pnl.make_pnl(
        sig=sig,
        sig_op="zn_score_pan",
        rebal_freq="monthly",
        neutral="zero",
        rebal_slip=1,
        vol_scale = None,
        thresh=3,
        pnl_name=f"PNL_{sig}_PZN" if sig != "MACROvGLB_ZN" else f"PNL_{sig}{dix['sec']}_PZN",
    )

dix["pnls"] = pnl
dix = ind_dict

pnl = dix["pnls"]
name = dix["name"]
sigs = dix["signals"]
pns = [f"PNL_{sig}_PZN" if sig != "MACROvGLB_ZN" else f"PNL_{sig}{dix['sec']}_PZN" for sig in sigs]

pnl.plot_pnls(
    pnl_cats=pnl.pnl_names,
    title=f"{name} sector: naive PnLs of local positions versus global basket",
    title_fontsize=14
)

display(pnl.evaluate_pnls(pnl_cats=pnl.pnl_names))
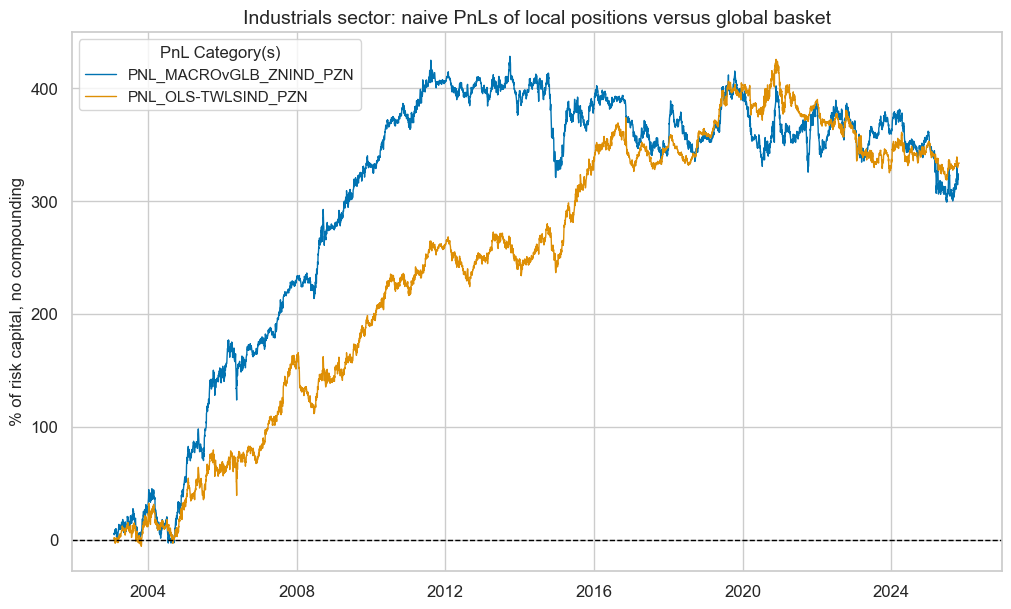
| xcat | PNL_MACROvGLB_ZNIND_PZN | PNL_OLS-TWLSIND_PZN |
|---|---|---|
| Return % | 14.26732 | 14.665126 |
| St. Dev. % | 42.578513 | 35.741076 |
| Sharpe Ratio | 0.335083 | 0.410316 |
| Sortino Ratio | 0.48056 | 0.596833 |
| Max 21-Day Draw % | -55.84378 | -34.384014 |
| Max 6-Month Draw % | -79.843114 | -46.608887 |
| Peak to Trough Draw % | -129.044704 | -106.755873 |
| Top 5% Monthly PnL Share | 1.080492 | 0.810496 |
| USD_EQXR_NSA correl | 0.000998 | -0.009938 |
| Traded Months | 274 | 274 |
Consumer discretionary sector #
Specify analysis #
sector = "COD"

cod_dict = {
    "sec": sector,
    "name": sector_labels[sector],
    "factors": rn_factors,
    "cidx": cids_eqx,
    "ret": f"EQC{sector}{default_target_type}",
    "freq": "M",
    "black": sector_blacklist[sector],
    "models": None,
    "signals": None,
    "catregs": None,
    "pnls": None,
}
General learning models and signals #
dix = cod_dict

sec = dix["sec"]
factors = dix["factors"]
ret = dix["ret"]
cidx = dix["cidx"]
freq = dix["freq"]
blax = dix["black"]

trained_models = {}
for pair in model_and_grids:

    model, grid = pair

    opt_pipeline_name = '-'.join(list(model.keys()))
    signal_name = opt_pipeline_name.upper() + sec.upper()

    print(
        f"Running the signal learning for {opt_pipeline_name} over {sec} returns."
    )

    trained_models[signal_name] = run_single_signal_optimizer(
        df=dfx,
        xcats=factors + [ret],
        cids=cidx,
        blacklist=blax,
        signal_freq=freq,
        signal_name=signal_name,
        models=model,
        hyperparameters=grid,
        learning_config=default_learn_config,
    )

    dfa = trained_models[signal_name].get_optimized_signals()
    dfx = msm.update_df(dfx, dfa)

dix["models"] = trained_models.values()
dix["signals"] = ["MACROvGLB_ZN"] + list(trained_models.keys())
Running the signal learning for ols-twls over COD returns.
dix = cod_dict

sec = dix["sec"]
trained_models = list(dix["models"])
sigx = dix["signals"][-1]

trained_models[0].models_heatmap(
    sigx,
    cap=10,
    figsize=(12, 5),
    title=f"{sector_labels[sec.upper()]} sector: OLS model selection heatmap",
)

trained_models[0].coefs_stackedbarplot(
    name=sigx,
    figsize=(12, 5),
    ftrs_renamed=rnf_labels,
    title=f"{sector_labels[sec.upper()]}: OLS annual averages of most important feature coefficients",
)

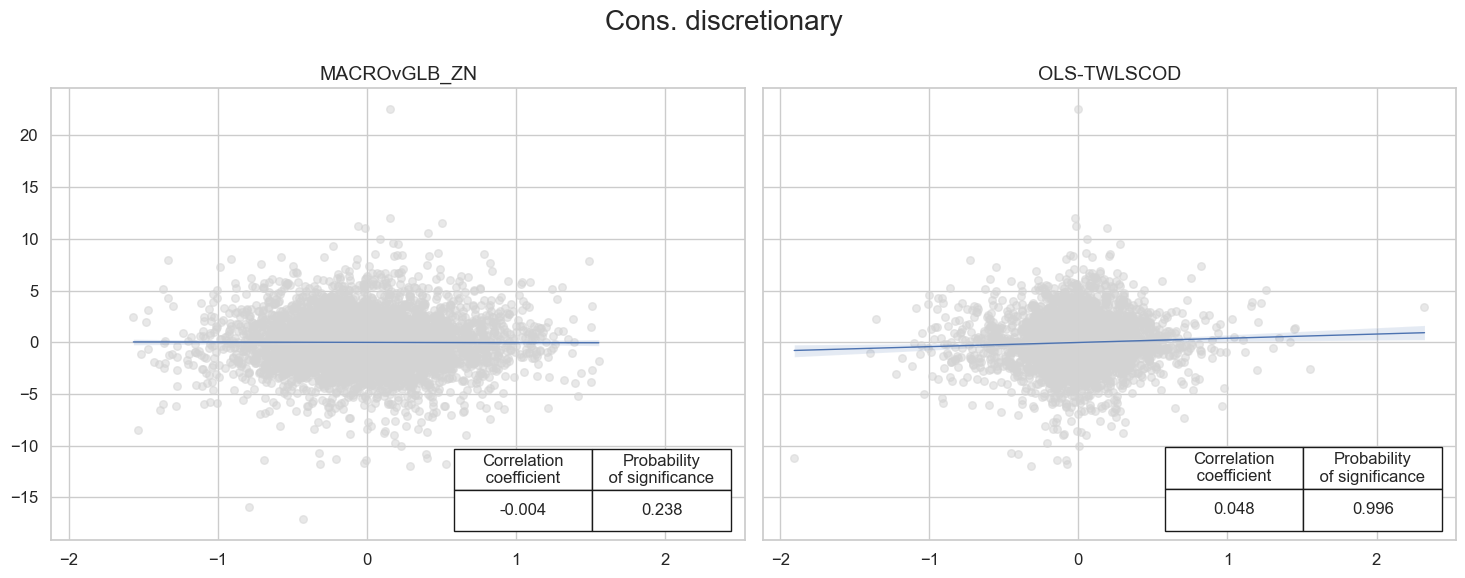
Signal quality check #
dix = cod_dict

cidx = dix["cidx"]
sec = dix["name"]
sigs = dix["signals"]
ret = dix["ret"]
freq = dix["freq"]
blax = dix["black"]

catregs = {
    x: msp.CategoryRelations(
        df=dfx,
        xcats=[x, ret],
        cids=cidx,
        freq=freq,
        lag=1,
        blacklist=blax,
        xcat_aggs=["last", "sum"],
        slip=1,
    )
    for x in sigs
}

dix["catregs"] = catregs
dix = cod_dict
catregs = dix["catregs"]
sigs = dix["signals"]
name = dix["name"]

msv.multiple_reg_scatter(
    cat_rels=list(catregs.values()),
    ncol=2,
    nrow=1,
    figsize=(15, 6),
    title=name,
    title_xadj=0.5,
    title_yadj=0.99,
    title_fontsize=20,
    xlab=None,
    ylab=None,
    coef_box="lower right",
    prob_est="map",
    single_chart=True,
    subplot_titles=list(sigs),
)
Naive PnL #
dix = cod_dict

cidx = dix["cidx"]
sigs = dix["signals"]
ret = dix["ret"]
freq = dix["freq"]
blax = dix["black"]

pnl = msn.NaivePnL(
    df=dfx,
    ret=ret,
    sigs=sigs,
    cids=cidx,
    start=default_start_date,
    blacklist=blax,
    bms=["USD_EQXR_NSA"],
)

for sig in sigs:
    pnl.make_pnl(
        sig=sig,
        sig_op="zn_score_pan",
        rebal_freq="monthly",
        neutral="zero",
        rebal_slip=1,
        vol_scale = None,
        thresh=3,
        pnl_name=f"PNL_{sig}_PZN" if sig != "MACROvGLB_ZN" else f"PNL_{sig}{dix['sec']}_PZN",
    )

dix["pnls"] = pnl
dix = cod_dict

pnl = dix["pnls"]
name = dix["name"]
sigs = dix["signals"]
pns = [f"PNL_{sig}_PZN" if sig != "MACROvGLB_ZN" else f"PNL_{sig}{dix['sec']}_PZN" for sig in sigs]

pnl.plot_pnls(
    pnl_cats=pnl.pnl_names,
    title=f"{name} sector: naive PnLs of local positions versus global basket",
    title_fontsize=14
)

display(pnl.evaluate_pnls(pnl_cats=pnl.pnl_names))
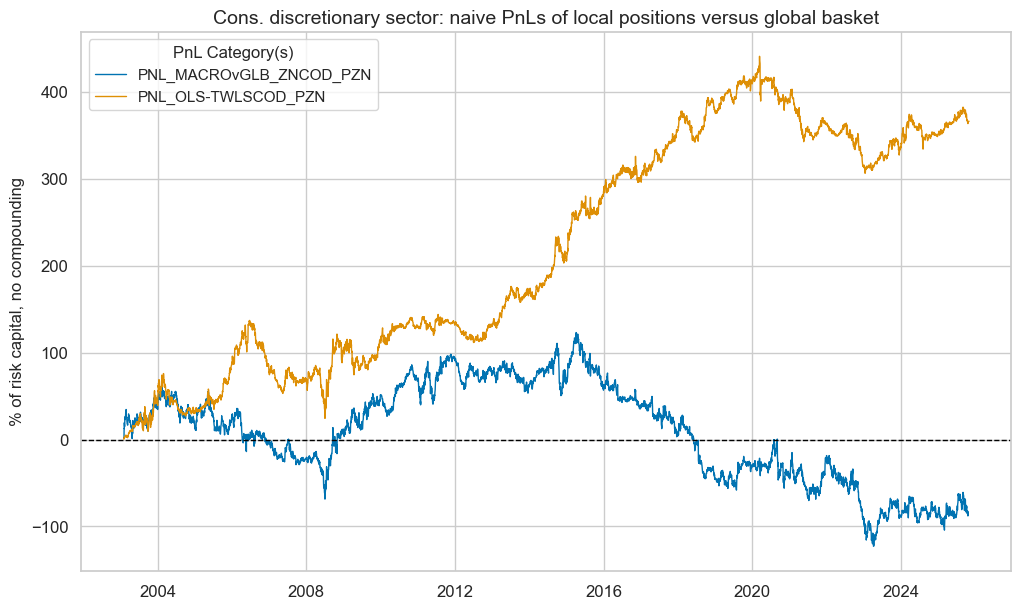
| xcat | PNL_MACROvGLB_ZNCOD_PZN | PNL_OLS-TWLSCOD_PZN |
|---|---|---|
| Return % | -3.661779 | 16.097634 |
| St. Dev. % | 43.591351 | 36.119723 |
| Sharpe Ratio | -0.084002 | 0.445674 |
| Sortino Ratio | -0.118121 | 0.637707 |
| Max 21-Day Draw % | -51.078295 | -38.590187 |
| Max 6-Month Draw % | -74.601867 | -59.128576 |
| Peak to Trough Draw % | -245.940133 | -134.604217 |
| Top 5% Monthly PnL Share | -3.970519 | 0.86369 |
| USD_EQXR_NSA correl | -0.027375 | -0.008855 |
| Traded Months | 274 | 274 |
Consumer staples sector #
Specify analysis #
sector = "COS"

cos_dict = {
    "sec": sector,
    "name": sector_labels[sector],
    "factors": rn_factors,
    "cidx": cids_eqx,
    "ret": f"EQC{sector}{default_target_type}",
    "freq": "M",
    "black": sector_blacklist[sector],
    "models": None,
    "signals": None,
    "catregs": None,
    "pnls": None,
}
General learning models and signals #
dix = cos_dict

sec = dix["sec"]
factors = dix["factors"]
ret = dix["ret"]
cidx = dix["cidx"]
freq = dix["freq"]
blax = dix["black"]

trained_models = {}
for pair in model_and_grids:

    model, grid = pair

    opt_pipeline_name = '-'.join(list(model.keys()))
    signal_name = opt_pipeline_name.upper() + sec.upper()

    print(
        f"Running the signal learning for {opt_pipeline_name} over {sec} returns."
    )

    trained_models[signal_name] = run_single_signal_optimizer(
        df=dfx,
        xcats=factors + [ret],
        cids=cidx,
        blacklist=blax,
        signal_freq=freq,
        signal_name=signal_name,
        models=model,
        hyperparameters=grid,
        learning_config=default_learn_config,
    )

    dfa = trained_models[signal_name].get_optimized_signals()
    dfx = msm.update_df(dfx, dfa)

dix["models"] = trained_models.values()
dix["signals"] = ["MACROvGLB_ZN"] + list(trained_models.keys())
Running the signal learning for ols-twls over COS returns.
dix = cos_dict
sec = dix["sec"]
trained_models = list(dix["models"])
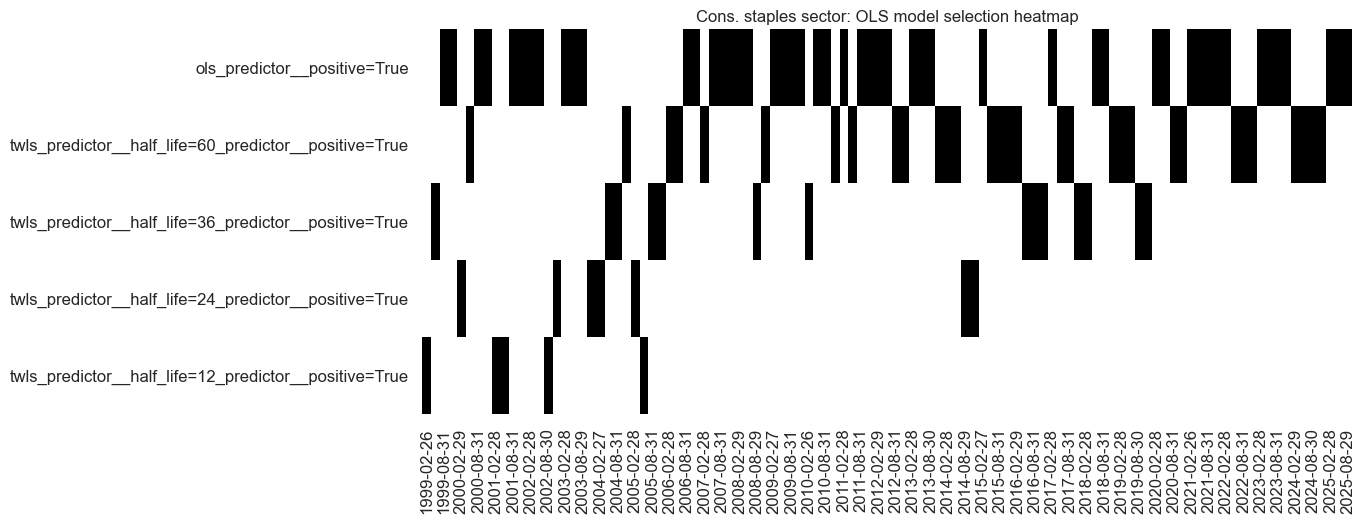
sigx = dix["signals"][-1]
trained_models[0].models_heatmap(
sigx,
cap=10,
figsize=(12, 5),
title=f"{sector_labels[sec.upper()]} sector: OLS model selection heatmap",
)
trained_models[0].coefs_stackedbarplot(
name=sigx,
figsize=(12, 5),
ftrs_renamed=rnf_labels,
title=f"{sector_labels[sec.upper()]}: OLS annual averages of most important feature coefficients",
)
Signal quality check #
dix = cos_dict

cidx = dix["cidx"]
sec = dix["name"]
sigs = dix["signals"]
ret = dix["ret"]
freq = dix["freq"]
blax = dix["black"]

catregs = {
    x: msp.CategoryRelations(
        df=dfx,
        xcats=[x, ret],
        cids=cidx,
        freq=freq,
        lag=1,
        blacklist=blax,
        xcat_aggs=["last", "sum"],
        slip=1,
    )
    for x in sigs
}

dix["catregs"] = catregs
dix = cos_dict
catregs = dix["catregs"]
sigs = dix["signals"]
name = dix["name"]

msv.multiple_reg_scatter(
    cat_rels=list(catregs.values()),
    ncol=2,
    nrow=1,
    figsize=(15, 6),
    title=name,
    title_xadj=0.5,
    title_yadj=0.99,
    title_fontsize=20,
    xlab=None,
    ylab=None,
    coef_box="lower right",
    prob_est="map",
    single_chart=True,
    subplot_titles=list(sigs),
)
Naive PnL #
dix = cos_dict

cidx = dix["cidx"]
sigs = dix["signals"]
ret = dix["ret"]
freq = dix["freq"]
blax = dix["black"]

pnl = msn.NaivePnL(
    df=dfx,
    ret=ret,
    sigs=sigs,
    cids=cidx,
    start=default_start_date,
    blacklist=blax,
    bms=["USD_EQXR_NSA"],
)

for sig in sigs:
    pnl.make_pnl(
        sig=sig,
        sig_op="zn_score_pan",
        rebal_freq="monthly",
        neutral="zero",
        rebal_slip=1,
        vol_scale = None,
        thresh=3,
        pnl_name=f"PNL_{sig}_PZN" if sig != "MACROvGLB_ZN" else f"PNL_{sig}{dix['sec']}_PZN",
    )

dix["pnls"] = pnl
dix = cos_dict

pnl = dix["pnls"]
name = dix["name"]
sigs = dix["signals"]
pns = [f"PNL_{sig}_PZN" if sig != "MACROvGLB_ZN" else f"PNL_{sig}{dix['sec']}_PZN" for sig in sigs]

pnl.plot_pnls(
    pnl_cats=pnl.pnl_names,
    title=f"{name} sector: naive PnLs of local positions versus global basket",
    xcat_labels=["Conceptual parity", "Statistical learning"],
    title_fontsize=14
)

display(pnl.evaluate_pnls(pnl_cats=pnl.pnl_names))
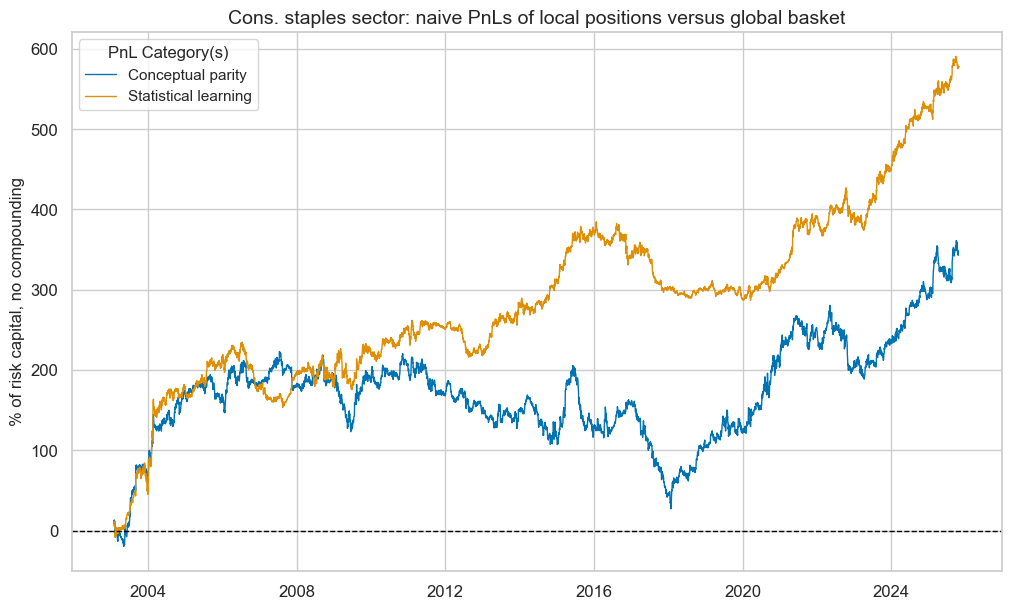
| xcat | PNL_MACROvGLB_ZNCOS_PZN | PNL_OLS-TWLSCOS_PZN |
|---|---|---|
| Return % | 15.291468 | 25.388439 |
| St. Dev. % | 45.045317 | 37.742201 |
| Sharpe Ratio | 0.339469 | 0.67268 |
| Sortino Ratio | 0.495717 | 1.004451 |
| Max 21-Day Draw % | -46.114335 | -35.696329 |
| Max 6-Month Draw % | -84.52275 | -55.48653 |
| Peak to Trough Draw % | -195.831982 | -97.569174 |
| Top 5% Monthly PnL Share | 1.347504 | 0.596578 |
| USD_EQXR_NSA correl | -0.013568 | 0.015257 |
| Traded Months | 274 | 274 |
Healthcare sector #
Specify analysis #
sector = "HLC"

hlc_dict = {
    "sec": sector,
    "name": sector_labels[sector],
    "factors": rn_factors,
    "cidx": cids_eqx,
    "ret": f"EQC{sector}{default_target_type}",
    "freq": "M",
    "black": sector_blacklist[sector],
    "models": None,
    "signals": None,
    "catregs": None,
    "pnls": None,
}
General learning models and signals #
dix = hlc_dict

sec = dix["sec"]
factors = dix["factors"]
ret = dix["ret"]
cidx = dix["cidx"]
freq = dix["freq"]
blax = dix["black"]

trained_models = {}
for pair in model_and_grids:

    model, grid = pair

    opt_pipeline_name = '-'.join(list(model.keys()))
    signal_name = opt_pipeline_name.upper() + sec.upper()

    print(
        f"Running the signal learning for {opt_pipeline_name} over {sec} returns."
    )

    trained_models[signal_name] = run_single_signal_optimizer(
        df=dfx,
        xcats=factors + [ret],
        cids=cidx,
        blacklist=blax,
        signal_freq=freq,
        signal_name=signal_name,
        models=model,
        hyperparameters=grid,
        learning_config=default_learn_config,
    )

    dfa = trained_models[signal_name].get_optimized_signals()
    dfx = msm.update_df(dfx, dfa)

dix["models"] = trained_models.values()
dix["signals"] = ["MACROvGLB_ZN"] + list(trained_models.keys())
Running the signal learning for ols-twls over HLC returns.
dix = hlc_dict
sec = dix["sec"]
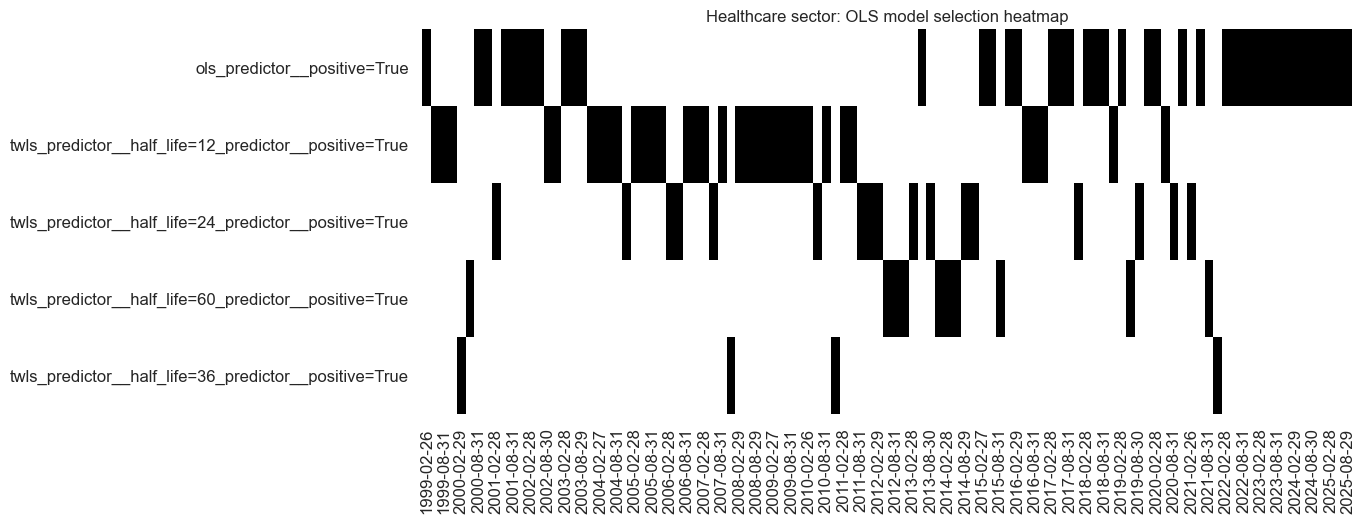
trained_models = list(dix["models"])
sigx = dix["signals"][-1]
trained_models[0].models_heatmap(
sigx,
cap=10,
figsize=(12, 5),
title=f"{sector_labels[sec.upper()]} sector: OLS model selection heatmap",
)
trained_models[0].coefs_stackedbarplot(
name=sigx,
figsize=(12, 5),
ftrs_renamed=rnf_labels,
title=f"{sector_labels[sec.upper()]}: OLS annual averages of most important feature coefficients",
)
Signal quality check #
dix = hlc_dict

cidx = dix["cidx"]
sec = dix["name"]
sigs = dix["signals"]
ret = dix["ret"]
freq = dix["freq"]
blax = dix["black"]

catregs = {
    x: msp.CategoryRelations(
        df=dfx,
        xcats=[x, ret],
        cids=cidx,
        freq=freq,
        lag=1,
        blacklist=blax,
        xcat_aggs=["last", "sum"],
        slip=1,
    )
    for x in sigs
}

dix["catregs"] = catregs
dix = hlc_dict
catregs = dix["catregs"]
sigs = dix["signals"]
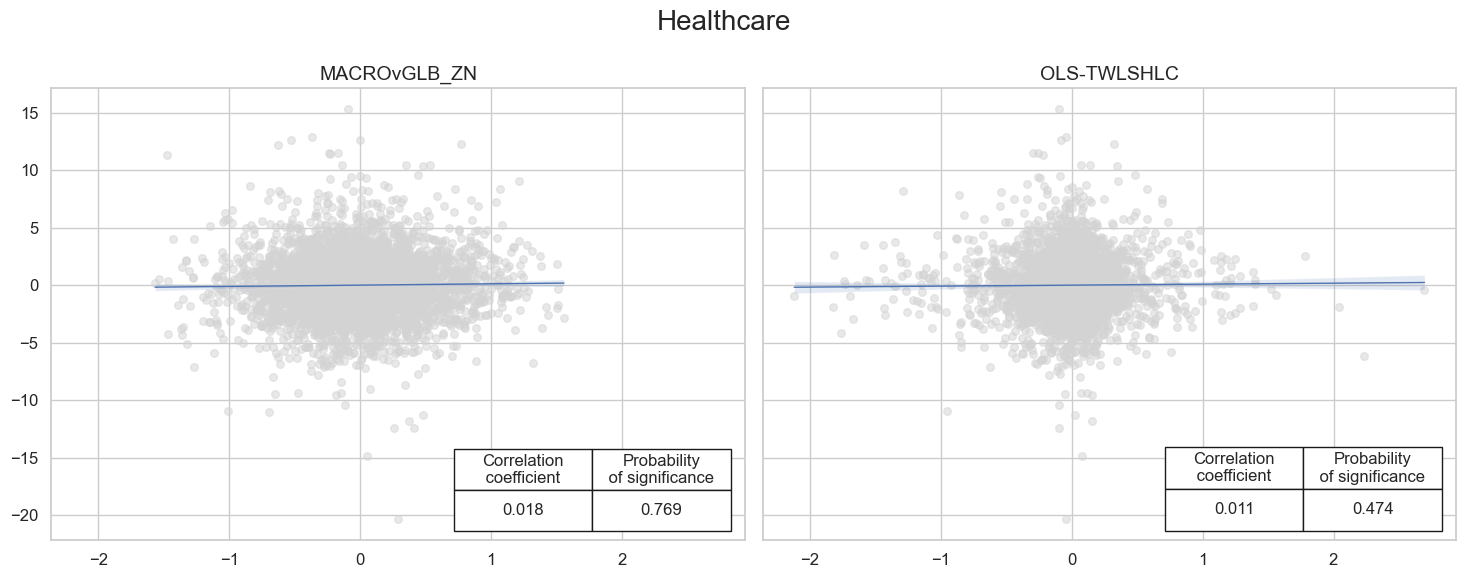
name = dix["name"]
msv.multiple_reg_scatter(
cat_rels=list(catregs.values()),
ncol=2,
nrow=1,
figsize=(15, 6),
title=name,
title_xadj=0.5,
title_yadj=0.99,
title_fontsize=20,
xlab=None,
ylab=None,
coef_box="lower right",
prob_est="map",
single_chart=True,
subplot_titles=list(sigs),
)
Naive PnL #
dix = hlc_dict

cidx = dix["cidx"]
sigs = dix["signals"]
ret = dix["ret"]
freq = dix["freq"]
blax = dix["black"]

pnl = msn.NaivePnL(
    df=dfx,
    ret=ret,
    sigs=sigs,
    cids=cidx,
    start=default_start_date,
    blacklist=blax,
    bms=["USD_EQXR_NSA"],
)

for sig in sigs:
    pnl.make_pnl(
        sig=sig,
        sig_op="zn_score_pan",
        rebal_freq="monthly",
        neutral="zero",
        rebal_slip=1,
        vol_scale = None,
        thresh=3,
        pnl_name=f"PNL_{sig}_PZN" if sig != "MACROvGLB_ZN" else f"PNL_{sig}{dix['sec']}_PZN",
    )

dix["pnls"] = pnl
dix = hlc_dict

pnl = dix["pnls"]
name = dix["name"]
sigs = dix["signals"]
pns = [f"PNL_{sig}_PZN" if sig != "MACROvGLB_ZN" else f"PNL_{sig}{dix['sec']}_PZN" for sig in sigs]

pnl.plot_pnls(
    pnl_cats=pnl.pnl_names,
    title=f"{name} sector: naive PnLs of local positions versus global basket",
    title_fontsize=14
)

display(pnl.evaluate_pnls(pnl_cats=pnl.pnl_names))
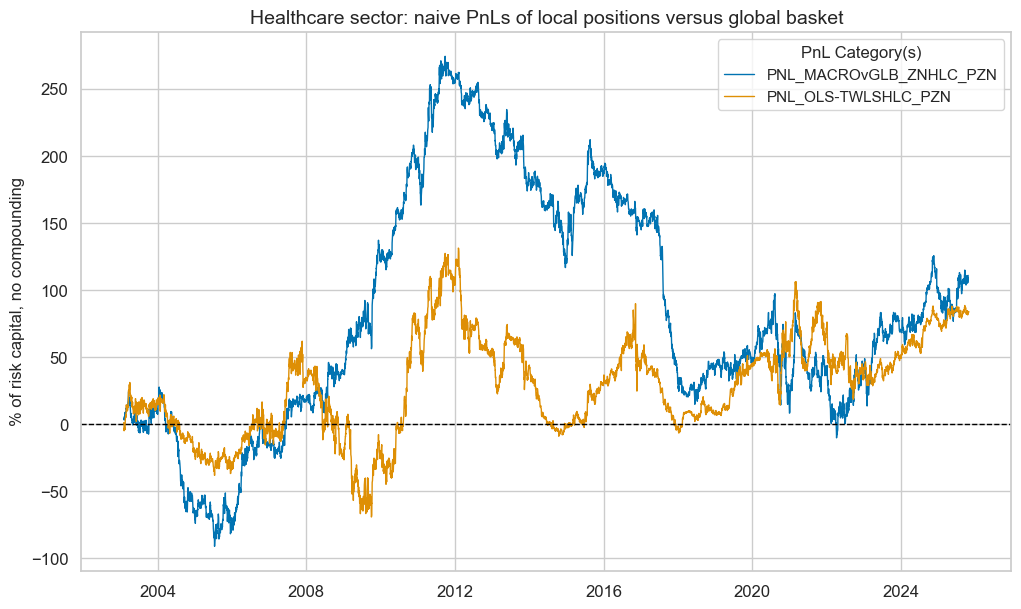
| xcat | PNL_MACROvGLB_ZNHLC_PZN | PNL_OLS-TWLSHLC_PZN |
|---|---|---|
| Return % | 4.886817 | 3.684732 |
| St. Dev. % | 45.292451 | 45.547477 |
| Sharpe Ratio | 0.107895 | 0.080899 |
| Sortino Ratio | 0.153702 | 0.113127 |
| Max 21-Day Draw % | -53.646324 | -57.249336 |
| Max 6-Month Draw % | -109.951493 | -74.039801 |
| Peak to Trough Draw % | -284.419265 | -140.247361 |
| Top 5% Monthly PnL Share | 3.722202 | 4.323893 |
| USD_EQXR_NSA correl | 0.019442 | 0.040641 |
| Traded Months | 274 | 274 |
Financials sector #
Specify analysis #
sector = "FIN"

fin_dict = {
    "sec": sector,
    "name": sector_labels[sector],
    "factors": rn_factors,
    "cidx": cids_eqx,
    "ret": f"EQC{sector}{default_target_type}",
    "freq": "M",
    "black": sector_blacklist[sector],
    "models": None,
    "signals": None,
    "catregs": None,
    "pnls": None,
}
General learning models and signals #
dix = fin_dict

sec = dix["sec"]
factors = dix["factors"]
ret = dix["ret"]
cidx = dix["cidx"]
freq = dix["freq"]
blax = dix["black"]

trained_models = {}
for pair in model_and_grids:

    model, grid = pair

    opt_pipeline_name = '-'.join(list(model.keys()))
    signal_name = opt_pipeline_name.upper() + sec.upper()

    print(
        f"Running the signal learning for {opt_pipeline_name} over {sec} returns."
    )

    trained_models[signal_name] = run_single_signal_optimizer(
        df=dfx,
        xcats=factors + [ret],
        cids=cidx,
        blacklist=blax,
        signal_freq=freq,
        signal_name=signal_name,
        models=model,
        hyperparameters=grid,
        learning_config=default_learn_config,
    )

    dfa = trained_models[signal_name].get_optimized_signals()
    dfx = msm.update_df(dfx, dfa)

dix["models"] = trained_models.values()
dix["signals"] = ["MACROvGLB_ZN"] + list(trained_models.keys())
Running the signal learning for ols-twls over FIN returns.
dix = fin_dict
sec = dix["sec"]
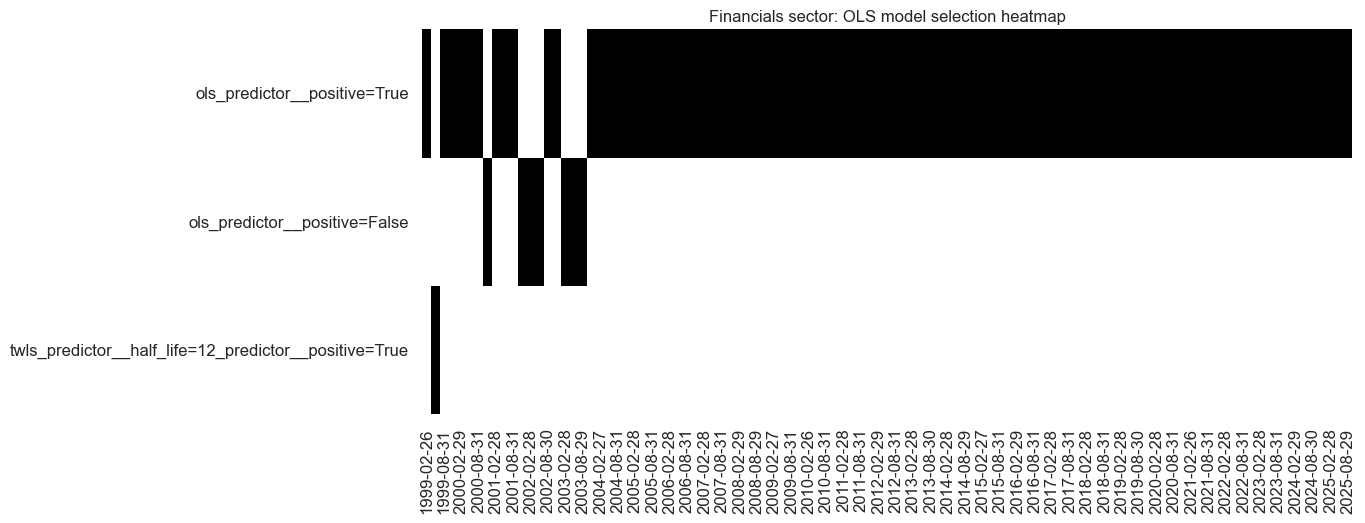
trained_models = list(dix["models"])
sigx = dix["signals"][-1]
trained_models[0].models_heatmap(
sigx,
cap=10,
figsize=(12, 5),
title=f"{sector_labels[sec.upper()]} sector: OLS model selection heatmap",
)
trained_models[0].coefs_stackedbarplot(
name=sigx,
figsize=(12, 5),
ftrs_renamed=rnf_labels,
title=f"{sector_labels[sec.upper()]}: OLS annual averages of most important feature coefficients",
)
Signal quality check #
dix = fin_dict

cidx = dix["cidx"]
sec = dix["name"]
sigs = dix["signals"]
ret = dix["ret"]
freq = dix["freq"]
blax = dix["black"]

catregs = {
    x: msp.CategoryRelations(
        df=dfx,
        xcats=[x, ret],
        cids=cidx,
        freq=freq,
        lag=1,
        blacklist=blax,
        xcat_aggs=["last", "sum"],
        slip=1,
    )
    for x in sigs
}

dix["catregs"] = catregs
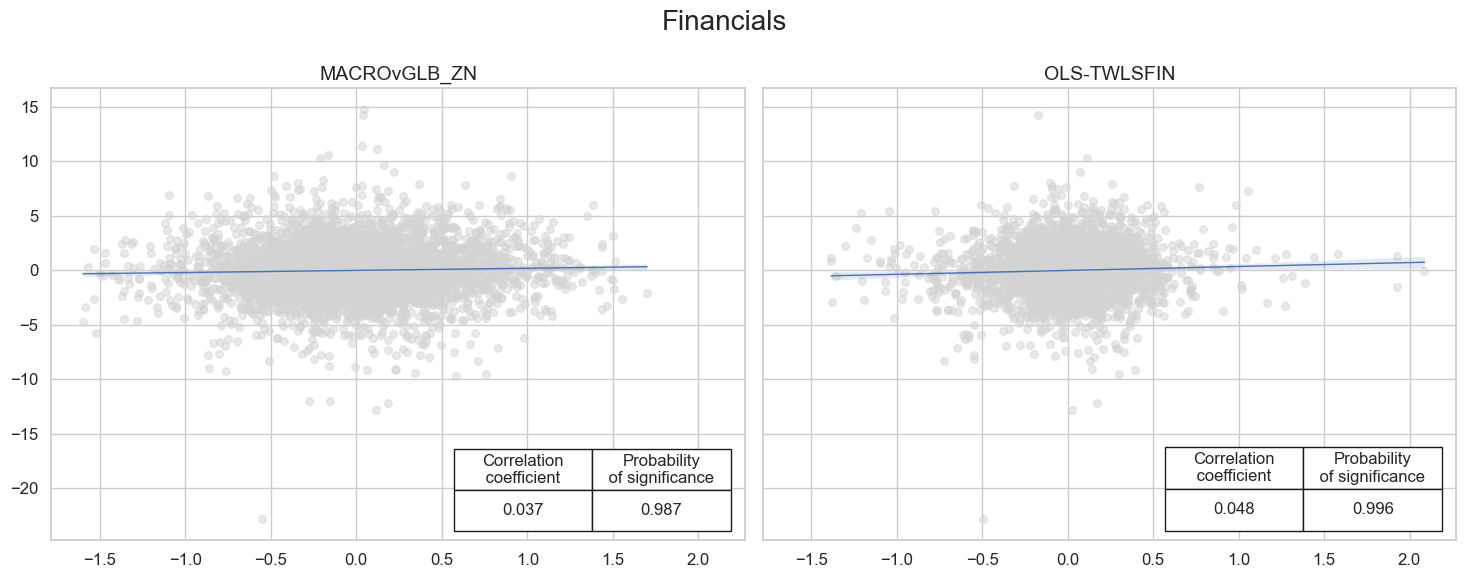
dix = fin_dict
catregs = dix["catregs"]
sigs = dix["signals"]
name = dix["name"]

msv.multiple_reg_scatter(
    cat_rels=list(catregs.values()),
    ncol=2,
    nrow=1,
    figsize=(15, 6),
    title=name,
    title_xadj=0.5,
    title_yadj=0.99,
    title_fontsize=20,
    xlab=None,
    ylab=None,
    coef_box="lower right",
    prob_est="map",
    single_chart=True,
    subplot_titles=list(sigs),
)
Naive PnL #
dix = fin_dict

cidx = dix["cidx"]
sigs = dix["signals"]
ret = dix["ret"]
freq = dix["freq"]
blax = dix["black"]

pnl = msn.NaivePnL(
    df=dfx,
    ret=ret,
    sigs=sigs,
    cids=cidx,
    start=default_start_date,
    blacklist=blax,
    bms=["USD_EQXR_NSA"],
)

for sig in sigs:
    pnl.make_pnl(
        sig=sig,
        sig_op="zn_score_pan",
        rebal_freq="monthly",
        neutral="zero",
        rebal_slip=1,
        vol_scale = None,
        thresh=3,
        pnl_name=f"PNL_{sig}_PZN" if sig != "MACROvGLB_ZN" else f"PNL_{sig}{dix['sec']}_PZN",
    )

dix["pnls"] = pnl
dix = fin_dict

pnl = dix["pnls"]
name = dix["name"]
sigs = dix["signals"]
pns = [f"PNL_{sig}_PZN" if sig != "MACROvGLB_ZN" else f"PNL_{sig}{dix['sec']}_PZN" for sig in sigs]

pnl.plot_pnls(
    pnl_cats=pnl.pnl_names,
    title=f"{name} sector: naive PnLs of local positions versus global basket",
    title_fontsize=14
)

display(pnl.evaluate_pnls(pnl_cats=pnl.pnl_names))
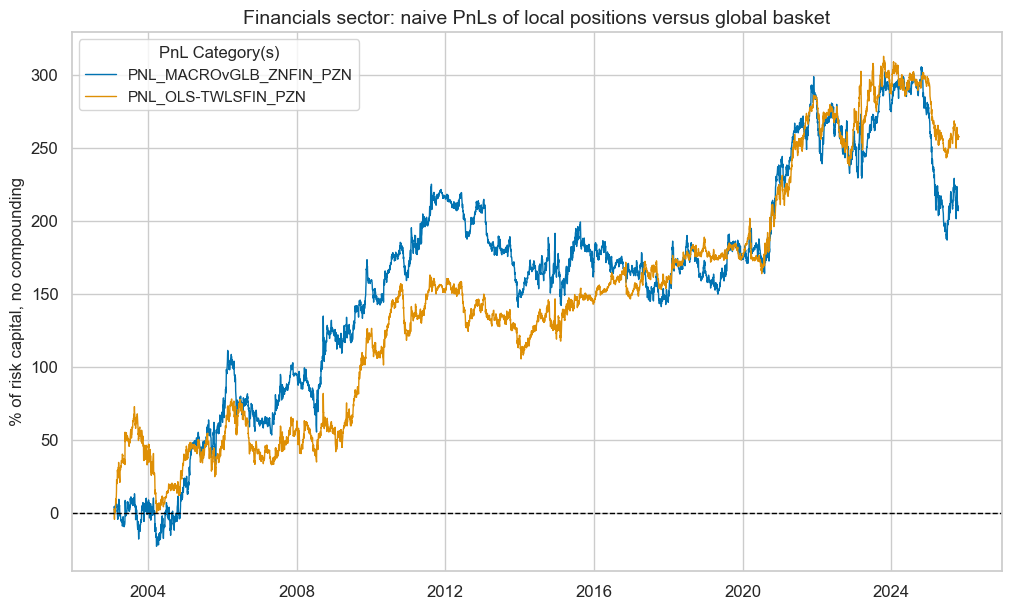
| xcat | PNL_MACROvGLB_ZNFIN_PZN | PNL_OLS-TWLSFIN_PZN |
|---|---|---|
| Return % | 9.201175 | 11.328661 |
| St. Dev. % | 40.842713 | 33.78644 |
| Sharpe Ratio | 0.225283 | 0.335302 |
| Sortino Ratio | 0.319887 | 0.478963 |
| Max 21-Day Draw % | -38.253131 | -43.661927 |
| Max 6-Month Draw % | -96.430697 | -56.425875 |
| Peak to Trough Draw % | -118.754158 | -73.033189 |
| Top 5% Monthly PnL Share | 1.391762 | 0.997065 |
| USD_EQXR_NSA correl | -0.040145 | -0.006025 |
| Traded Months | 274 | 274 |
Technology sector #
Specify analysis #
sector = "ITE"

ite_dict = {
    "sec": sector,
    "name": sector_labels[sector],
    "factors": rn_factors,
    "cidx": cids_eqx,
    "ret": f"EQC{sector}{default_target_type}",
    "freq": "M",
    "black": sector_blacklist[sector],
    "models": None,
    "signals": None,
    "catregs": None,
    "pnls": None,
}
General learning models and signals #
dix = ite_dict

sec = dix["sec"]
factors = dix["factors"]
ret = dix["ret"]
cidx = dix["cidx"]
freq = dix["freq"]
blax = dix["black"]

trained_models = {}
for pair in model_and_grids:

    model, grid = pair

    opt_pipeline_name = '-'.join(list(model.keys()))
    signal_name = opt_pipeline_name.upper() + sec.upper()

    print(
        f"Running the signal learning for {opt_pipeline_name} over {sec} returns."
    )

    trained_models[signal_name] = run_single_signal_optimizer(
        df=dfx,
        xcats=factors + [ret],
        cids=cidx,
        blacklist=blax,
        signal_freq=freq,
        signal_name=signal_name,
        models=model,
        hyperparameters=grid,
        learning_config=default_learn_config,
    )

    dfa = trained_models[signal_name].get_optimized_signals()
    dfx = msm.update_df(dfx, dfa)

dix["models"] = trained_models.values()
dix["signals"] = ["MACROvGLB_ZN"] + list(trained_models.keys())
Running the signal learning for ols-twls over ITE returns.
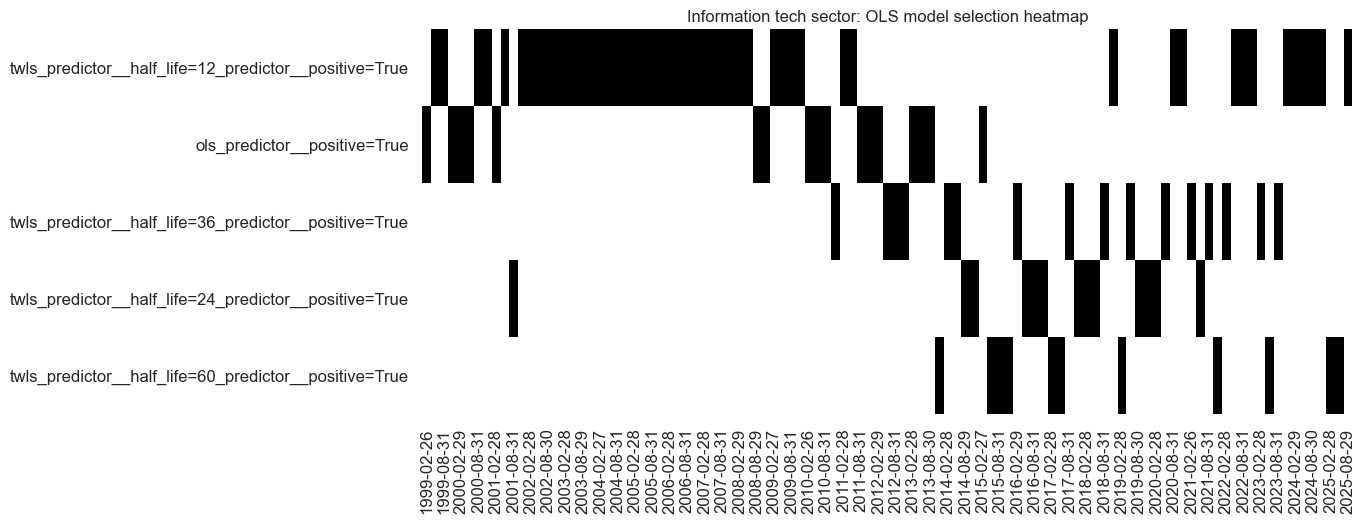
dix = ite_dict

sec = dix["sec"]
trained_models = list(dix["models"])
sigx = dix["signals"][-1]

trained_models[0].models_heatmap(
    sigx,
    cap=10,
    figsize=(12, 5),
    title=f"{sector_labels[sec.upper()]} sector: OLS model selection heatmap",
)

trained_models[0].coefs_stackedbarplot(
    name=sigx,
    figsize=(12, 5),
    ftrs_renamed=rnf_labels,
    title=f"{sector_labels[sec.upper()]}: OLS annual averages of most important feature coefficients",
)
Signal quality check #
dix = ite_dict

cidx = dix["cidx"]
sec = dix["name"]
sigs = dix["signals"]
ret = dix["ret"]
freq = dix["freq"]
blax = dix["black"]

catregs = {
    x: msp.CategoryRelations(
        df=dfx,
        xcats=[x, ret],
        cids=cidx,
        freq=freq,
        lag=1,
        blacklist=blax,
        xcat_aggs=["last", "sum"],
        slip=1,
    )
    for x in sigs
}

dix["catregs"] = catregs
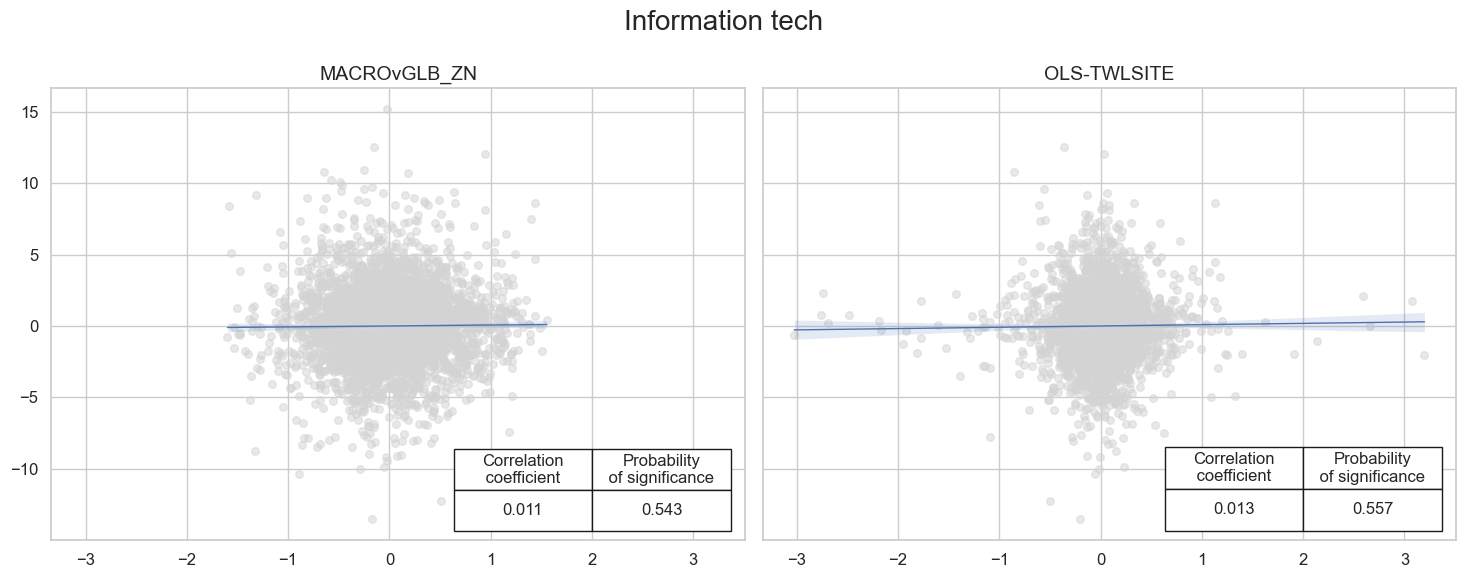
dix = ite_dict
catregs = dix["catregs"]
sigs = dix["signals"]
name = dix["name"]

msv.multiple_reg_scatter(
    cat_rels=list(catregs.values()),
    ncol=2,
    nrow=1,
    figsize=(15, 6),
    title=name,
    title_xadj=0.5,
    title_yadj=0.99,
    title_fontsize=20,
    xlab=None,
    ylab=None,
    coef_box="lower right",
    prob_est="map",
    single_chart=True,
    subplot_titles=list(sigs),
)
Naive PnL #
dix = ite_dict

cidx = dix["cidx"]
sigs = dix["signals"]
ret = dix["ret"]
freq = dix["freq"]
blax = dix["black"]

pnl = msn.NaivePnL(
    df=dfx,
    ret=ret,
    sigs=sigs,
    cids=cidx,
    start=default_start_date,
    blacklist=blax,
    bms=["USD_EQXR_NSA"],
)

for sig in sigs:
    pnl.make_pnl(
        sig=sig,
        sig_op="zn_score_pan",
        rebal_freq="monthly",
        neutral="zero",
        rebal_slip=1,
        vol_scale = None,
        thresh=3,
        pnl_name=f"PNL_{sig}_PZN" if sig != "MACROvGLB_ZN" else f"PNL_{sig}{dix['sec']}_PZN",
    )

dix["pnls"] = pnl
dix = ite_dict

pnl = dix["pnls"]
name = dix["name"]
sigs = dix["signals"]
pns = [f"PNL_{sig}_PZN" if sig != "MACROvGLB_ZN" else f"PNL_{sig}{dix['sec']}_PZN" for sig in sigs]

pnl.plot_pnls(
    pnl_cats=pnl.pnl_names,
    title=f"{name} sector: naive PnLs of local positions versus global basket",
    title_fontsize=14
)

display(pnl.evaluate_pnls(pnl_cats=pnl.pnl_names))
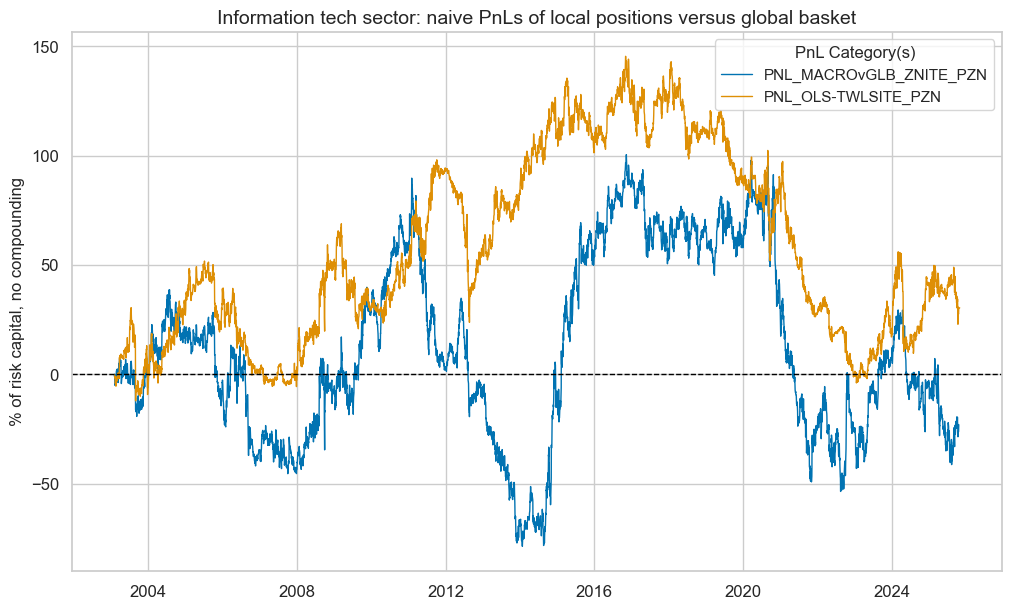
| xcat | PNL_MACROvGLB_ZNITE_PZN | PNL_OLS-TWLSITE_PZN |
|---|---|---|
| Return % | -1.014094 | 1.335763 |
| St. Dev. % | 42.057008 | 33.455673 |
| Sharpe Ratio | -0.024112 | 0.039926 |
| Sortino Ratio | -0.03425 | 0.055766 |
| Max 21-Day Draw % | -52.754048 | -44.168924 |
| Max 6-Month Draw % | -86.461582 | -64.409458 |
| Peak to Trough Draw % | -168.253562 | -149.278348 |
| Top 5% Monthly PnL Share | -15.310302 | 7.673984 |
| USD_EQXR_NSA correl | -0.018919 | 0.014202 |
| Traded Months | 274 | 274 |
Communication services sector #
Specify analysis #
sector = "CSR"

csr_dict = {
    "sec": sector,
    "name": sector_labels[sector],
    "factors": rn_factors,
    "cidx": cids_eqx,
    "ret": f"EQC{sector}{default_target_type}",
    "freq": "M",
    "black": sector_blacklist[sector],
    "models": None,
    "signals": None,
    "catregs": None,
    "pnls": None,
}
General learning models and signals #
dix = csr_dict

sec = dix["sec"]
factors = dix["factors"]
ret = dix["ret"]
cidx = dix["cidx"]
freq = dix["freq"]
blax = dix["black"]

trained_models = {}
for pair in model_and_grids:

    model, grid = pair

    opt_pipeline_name = '-'.join(list(model.keys()))
    signal_name = opt_pipeline_name.upper() + sec.upper()

    print(
        f"Running the signal learning for {opt_pipeline_name} over {sec} returns."
    )

    trained_models[signal_name] = run_single_signal_optimizer(
        df=dfx,
        xcats=factors + [ret],
        cids=cidx,
        blacklist=blax,
        signal_freq=freq,
        signal_name=signal_name,
        models=model,
        hyperparameters=grid,
        learning_config=default_learn_config,
    )

    dfa = trained_models[signal_name].get_optimized_signals()
    dfx = msm.update_df(dfx, dfa)

dix["models"] = trained_models.values()
dix["signals"] = ["MACROvGLB_ZN"] + list(trained_models.keys())
Running the signal learning for ols-twls over CSR returns.
dix = csr_dict
sec = dix["sec"]
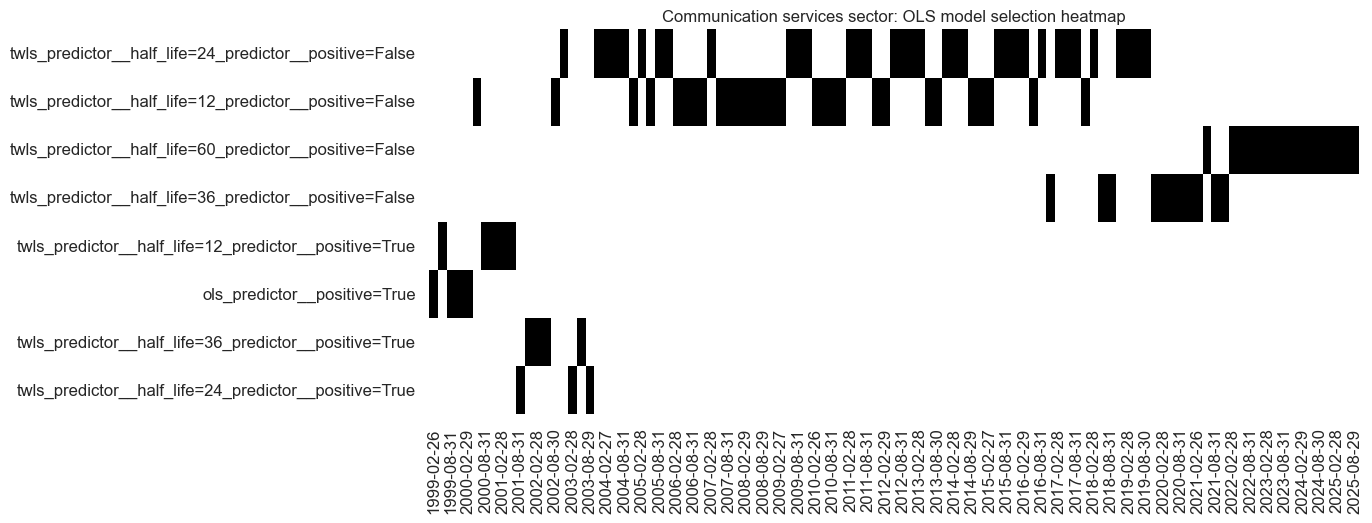
trained_models = list(dix["models"])
sigx = dix["signals"][-1]
trained_models[0].models_heatmap(
sigx,
cap=10,
figsize=(12, 5),
title=f"{sector_labels[sec.upper()]} sector: OLS model selection heatmap",
)
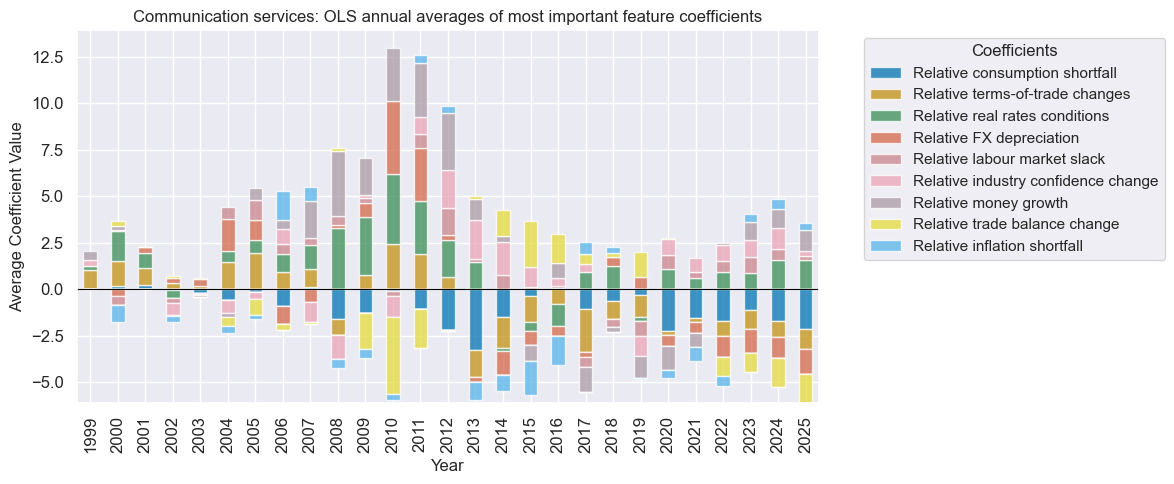
trained_models[0].coefs_stackedbarplot(
name=sigx,
figsize=(12, 5),
ftrs_renamed=rnf_labels,
title=f"{sector_labels[sec.upper()]}: OLS annual averages of most important feature coefficients",
)
Signal quality check #
dix = csr_dict

cidx = dix["cidx"]
sec = dix["name"]
sigs = dix["signals"]
ret = dix["ret"]
freq = dix["freq"]
blax = dix["black"]

catregs = {
    x: msp.CategoryRelations(
        df=dfx,
        xcats=[x, ret],
        cids=cidx,
        freq=freq,
        lag=1,
        blacklist=blax,
        xcat_aggs=["last", "sum"],
        slip=1,
    )
    for x in sigs
}

dix["catregs"] = catregs
dix = csr_dict
catregs = dix["catregs"]
sigs = dix["signals"]
name = dix["name"]
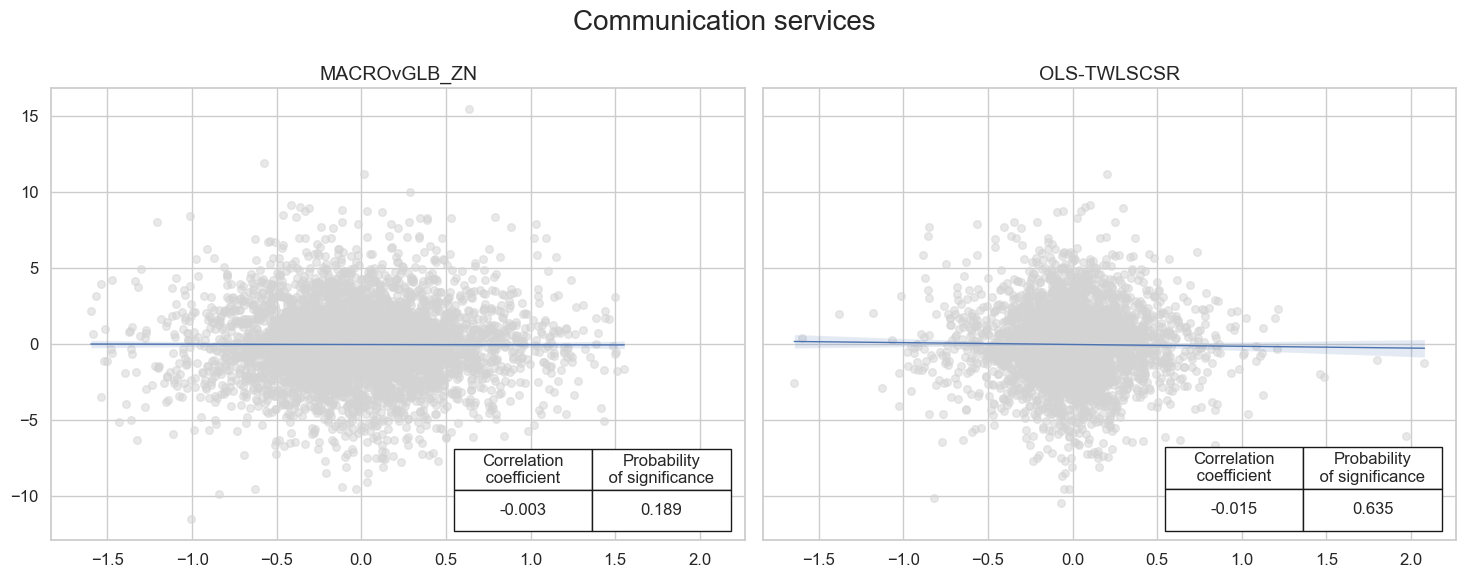
msv.multiple_reg_scatter(
cat_rels=list(catregs.values()),
ncol=2,
nrow=1,
figsize=(15, 6),
title=name,
title_xadj=0.5,
title_yadj=0.99,
title_fontsize=20,
xlab=None,
ylab=None,
coef_box="lower right",
prob_est="map",
single_chart=True,
subplot_titles=list(sigs),
)
Naive PnL #
dix = csr_dict

cidx = dix["cidx"]
sigs = dix["signals"]
ret = dix["ret"]
freq = dix["freq"]
blax = dix["black"]

pnl = msn.NaivePnL(
    df=dfx,
    ret=ret,
    sigs=sigs,
    cids=cidx,
    start=default_start_date,
    blacklist=blax,
    bms=["USD_EQXR_NSA"],
)

for sig in sigs:
    pnl.make_pnl(
        sig=sig,
        sig_op="zn_score_pan",
        rebal_freq="monthly",
        neutral="zero",
        rebal_slip=1,
        vol_scale = None,
        thresh=3,
        pnl_name=f"PNL_{sig}_PZN" if sig != "MACROvGLB_ZN" else f"PNL_{sig}{dix['sec']}_PZN",
    )

dix["pnls"] = pnl
dix = csr_dict

pnl = dix["pnls"]
name = dix["name"]
sigs = dix["signals"]
pns = [f"PNL_{sig}_PZN" if sig != "MACROvGLB_ZN" else f"PNL_{sig}{dix['sec']}_PZN" for sig in sigs]

pnl.plot_pnls(
    pnl_cats=pnl.pnl_names,
    title=f"{name} sector: naive PnLs of local positions versus global basket",
    title_fontsize=14
)

display(pnl.evaluate_pnls(pnl_cats=pnl.pnl_names))
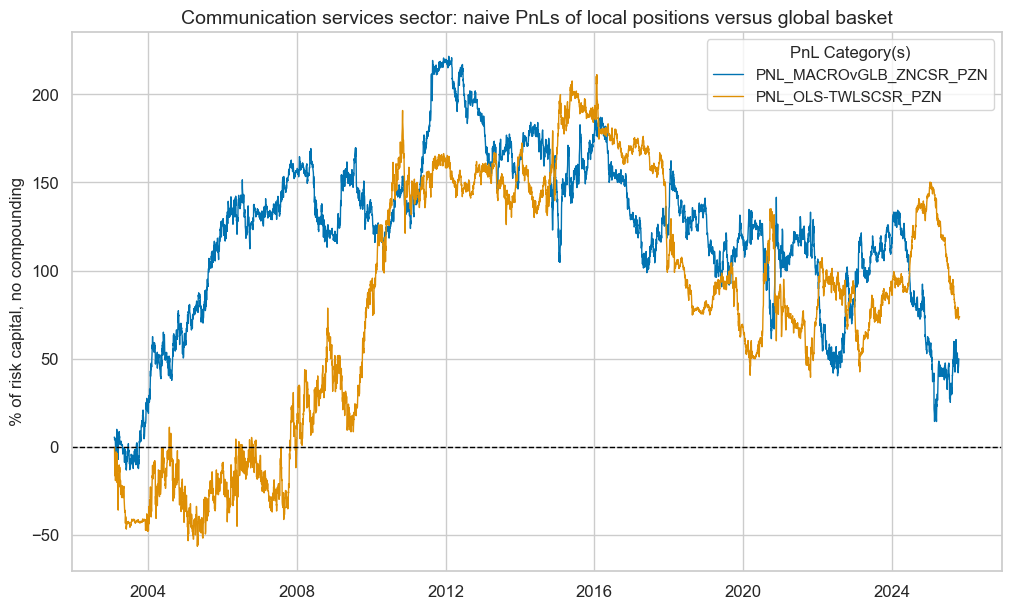
| xcat | PNL_MACROvGLB_ZNCSR_PZN | PNL_OLS-TWLSCSR_PZN |
|---|---|---|
| Return % | 2.198786 | 3.24321 |
| St. Dev. % | 44.24086 | 48.44563 |
| Sharpe Ratio | 0.0497 | 0.066945 |
| Sortino Ratio | 0.070231 | 0.09418 |
| Max 21-Day Draw % | -45.145047 | -56.310718 |
| Max 6-Month Draw % | -81.697583 | -65.566034 |
| Peak to Trough Draw % | -207.270983 | -171.721941 |
| Top 5% Monthly PnL Share | 7.042456 | 4.883788 |
| USD_EQXR_NSA correl | -0.002251 | 0.075546 |
| Traded Months | 274 | 274 |
Utilities sector #
Specify analysis #
sector = "UTL"

utl_dict = {
    "sec": sector,
    "name": sector_labels[sector],
    "factors": rn_factors,
    "cidx": cids_eqx,
    "ret": f"EQC{sector}{default_target_type}",
    "freq": "M",
    "black": sector_blacklist[sector],
    "models": None,
    "signals": None,
    "catregs": None,
    "pnls": None,
}
General learning models and signals #
dix = utl_dict

sec = dix["sec"]
factors = dix["factors"]
ret = dix["ret"]
cidx = dix["cidx"]
freq = dix["freq"]
blax = dix["black"]

trained_models = {}
for pair in model_and_grids:

    model, grid = pair

    opt_pipeline_name = '-'.join(list(model.keys()))
    signal_name = opt_pipeline_name.upper() + sec.upper()

    print(
        f"Running the signal learning for {opt_pipeline_name} over {sec} returns."
    )

    trained_models[signal_name] = run_single_signal_optimizer(
        df=dfx,
        xcats=factors + [ret],
        cids=cidx,
        blacklist=blax,
        signal_freq=freq,
        signal_name=signal_name,
        models=model,
        hyperparameters=grid,
        learning_config=default_learn_config,
    )

    dfa = trained_models[signal_name].get_optimized_signals()
    dfx = msm.update_df(dfx, dfa)

dix["models"] = trained_models.values()
dix["signals"] = ["MACROvGLB_ZN"] + list(trained_models.keys())
Running the signal learning for ols-twls over UTL returns.
dix = utl_dict

sec = dix["sec"]
trained_models = list(dix["models"])
sigx = dix["signals"][-1]

trained_models[0].models_heatmap(
    sigx,
    cap=10,
    figsize=(12, 5),
    title=f"{sector_labels[sec.upper()]} sector: OLS model selection heatmap",
)

trained_models[0].coefs_stackedbarplot(
    name=sigx,
    figsize=(12, 5),
    ftrs_renamed=rnf_labels,
    title=f"{sector_labels[sec.upper()]}: OLS annual averages of most important feature coefficients",
)

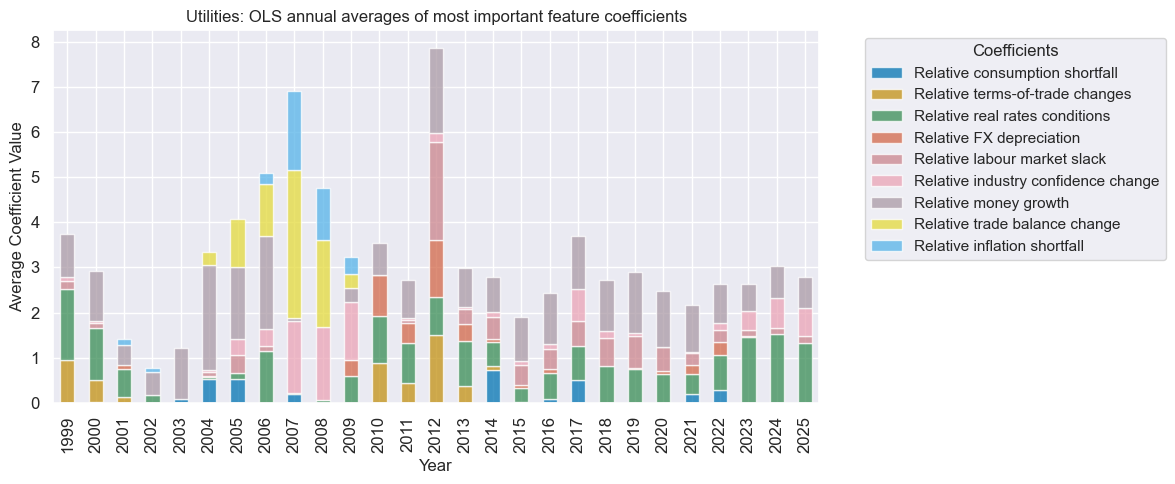
Signal quality check #
dix = utl_dict

cidx = dix["cidx"]
sec = dix["name"]
sigs = dix["signals"]
ret = dix["ret"]
freq = dix["freq"]
blax = dix["black"]

catregs = {
    x: msp.CategoryRelations(
        df=dfx,
        xcats=[x, ret],
        cids=cidx,
        freq=freq,
        lag=1,
        blacklist=blax,
        xcat_aggs=["last", "sum"],
        slip=1,
    )
    for x in sigs
}

dix["catregs"] = catregs
dix = utl_dict
catregs = dix["catregs"]
sigs = dix["signals"]
name = dix["name"]

msv.multiple_reg_scatter(
    cat_rels=list(catregs.values()),
    ncol=2,
    nrow=1,
    figsize=(15, 6),
    title=name,
    title_xadj=0.5,
    title_yadj=0.99,
    title_fontsize=20,
    xlab=None,
    ylab=None,
    coef_box="lower right",
    prob_est="map",
    single_chart=True,
    subplot_titles=list(sigs),
)
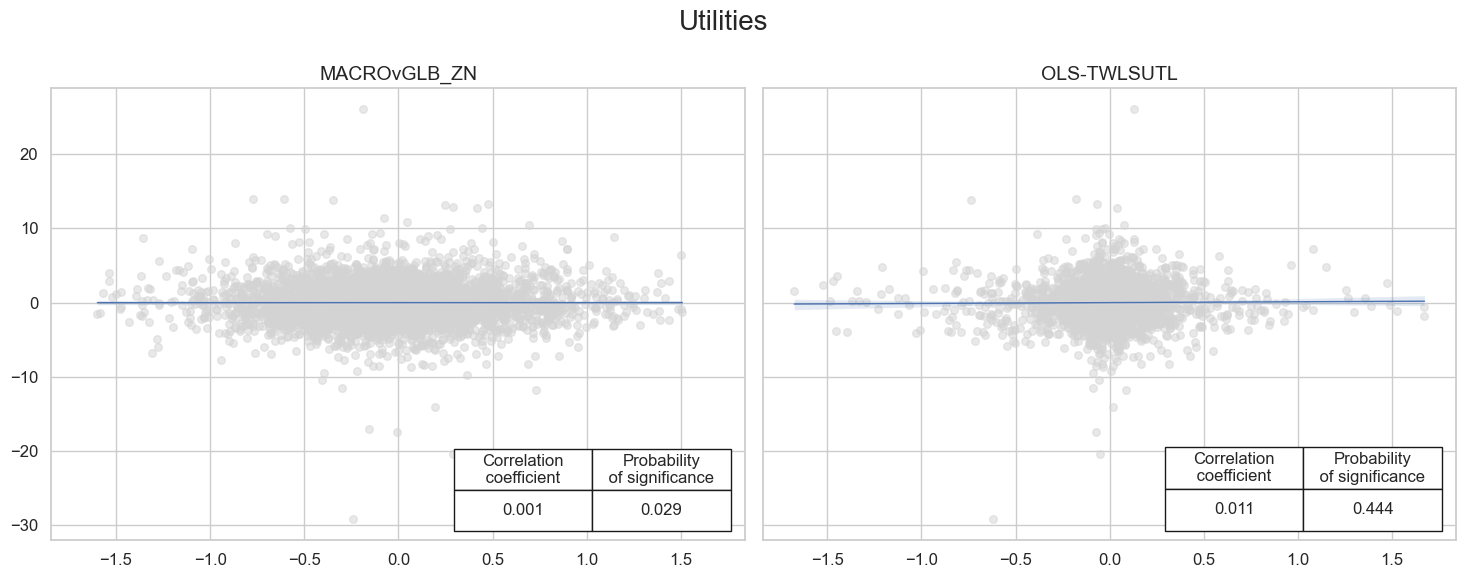
Naive PnL #
dix = utl_dict

cidx = dix["cidx"]
sigs = dix["signals"]
ret = dix["ret"]
freq = dix["freq"]
blax = dix["black"]

pnl = msn.NaivePnL(
    df=dfx,
    ret=ret,
    sigs=sigs,
    cids=cidx,
    start=default_start_date,
    blacklist=blax,
    bms=["USD_EQXR_NSA"],
)

for sig in sigs:
    pnl.make_pnl(
        sig=sig,
        sig_op="zn_score_pan",
        rebal_freq="monthly",
        neutral="zero",
        rebal_slip=1,
        vol_scale = None,
        thresh=3,
        pnl_name=f"PNL_{sig}_PZN" if sig != "MACROvGLB_ZN" else f"PNL_{sig}{dix['sec']}_PZN",
    )

dix["pnls"] = pnl
dix = utl_dict

pnl = dix["pnls"]
name = dix["name"]
sigs = dix["signals"]
pns = [f"PNL_{sig}_PZN" if sig != "MACROvGLB_ZN" else f"PNL_{sig}{dix['sec']}_PZN" for sig in sigs]

pnl.plot_pnls(
    pnl_cats=pnl.pnl_names,
    title=f"{name} sector: naive PnLs of local positions versus global basket",
    xcat_labels=["Conceptual parity", "Statistical learning"],
    title_fontsize=14
)

display(pnl.evaluate_pnls(pnl_cats=pnl.pnl_names))
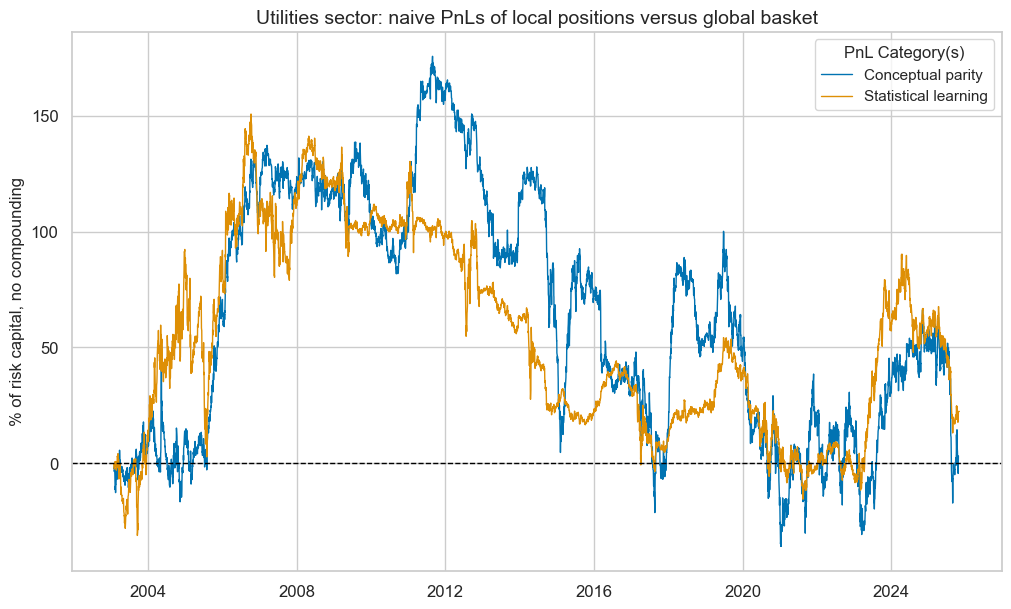
| xcat | PNL_MACROvGLB_ZNUTL_PZN | PNL_OLS-TWLSUTL_PZN |
|---|---|---|
| Return % | 0.14099 | 0.98475 |
| St. Dev. % | 43.997298 | 35.0977 |
| Sharpe Ratio | 0.003205 | 0.028057 |
| Sortino Ratio | 0.004581 | 0.040019 |
| Max 21-Day Draw % | -56.153044 | -49.280641 |
| Max 6-Month Draw % | -108.607231 | -68.007269 |
| Peak to Trough Draw % | -211.450009 | -166.218155 |
| Top 5% Monthly PnL Share | 105.661384 | 11.972938 |
| USD_EQXR_NSA correl | 0.010881 | 0.026812 |
| Traded Months | 274 | 274 |
Real estate sector #
Specify analysis #
sector = "REL"

rel_dict = {
    "sec": sector,
    "name": sector_labels[sector],
    "factors": rn_factors,
    "cidx": cids_eqx,
    "ret": f"EQC{sector}{default_target_type}",
    "freq": "M",
    "black": sector_blacklist[sector],
    "models": None,
    "signals": None,
    "catregs": None,
    "pnls": None,
}
General learning models and signals #
dix = rel_dict

sec = dix["sec"]
factors = dix["factors"]
ret = dix["ret"]
cidx = dix["cidx"]
freq = dix["freq"]
blax = dix["black"]

trained_models = {}
for pair in model_and_grids:

    model, grid = pair

    opt_pipeline_name = '-'.join(list(model.keys()))
    signal_name = opt_pipeline_name.upper() + sec.upper()

    print(
        f"Running the signal learning for {opt_pipeline_name} over {sec} returns."
    )

    trained_models[signal_name] = run_single_signal_optimizer(
        df=dfx,
        xcats=factors + [ret],
        cids=cidx,
        blacklist=blax,
        signal_freq=freq,
        signal_name=signal_name,
        models=model,
        hyperparameters=grid,
        learning_config=default_learn_config,
    )

    dfa = trained_models[signal_name].get_optimized_signals()
    dfx = msm.update_df(dfx, dfa)

dix["models"] = trained_models.values()
dix["signals"] = ["MACROvGLB_ZN"] + list(trained_models.keys())
Running the signal learning for ols-twls over REL returns.
dix = rel_dict

sec = dix["sec"]
trained_models = list(dix["models"])
sigx = dix["signals"][-1]

trained_models[0].models_heatmap(
    sigx,
    cap=10,
    figsize=(12, 5),
    title=f"{sector_labels[sec.upper()]} sector: OLS model selection heatmap",
)

trained_models[0].coefs_stackedbarplot(
    name=sigx,
    figsize=(12, 5),
    ftrs_renamed=rnf_labels,
    title=f"{sector_labels[sec.upper()]}: OLS annual averages of most important feature coefficients",
)
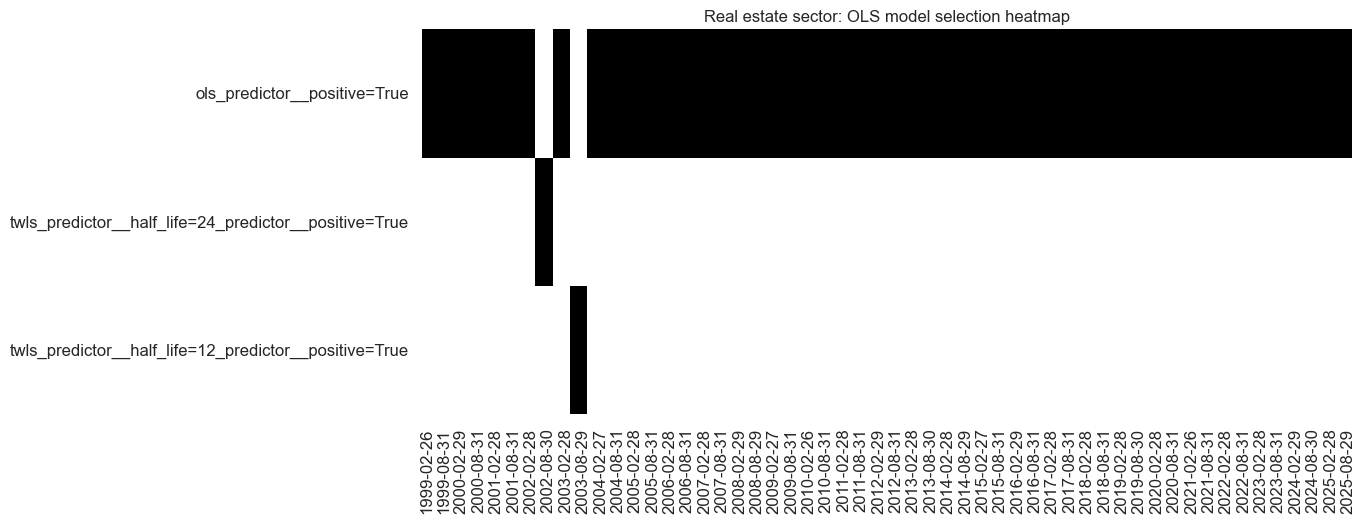
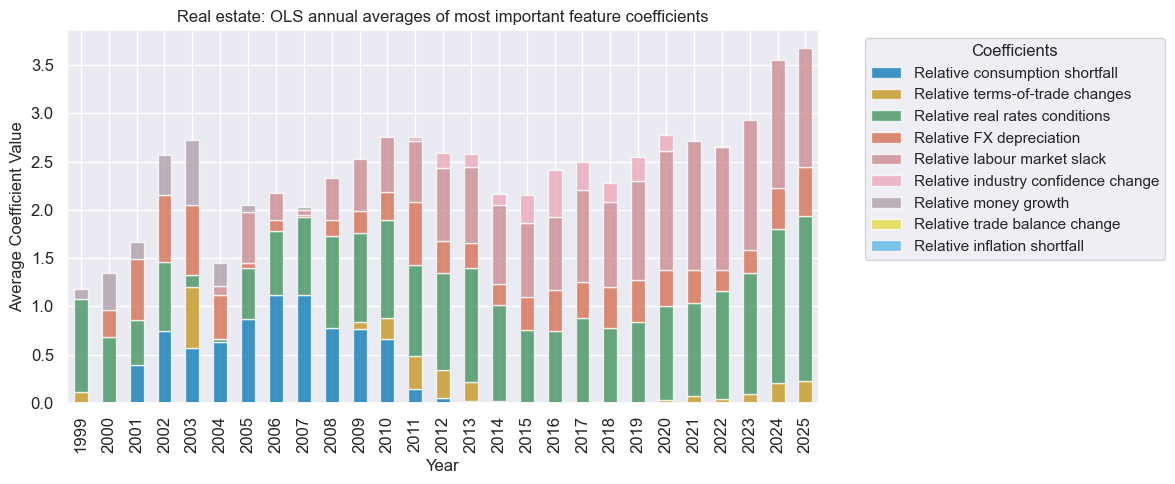
Signal quality check #
dix = rel_dict

cidx = dix["cidx"]
sec = dix["name"]
sigs = dix["signals"]
ret = dix["ret"]
freq = dix["freq"]
blax = dix["black"]

catregs = {
    x: msp.CategoryRelations(
        df=dfx,
        xcats=[x, ret],
        cids=cidx,
        freq=freq,
        lag=1,
        blacklist=blax,
        xcat_aggs=["last", "sum"],
        slip=1,
    )
    for x in sigs
}

dix["catregs"] = catregs
dix = rel_dict
catregs = dix["catregs"]
sigs = dix["signals"]
name = dix["name"]

msv.multiple_reg_scatter(
    cat_rels=list(catregs.values()),
    ncol=2,
    nrow=1,
    figsize=(15, 6),
    title=name,
    title_xadj=0.5,
    title_yadj=0.99,
    title_fontsize=20,
    xlab=None,
    ylab=None,
    coef_box="lower right",
    prob_est="map",
    single_chart=True,
    subplot_titles=list(sigs),
)
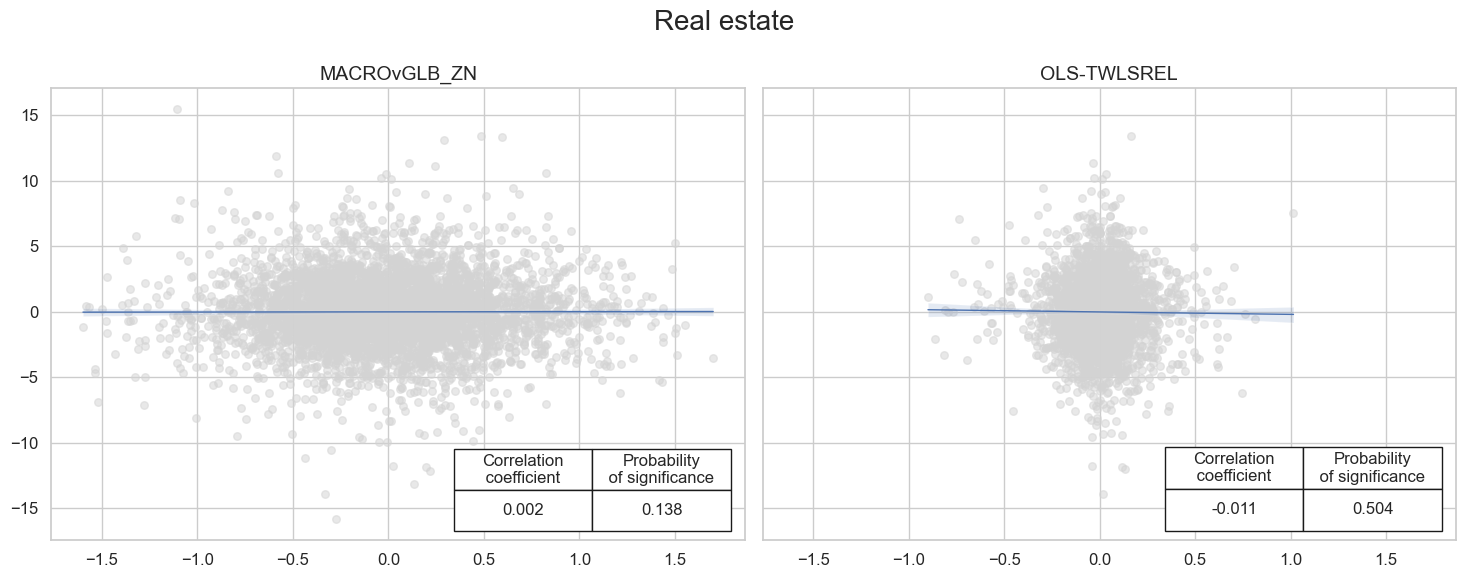
Naive PnL #
dix = rel_dict

cidx = dix["cidx"]
sigs = dix["signals"]
ret = dix["ret"]
freq = dix["freq"]
blax = dix["black"]

pnl = msn.NaivePnL(
    df=dfx,
    ret=ret,
    sigs=sigs,
    cids=cidx,
    start=default_start_date,
    blacklist=blax,
    bms=["USD_EQXR_NSA"],
)

for sig in sigs:
    pnl.make_pnl(
        sig=sig,
        sig_op="zn_score_pan",
        rebal_freq="monthly",
        neutral="zero",
        rebal_slip=1,
        vol_scale = None,
        thresh=3,
        pnl_name=f"PNL_{sig}_PZN" if sig != "MACROvGLB_ZN" else f"PNL_{sig}{dix['sec']}_PZN",
    )

dix["pnls"] = pnl
dix = rel_dict

pnl = dix["pnls"]
name = dix["name"]
sigs = dix["signals"]
pns = [f"PNL_{sig}_PZN" if sig != "MACROvGLB_ZN" else f"PNL_{sig}{dix['sec']}_PZN" for sig in sigs]

pnl.plot_pnls(
    pnl_cats=pnl.pnl_names,
    title=f"{name} sector: naive PnLs of local positions versus global basket",
    title_fontsize=14
)

display(pnl.evaluate_pnls(pnl_cats=pnl.pnl_names))
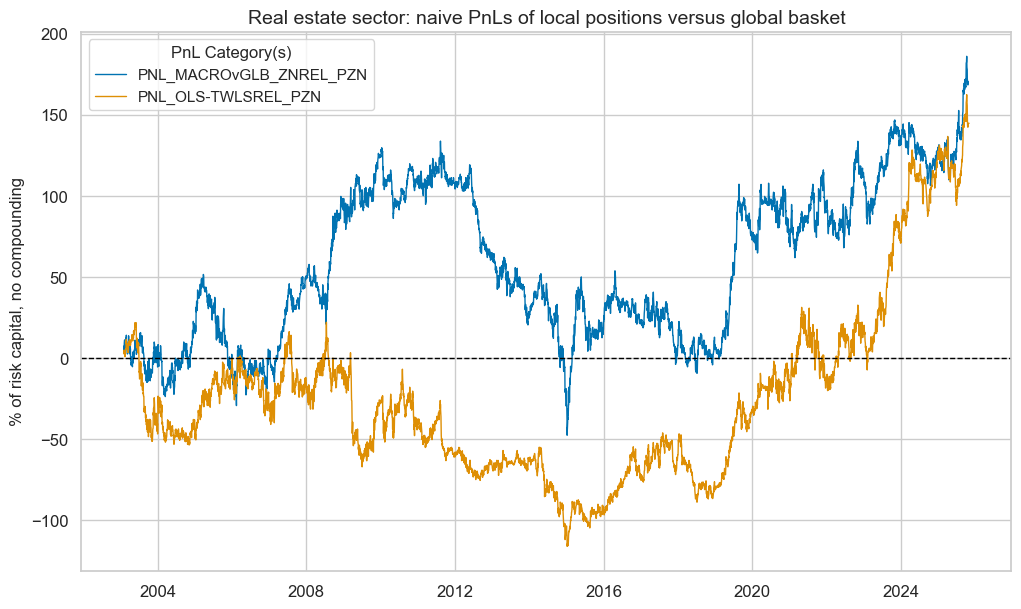
| xcat | PNL_MACROvGLB_ZNREL_PZN | PNL_OLS-TWLSREL_PZN |
|---|---|---|
| Return % | 7.509867 | 6.370074 |
| St. Dev. % | 42.830248 | 38.978744 |
| Sharpe Ratio | 0.17534 | 0.163424 |
| Sortino Ratio | 0.253767 | 0.233295 |
| Max 21-Day Draw % | -46.151199 | -55.007867 |
| Max 6-Month Draw % | -76.208673 | -67.283253 |
| Peak to Trough Draw % | -181.319393 | -138.059616 |
| Top 5% Monthly PnL Share | 1.684338 | 2.049417 |
| USD_EQXR_NSA correl | -0.002581 | 0.038638 |
| Traded Months | 274 | 274 |
Combination of sector equity factors #
sectors_pnls = {
    # "all": all_dict["pnls"],
    "enr": enr_dict["pnls"],
    "mat": mat_dict["pnls"],
    "ind": ind_dict["pnls"],
    "cod": cod_dict["pnls"],
    "cos": cos_dict["pnls"],
    "hlc": hlc_dict["pnls"],
    "fin": fin_dict["pnls"],
    "ite": ite_dict["pnls"],
    "csr": csr_dict["pnls"],
    "utl": utl_dict["pnls"],
    "rel": rel_dict["pnls"],
}

signal_families = {
    "OLS-TWLS": "statistical learning",
    "MACROvGLB_ZN": "conceptual risk parity",
}
multisignal_multisector_pnls = msn.MultiPnL()
multisignal_multisector_pnls.performance_summary = {}

for signal_type, signal_desc in signal_families.items():

    signal_family_xcats = []

    for sec, sec_pnl in sectors_pnls.items():

        # specifying the name of the PnL to import from the single sector PnL object into the multisector one
        single_pnl_xcats = [f"PNL_{signal_type}{sec.upper()}_PZN"]
        signal_family_xcats.extend(single_pnl_xcats)
        # Adding the PnL from the sector
        multisignal_multisector_pnls.add_pnl(sec_pnl, pnl_xcats=single_pnl_xcats)

    # computing the average across all sectors for this family of signals
    signal_family_combo = f"Average for {signal_desc} signals"
    multisignal_multisector_pnls.combine_pnls(
        pnl_xcats=signal_family_xcats,
        composite_pnl_xcat=signal_family_combo,
        weights=None,
    )
    signal_family_xcats.extend([signal_family_combo])

    # Calculating the return statistics
    multisignal_multisector_pnls.performance_summary[signal_type] = multisignal_multisector_pnls.evaluate_pnls(pnl_xcats=signal_family_xcats).rename(
        columns={
            f"PNL_{signal_type}{sec.upper()}_PZN/EQC{sec.upper()}XR_VT10vGLB": sector_labels[sec.upper()] for sec in secs
        }
    )
multisignal_multisector_pnls.plot_pnls(
    [
        f"Average for {signal_desc} signals"
        for signal_type, signal_desc in signal_families.items()
    ],
    title="Unweighted average of sectoral PnLs of local (vol-targeted) positions versus global basket",
)
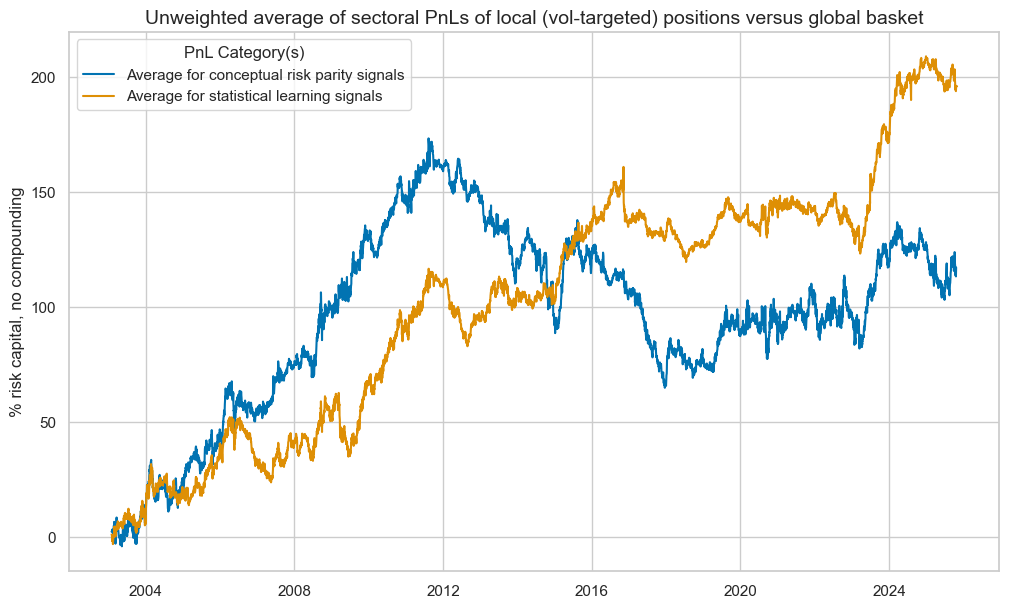
for signal_type, signal_desc in signal_families.items():

    summary_table = multisignal_multisector_pnls.performance_summary.get(signal_type).transpose().style.format("{:.2f}").set_caption(
        f"Naive PnL statistics for {signal_families[signal_type]} signals"
    ).set_table_styles(
        [
            {
                "selector": "caption", "props": [("text-align", "center"), ("font-weight", "bold"), ("font-size", "17px")]
            }
        ]
    )
    display(summary_table)
| Return % | St. Dev. % | Sharpe Ratio | Sortino Ratio | Max 21-Day Draw % | Max 6-Month Draw % | Peak to Trough Draw % | Top 5% Monthly PnL Share | USD_EQXR_NSA correl | Traded Months | |
|---|---|---|---|---|---|---|---|---|---|---|
| Energy | 12.52 | 49.18 | 0.25 | 0.44 | -75.91 | -117.39 | -146.85 | 1.37 | 0.09 | 274.00 |
| Materials | 15.95 | 38.87 | 0.41 | 0.59 | -38.60 | -55.23 | -105.91 | 0.85 | -0.03 | 274.00 |
| Industrials | 14.67 | 35.74 | 0.41 | 0.60 | -34.38 | -46.61 | -106.76 | 0.81 | -0.01 | 274.00 |
| Cons. discretionary | 16.10 | 36.12 | 0.45 | 0.64 | -38.59 | -59.13 | -134.60 | 0.86 | -0.01 | 274.00 |
| Cons. staples | 25.39 | 37.74 | 0.67 | 1.00 | -35.70 | -55.49 | -97.57 | 0.60 | 0.02 | 274.00 |
| Healthcare | 3.68 | 45.55 | 0.08 | 0.11 | -57.25 | -74.04 | -140.25 | 4.32 | 0.04 | 274.00 |
| Financials | 11.33 | 33.79 | 0.34 | 0.48 | -43.66 | -56.43 | -73.03 | 1.00 | -0.01 | 274.00 |
| Information tech | 1.34 | 33.46 | 0.04 | 0.06 | -44.17 | -64.41 | -149.28 | 7.67 | 0.01 | 274.00 |
| Communication services | 3.24 | 48.45 | 0.07 | 0.09 | -56.31 | -65.57 | -171.72 | 4.88 | 0.08 | 274.00 |
| Utilities | 0.98 | 35.10 | 0.03 | 0.04 | -49.28 | -68.01 | -166.22 | 11.97 | 0.03 | 274.00 |
| Real estate | 6.37 | 38.98 | 0.16 | 0.23 | -55.01 | -67.28 | -138.06 | 2.05 | 0.04 | 274.00 |
| Average for statistical learning signals | 8.61 | 18.95 | 0.45 | 0.66 | -23.24 | -25.30 | -41.33 | 0.77 | nan | 274.00 |
| Return % | St. Dev. % | Sharpe Ratio | Sortino Ratio | Max 21-Day Draw % | Max 6-Month Draw % | Peak to Trough Draw % | Top 5% Monthly PnL Share | USD_EQXR_NSA correl | Traded Months | |
|---|---|---|---|---|---|---|---|---|---|---|
| Energy | 8.92 | 41.59 | 0.21 | 0.30 | -56.48 | -118.13 | -202.67 | 1.54 | 0.01 | 274.00 |
| Materials | 9.01 | 42.32 | 0.21 | 0.30 | -71.21 | -97.56 | -112.46 | 1.55 | -0.01 | 274.00 |
| Industrials | 14.27 | 42.58 | 0.34 | 0.48 | -55.84 | -79.84 | -129.04 | 1.08 | 0.00 | 274.00 |
| Cons. discretionary | -3.66 | 43.59 | -0.08 | -0.12 | -51.08 | -74.60 | -245.94 | -3.97 | -0.03 | 274.00 |
| Cons. staples | 15.29 | 45.05 | 0.34 | 0.50 | -46.11 | -84.52 | -195.83 | 1.35 | -0.01 | 274.00 |
| Healthcare | 4.89 | 45.29 | 0.11 | 0.15 | -53.65 | -109.95 | -284.42 | 3.72 | 0.02 | 274.00 |
| Financials | 9.20 | 40.84 | 0.23 | 0.32 | -38.25 | -96.43 | -118.75 | 1.39 | -0.04 | 274.00 |
| Information tech | -1.01 | 42.06 | -0.02 | -0.03 | -52.75 | -86.46 | -168.25 | -15.31 | -0.02 | 274.00 |
| Communication services | 2.20 | 44.24 | 0.05 | 0.07 | -45.15 | -81.70 | -207.27 | 7.04 | -0.00 | 274.00 |
| Utilities | 0.14 | 44.00 | 0.00 | 0.00 | -56.15 | -108.61 | -211.45 | 105.66 | 0.01 | 274.00 |
| Real estate | 7.51 | 42.83 | 0.18 | 0.25 | -46.15 | -76.21 | -181.32 | 1.68 | -0.00 | 274.00 |
| Average for conceptual risk parity signals | 5.16 | 25.53 | 0.20 | 0.29 | -22.60 | -33.79 | -108.39 | 1.52 | nan | 274.00 |