Signal optimization basics #

This notebook illustrates the points discussed in the post “Optimizing macro trading signals – A practical introduction” on the Macrosynergy website. It demonstrates how sequential signal optimization can be performed, using the macrosynergy.learning subpackage, together with the popular scikit-learn package. The post applies statistical learning methods for the sequential optimization of the three important tasks: feature selection, return prediction, and market regime classification. The notebook uses the small sub-set of JPMaQS dataset available on Kaggle.

The notebook is organized into three main sections:

  • Get Packages and JPMaQS Data: This section is dedicated to installing and importing the necessary Python packages for the analysis. It includes standard Python libraries like pandas and seaborn, as well as the scikit-learn package and the specialized macrosynergy package.

  • Transformations and Checks: In this part, the notebook conducts data calculations and transformations to derive relevant signals and targets for the analysis. This involves normalizing feature variables using z-scores and constructing simple linear composite indicators. A notable composite indicator, MACRO_AVGZ , is created by combining four quantamental indicators (excess GDP growth, excess inflation, excess private credit growth, and real 5-year yield). This composite indicator, previously utilized in the Kaggle notebook “Trading strategies with JPMaQS” , serves as a benchmark for the subsequent machine learning applications. The primary goal is to assess whether sequential optimization enhances predictive power and value generation compared to an unweighted composite.

  • The third part exemplifies three applications of machine learning:

    • Feature selection: This segment employs a statistical learning method to sequentially choose an optimal method for selecting feature scores. A comparison is made between this indicator MACRO_OPTSELZ and a simple unweighted composite score MACRO_AVGZ using standard value checks and performance metrics used in previous posts and notebooks.

    • Prediction: This method focuses on selecting the optimal prediction method for monthly target returns and applying its predictions as signals. The outcome MACRO_OPTREG is also compared with the non-optimized and non-weighted composite signal MACRO_AVGZ .

    • Classification: Statistical learning is applied for the classification of the rates market environment into “good” or “bad” for the target return. An optimal classifier of the direction of market returns is chosen ( MACRO_OPTCLASS ), and the predicted class serves as a binary trading signal for each currency area. The unweighted linear composite MACRO_AVGZ is also used as a benchmark in this case.

Notably, this notebook is the first to utilize the macrosynergy subpackage macrosynergy.learning , which integrates the macrosynergy package and associated JPMaQS data with the widely-used scikit-learn library. This notebook establishes the basic statistical learning applications to support trading signal generation through sequential optimization based on panel cross-validation.

Get packages and JPMaQS data #

This notebook primarily relies on the standard packages available in the Python data science stack. However, the macrosynergy package is additionally required for two purposes:

  • Downloading JPMaQS data: The macrosynergy package facilitates the retrieval of JPMaQS data used in the notebook. For users using the free Kaggle subset , this part of the macrosynergy package is not required.

  • For analyzing quantamental data and value propositions: The macrosynergy package provides functionality for performing quick analyses of quantamental data and exploring value propositions. The new subpackage macrosynergy.learning integrates the macrosynergy package and associated JPMaQS data with the widely-used scikit-learn library and is used for sequential signal optimization.

For detailed information and a comprehensive understanding of the macrosynergy package and its functionalities, please refer to the “Introduction to Macrosynergy package” notebook on the Macrosynergy Quantamental Academy or visit the following link on Kaggle.

# Run only if needed!
"""
%%capture
! pip install macrosynergy --upgrade"""
'\n%%capture\n! pip install macrosynergy --upgrade'
import os
import numpy as np
import pandas as pd
import seaborn as sns

from sklearn.pipeline import Pipeline
from sklearn.linear_model import LogisticRegression, LinearRegression
from sklearn.neighbors import KNeighborsClassifier, KNeighborsRegressor

from sklearn.metrics import (
    make_scorer,
    balanced_accuracy_score,
    r2_score,
)

import macrosynergy.management as msm
import macrosynergy.panel as msp
import macrosynergy.pnl as msn
import macrosynergy.signal as mss
import macrosynergy.learning as msl
from macrosynergy.download import JPMaQSDownload

import warnings

warnings.simplefilter("ignore")

The JPMaQS indicators we consider are downloaded using the J.P. Morgan Dataquery API interface within the macrosynergy package. This is done by specifying ticker strings, formed by appending an indicator category code to a currency area code <cross_section>. These constitute the main part of a full quantamental indicator ticker, taking the form DB(JPMAQS,<cross_section>_<category>,<info>) , where denotes the time series of information for the given cross-section and category. The following types of information are available:

value giving the latest available values for the indicator eop_lag referring to days elapsed since the end of the observation period mop_lag referring to the number of days elapsed since the mean observation period grade denoting a grade of the observation, giving a metric of real time information quality.

After instantiating the JPMaQSDownload class within the macrosynergy.download module, one can use the download(tickers,start_date,metrics) method to easily download the necessary data, where tickers is an array of ticker strings, start_date is the first collection date to be considered and metrics is an array comprising the times series information to be downloaded. For more information see here or use the free dataset on Kaggle .

In the cell below, we specified cross-sections used for the analysis. For the abbreviations, please see About Dataset

# Cross-sections of interest

cids_dm = ["AUD", "CAD", "CHF", "EUR", "GBP", "JPY", "NOK", "NZD", "SEK", "USD"]
cids_em = [
    "CLP",
    "COP",
    "CZK",
    "HUF",
    "IDR",
    "ILS",
    "INR",
    "KRW",
    "MXN",
    "PLN",
    "THB",
    "TRY",
    "TWD",
    "ZAR",
]
cids = cids_dm + cids_em
cids_du = cids_dm + cids_em
cids_dux = list(set(cids_du) - set(["IDR", "NZD"]))
cids_xg2 = list(set(cids_dux) - set(["EUR", "USD"]))
# Quantamental categories of interest

main = [
    "RYLDIRS05Y_NSA",
    "INTRGDPv5Y_NSA_P1M1ML12_3MMA",
    "CPIC_SJA_P6M6ML6AR",
    "CPIH_SA_P1M1ML12",
    "INFTEFF_NSA",
    "PCREDITBN_SJA_P1M1ML12",
    "RGDP_SA_P1Q1QL4_20QMA",
]

mkts = [
    "DU05YXR_VT10",
    "FXTARGETED_NSA", 
    "FXUNTRADABLE_NSA"
]


xcats = main + mkts

The description of each JPMaQS category is available either under Macro Quantamental Academy , JPMorgan Markets (password protected), or on Kaggle (just for the tickers used in this notebook). In particular, the set used for this notebook is using Consumer price inflation trends , Inflation targets , Intuitive growth estimates , Long-term GDP growth , Private credit expansion , Duration returns , and FX tradeability and flexibility

# Resultant tickers for download

tickers = [cid + "_" + xcat for cid in cids for xcat in xcats]
# Download series from J.P. Morgan DataQuery by tickers

start_date = "2000-01-01"
end_date = None

# Retrieve credentials

oauth_id = os.getenv("DQ_CLIENT_ID")  # Replace with own client ID
oauth_secret = os.getenv("DQ_CLIENT_SECRET")  # Replace with own secret

# Download from DataQuery

with JPMaQSDownload(client_id=oauth_id, client_secret=oauth_secret) as downloader:
    df = downloader.download(
        tickers=tickers,
        start_date=start_date,
        end_date=end_date,
        metrics=["value"],
        suppress_warning=True,
        show_progress=True,
    )

dfx = df.copy()
dfx.info()
Downloading data from JPMaQS.
Timestamp UTC:  2024-11-04 09:20:47
Connection successful!
Requesting data: 100%|█████████████████████████████████████████████████████████████████| 12/12 [00:02<00:00,  4.81it/s]
Downloading data: 100%|████████████████████████████████████████████████████████████████| 12/12 [00:17<00:00,  1.48s/it]
Some expressions are missing from the downloaded data. Check logger output for complete list.
2 out of 240 expressions are missing. To download the catalogue of all available expressions and filter the unavailable expressions, set `get_catalogue=True` in the call to `JPMaQSDownload.download()`.
Some dates are missing from the downloaded data. 
2 out of 6483 dates are missing.
<class 'pandas.core.frame.DataFrame'>
RangeIndex: 1465400 entries, 0 to 1465399
Data columns (total 4 columns):
 #   Column     Non-Null Count    Dtype         
---  ------     --------------    -----         
 0   real_date  1465400 non-null  datetime64[ns]
 1   cid        1465400 non-null  object        
 2   xcat       1465400 non-null  object        
 3   value      1465400 non-null  float64       
dtypes: datetime64[ns](1), float64(1), object(2)
memory usage: 44.7+ MB

Availability and blacklisting #

It is essential to assess data availability before conducting any analysis. It allows for the identification of any potential gaps or limitations in the dataset, which can impact the validity and reliability of analysis, ensure that a sufficient number of observations for each selected category and cross-section is available, and determine the appropriate periods for analysis.

The missing_in_df() function in macrosynergy.management allows the user to quickly check whether or not all requested categories have been downloaded.

msm.missing_in_df(df, xcats=xcats, cids=cids)
No missing XCATs across DataFrame.
Missing cids for CPIC_SJA_P6M6ML6AR:            []
Missing cids for CPIH_SA_P1M1ML12:              []
Missing cids for DU05YXR_VT10:                  []
Missing cids for FXTARGETED_NSA:                ['USD']
Missing cids for FXUNTRADABLE_NSA:              ['USD']
Missing cids for INFTEFF_NSA:                   []
Missing cids for INTRGDPv5Y_NSA_P1M1ML12_3MMA:  []
Missing cids for PCREDITBN_SJA_P1M1ML12:        []
Missing cids for RGDP_SA_P1Q1QL4_20QMA:         []
Missing cids for RYLDIRS05Y_NSA:                []

The check_availability() function in macrosynergy.management displays the start dates from which each category is available for each requested country, as well as missing dates or unavailable series.

msm.check_availability(df=dfx, xcats=xcats, cids=cids, missing_recent=False)
https://macrosynergy.com/notebooks.build/data-science/signal-optimization-basics/_images/372e116f81dc9caac5f90770840d98477eb4603fbfc5d3ea84fe2f873b252f58.png

Identifying and isolating periods of official exchange rate targets, illiquidity, or convertibility-related distortions in FX markets is the first step in creating an FX trading strategy. These periods can significantly impact the behavior and dynamics of currency markets, and failing to account for them can lead to inaccurate or misleading findings. The `make_blacklist()`` helper function creates a standardized dictionary of blacklist periods:

# Create blacklisting dictionary

dfb = df[df["xcat"].isin(["FXTARGETED_NSA", "FXUNTRADABLE_NSA"])].loc[
    :, ["cid", "xcat", "real_date", "value"]
]
dfba = (
    dfb.groupby(["cid", "real_date"])
    .aggregate(value=pd.NamedAgg(column="value", aggfunc="max"))
    .reset_index()
)
dfba["xcat"] = "FXBLACK"
fxblack = msp.make_blacklist(dfba, "FXBLACK")
fxblack
{'CHF': (Timestamp('2011-10-03 00:00:00'), Timestamp('2015-01-30 00:00:00')),
 'CZK': (Timestamp('2014-01-01 00:00:00'), Timestamp('2017-07-31 00:00:00')),
 'ILS': (Timestamp('2000-01-03 00:00:00'), Timestamp('2005-12-30 00:00:00')),
 'INR': (Timestamp('2000-01-03 00:00:00'), Timestamp('2004-12-31 00:00:00')),
 'THB': (Timestamp('2007-01-01 00:00:00'), Timestamp('2008-11-28 00:00:00')),
 'TRY_1': (Timestamp('2000-01-03 00:00:00'), Timestamp('2003-09-30 00:00:00')),
 'TRY_2': (Timestamp('2020-01-01 00:00:00'), Timestamp('2024-07-31 00:00:00'))}

Transformation and checks #

Signal constituent candidates #

In this part of the analysis, we create a simple, plausible composite signal based on four quantamental indicators:

  • intuitive growth trends ,

  • Excess inflation (defined the difference between information states of consumer price inflation (view documentation here and a currency area’s estimated effective inflation target (view documentation here ).)

  • Excess private credit growth: This is the difference between annual growth rates of private credit that are statistically adjusted for jumps (view documentation here ) and the sum of a currency areas 5-year median GDP growth and effective inflation target.

  • Real 5-year yield: This real yield is calculated as the 5-year swap yield (view documentation here ) minus 5-year ahead estimated inflation expectation according to a Macrosynergy methodology (view documentation here ).

calcs = [
    "XGDP_NEG = - INTRGDPv5Y_NSA_P1M1ML12_3MMA",
    "XCPI_NEG =  - ( CPIC_SJA_P6M6ML6AR + CPIH_SA_P1M1ML12 ) / 2 + INFTEFF_NSA",
    "XPCG_NEG = - PCREDITBN_SJA_P1M1ML12 + INFTEFF_NSA + RGDP_SA_P1Q1QL4_20QMA",
]

dfa = msp.panel_calculator(dfx, calcs=calcs, cids=cids)
dfx = msm.update_df(dfx, dfa)

Individual and average z-scores #

Normalizing values across different categories is a common practice in macroeconomics. This is particularly important when summing or averaging categories with different units and time series properties. Using macrosynergy's custom function make_zn_scores() we normalize the selected scores around neutral value (zero), using only past information. Re-estimation is done on a monthly basis. We protect against outliers using 3 standard deviations as the threshold. The normalized indicators receive postfix _ZN4 . These four normalized scores are then averaged using linear_composite() function from the macrosynergy package.

macros = ["XGDP_NEG", "XCPI_NEG", "XPCG_NEG", "RYLDIRS05Y_NSA"]
xcatx = macros

for xc in xcatx:
    dfa = msp.make_zn_scores(
        dfx,
        xcat=xc,
        cids=cids,
        neutral="zero",
        thresh=3,
        est_freq="M",
        pan_weight=1,
        postfix="_ZN4",
    )
    dfx = msm.update_df(dfx, dfa)

dfa = msp.linear_composite(
    df=dfx,
    xcats=[xc + "_ZN4" for xc in xcatx],
    cids=cids,
    new_xcat="MACRO_AVGZ",
)

dfx = msm.update_df(dfx, dfa)

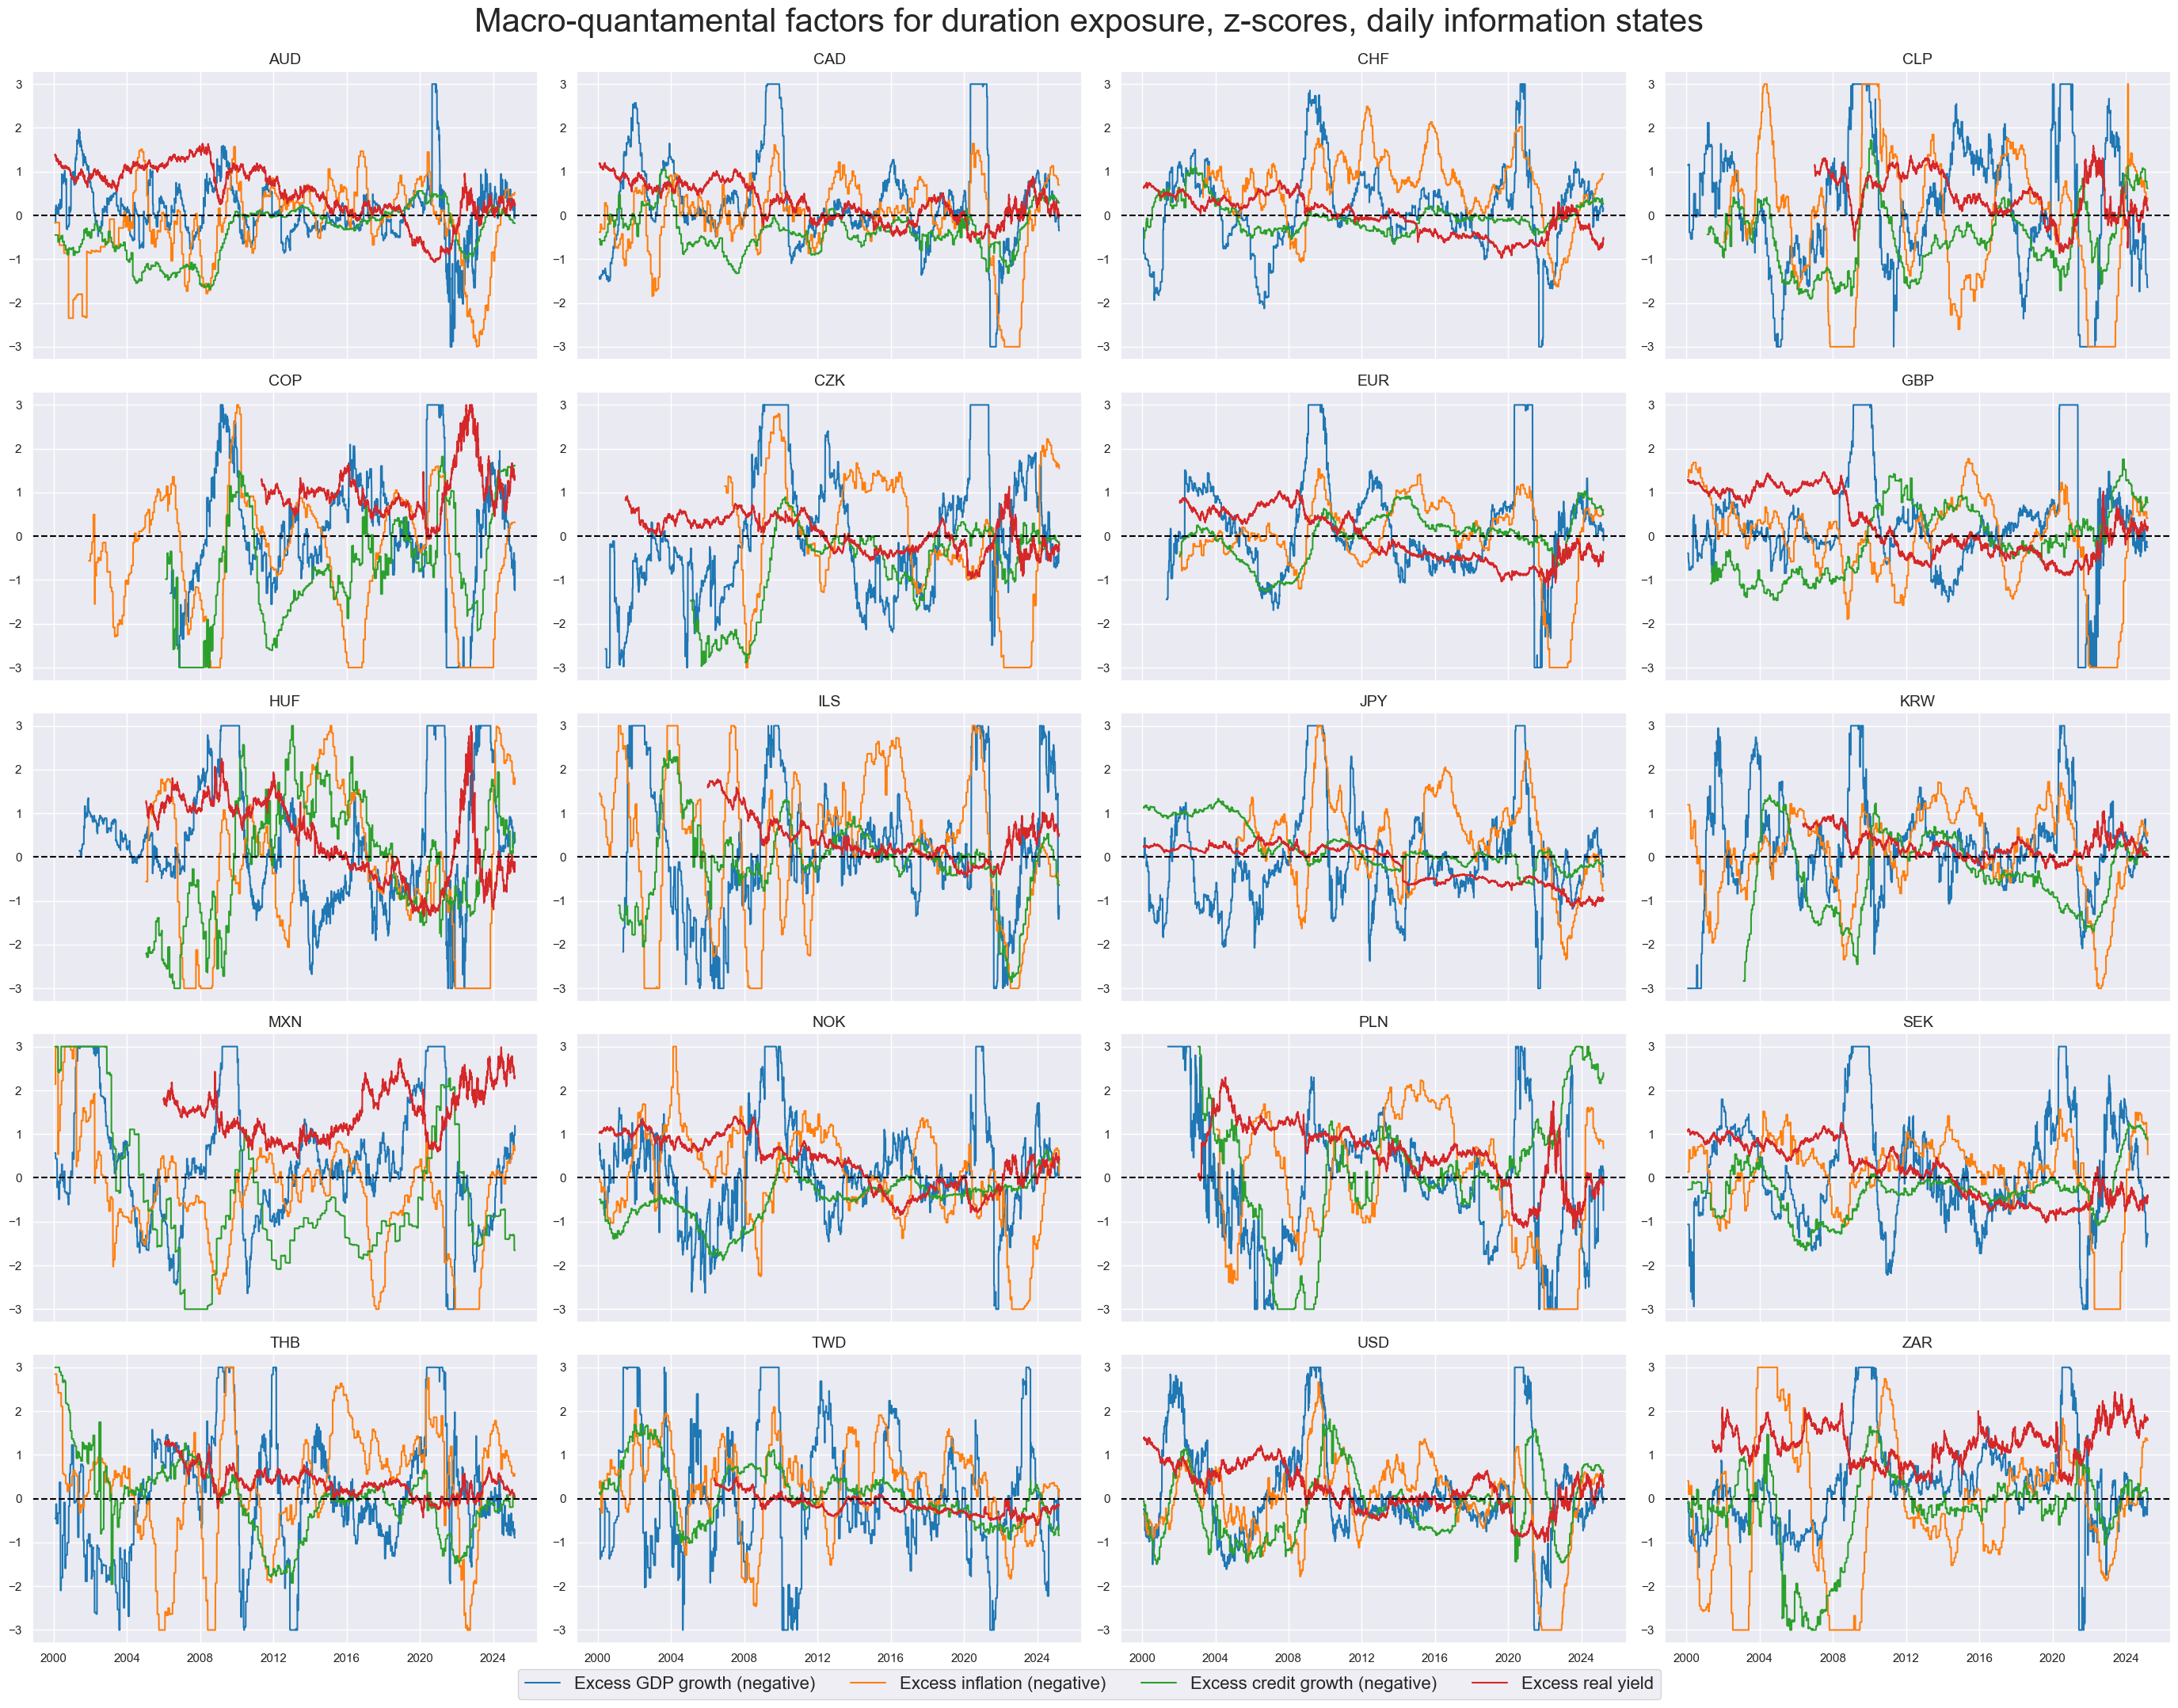
The macrosynergy package provides two useful functions, view_ranges() and view_timelines() . The latter facilitate convenient data visualization for selected indicators and cross-sections plotting time series of the four chosen z-scores for selected cross-sections.

macroz = [m + "_ZN4" for m in macros]
xcatx = macroz

msp.view_timelines(
    dfx,
    xcats=xcatx,
    cids=cids_dux,
    ncol=4,
    start="2000-01-01",
    title="Quantamental indicators, z-scores, daily information states (> 0 means presumed positive IRS return impact)",
    title_fontsize=30,
    same_y=False,
    cs_mean=False,
    xcat_labels=["Excess growth", "Excess inflation", "Excess credit growth", "Real yield"],
    legend_fontsize=16,
)
https://macrosynergy.com/notebooks.build/data-science/signal-optimization-basics/_images/7b3ae67a6447739980fd8d046599eb8f5ca6c5c5cbc2201bd7913bed3b4c67a3.png

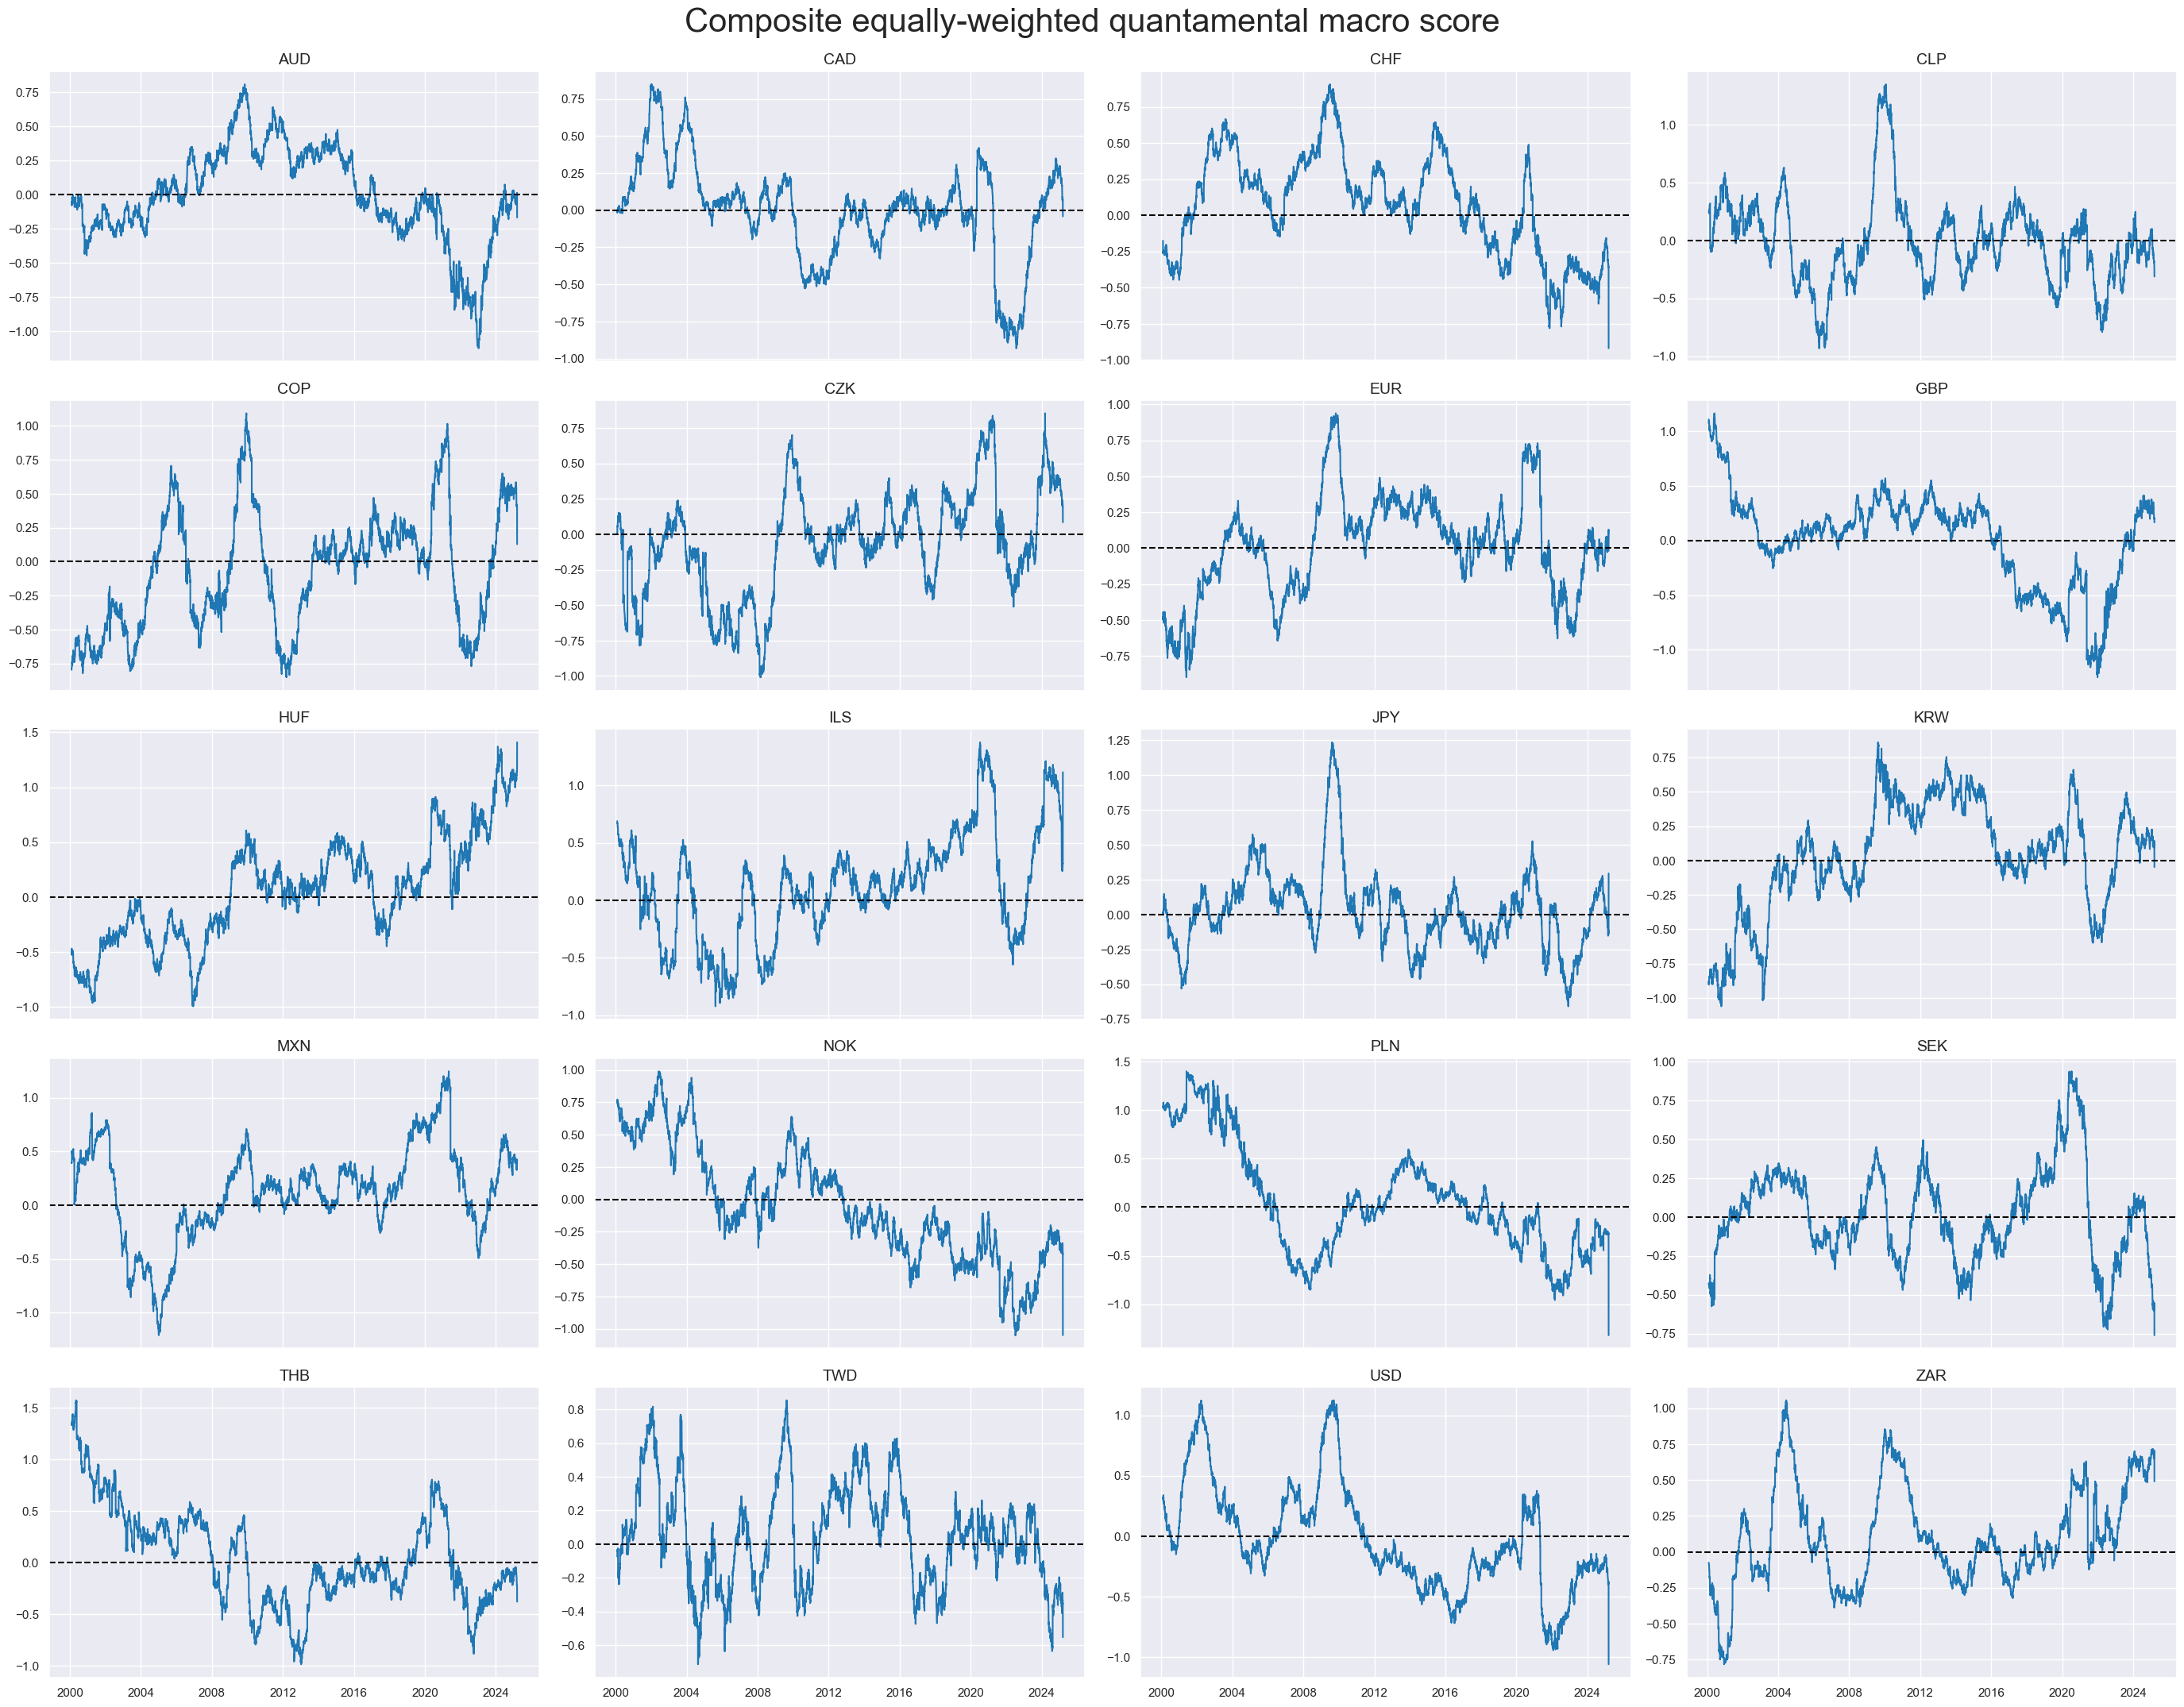
Here we plot with the function view_timelines() the resulting unweighted and unoptimizes composite score MACRO_AVGZ . This indicator will be used as a benchmark signal for the evaluation if machine learning applications can improve the value generation of this signal.

xcatx = ["MACRO_AVGZ"]

msp.view_timelines(
    dfx,
    xcats=xcatx,
    cids=sorted(cids_dux),
    ncol=4,
    start="2000-01-01",
    title="Composite equally-weighted quantamental macro score (> 0 means presumed positive IRS return impact)",
    title_fontsize=30,
    same_y=False,
    cs_mean=False,
    xcat_labels=None,
)
https://macrosynergy.com/notebooks.build/data-science/signal-optimization-basics/_images/ce2d47a07f0128e7919df17f1d382d8715cb5fe9762408073bab713f953563a5.png

Trading strategies with JPMaQS notebook goes into more details of how well this composite signal performs for various countries, for relative returns etc. The purpose of this notebook is different: it compares the most simple strategy based on this signal for all available cross-sections with the three potential machine learning enhancements.

Features and targets for scikit-learn #

As the first preparation for machine learning, we downsample the daily information states to monthly frequency with the help of categories_df() function applying the leg of 1 month and using the last value in the month for explanatory variables and sum for the aggregated target (return). As explanatory variables, we use separate z-scores of excess GDP growth, inflation, private credit growth, and real 5-year yield (all these indicators have postfix _ZN4 ). As a target, we use DU05YXR_VT10 , Duration return for 10% vol target: 5-year maturity.

# Specify features and target category
xcatx = macroz + ["DU05YXR_VT10"]

# Downsample from daily to monthly frequency (features as last and target as sum)
dfw = msm.categories_df(
    df=dfx,
    xcats=xcatx,
    cids=cids_dux,
    freq="M",
    lag=1,
    blacklist=fxblack,
    xcat_aggs=["last", "sum"],
)

# Drop rows with missing values and assign features and target
dfw.dropna(inplace=True)
X = dfw.iloc[:, :-1]
y = dfw.iloc[:, -1]

Types of cross-validation #

The ExpandingIncrementPanelSplit() class of the macrosynergy package is designed to generate temporally expanding training panels with fixed intervals, followed by subsequent test sets of typically short, fixed time spans. This setup replicates sequential learning scenarios, where information sets grow at fixed intervals. In this implementation, the training set expands by 12 months at each subsequent split. The initial training set requires a minimum of 36 months for at least 4 currency areas, and each test set has a fixed length of 12 months. This class facilitates the generation of splits for sequential training, sequential validation, and walk-forward validation across a given panel. The accompanying plot illustrates five key points in the process:

  • The initial split

  • Progress at one-quarter completion

  • Halfway progress

  • Three-quarter progress

  • The final split

split_xi = msl.ExpandingIncrementPanelSplit(train_intervals=12, min_periods=36, test_size=12)
split_xi.visualise_splits(X, y)
https://macrosynergy.com/notebooks.build/data-science/signal-optimization-basics/_images/3e379ecea511818951aa42277095d9cebff5cb1303d954ea40be27929e9b331a.png

The ExpandingKFoldPanelSplit class allows instantiating panel splitters where a fixed number of splits is implemented, but temporally adjacent panel training sets always precede test sets chronologically and where the time span of the training sets increases with the implied date of the train-test split. It is equivalent to scikit-learn’s TimeSeriesSplit but adapted for panels.

split_xkf = msl.ExpandingKFoldPanelSplit(n_splits=5)
split_xkf.visualise_splits(X, y)
https://macrosynergy.com/notebooks.build/data-science/signal-optimization-basics/_images/d3cf20405e11e58d380e64d88f955ccf72085637f479edf822c11de106bcf583.png

The RollingKFoldPanelSplit class instantiates splitters where temporally adjacent panel training sets of fixed joint maximum time spans can border the test set from both the past and future. Thus, most folds do not respect the chronological order but allow training with past and future information. While this does not simulate the evolution of information, it makes better use of the available data and is often acceptable for macro data as economic regimes come in cycles. It is equivalent to scikit-learn ’s Kfold class but adapted for panels.

split_rkf = msl.RollingKFoldPanelSplit(n_splits=5)
split_rkf.visualise_splits(X, y)
https://macrosynergy.com/notebooks.build/data-science/signal-optimization-basics/_images/2e59130787bb66d19a7516f6ee610d7ded0e0c18a58fa0774dd621a4ace58aea.png

Feature selection #

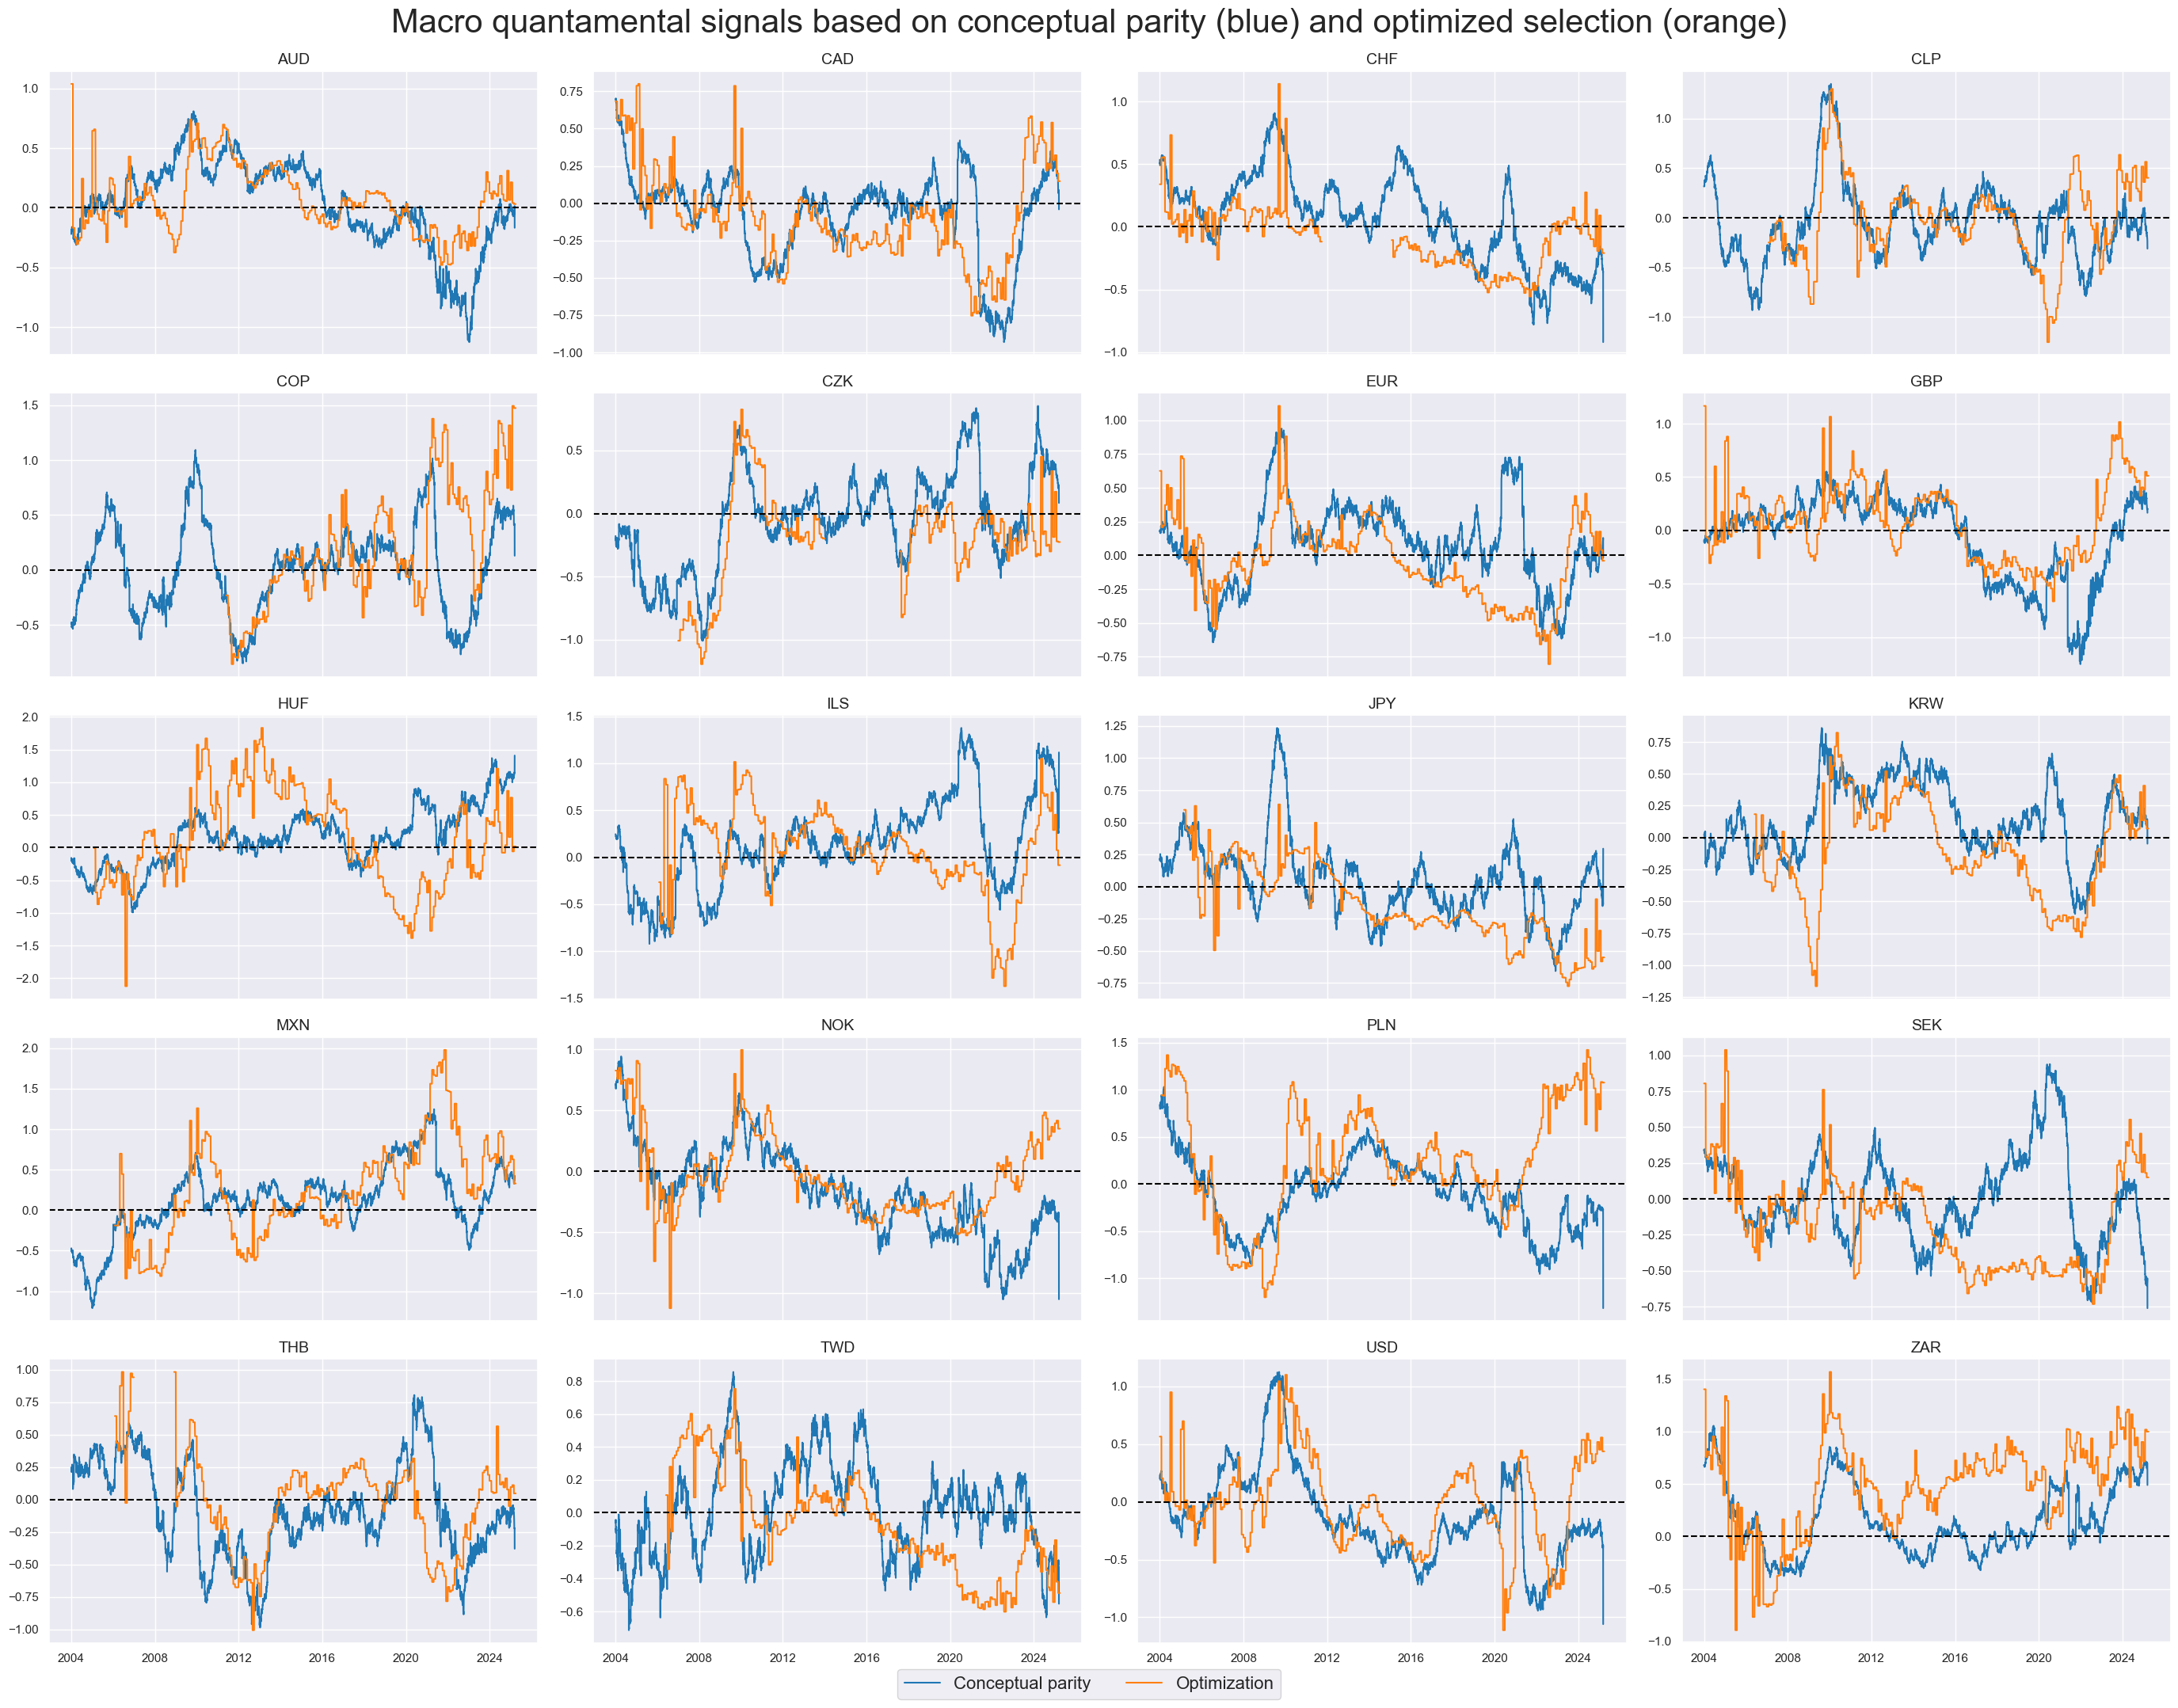
The first example of a machine learning application is feature selection, where features identified as “important” are combined, at each recalibration date, to create a signal through averaging them. Thus, the optimal signal used at each recalibration date is an equally weighted mean of the subset recommended by the best model up to that date.

Sequential optimization #

The purpose of the Pipeline is to assemble several steps that can be cross-validated together while setting different parameters. The two principal models and a set of model hyperparameters are defined below:

  • LASSO_Z (Least Absolute Shrinkage and Selection Operator) determines the features that have jointly been significant in predicting returns in a linear regression. We consider alpha values of 10, 1, 0.1, and 0.01 for the hyperparameter grid.

  • MAP_Z (Macrosynergy panel test) assesses the significance of features through the Macrosynergy panel test . For the hyperparameter grid, we consider p-values of 1%, 5%, 10%, and 20%.

Both models use FeatureAverager() and NaivePredictor() from the macrosynergy package.

# Define models and grids for optimization
mods_fsz = {
    "LASSO_Z": Pipeline(
        [
            ("selector", msl.LassoSelector(n_factors=4, positive=True)),
            ("predictor", msl.NaiveRegressor()),
        ]
    ),
    "MAP_Z": Pipeline(
        [
            ("selector", msl.MapSelector(significance_level=0.05, positive=True)),
            ("predictor", msl.NaiveRegressor()),
        ]
    ),
}

grids_fsz = {
    "LASSO_Z": {
        "selector__n_factors": [1, 2, 3, 4],
    },
    "MAP_Z": {
        "selector__n_factors": [1, 2, 3],
    },
}

The standard make_scorer() function from the scikit-learn library is used to create a scorer object that is used to evaluate the performance on the test set. The scorer function is based on macrosynergy ’s panel_significance_probability function. This function is used to create a linear mixed effects model between the true returns and the predicted returns, returning the significance of the model slope. This scorer function is specific for panel quantamental data, such as JPMaQS.

# Define the optimization criterion
score_fsz = make_scorer(msl.panel_significance_probability)

# Define splits for cross-validation
splitter_fsz = msl.RollingKFoldPanelSplit(n_splits=4)

The actual model is then selected using SignalOptimizer class from the macrosynergy package. This class calculates quantamental predictions based on adaptive hyperparameters (alpha and p-values as defined above) and model selection ( LASSO_Z and MAP_Z ). This customized class is based on scikit-learn functions GridSearchCV and RandomizedSearchCV .

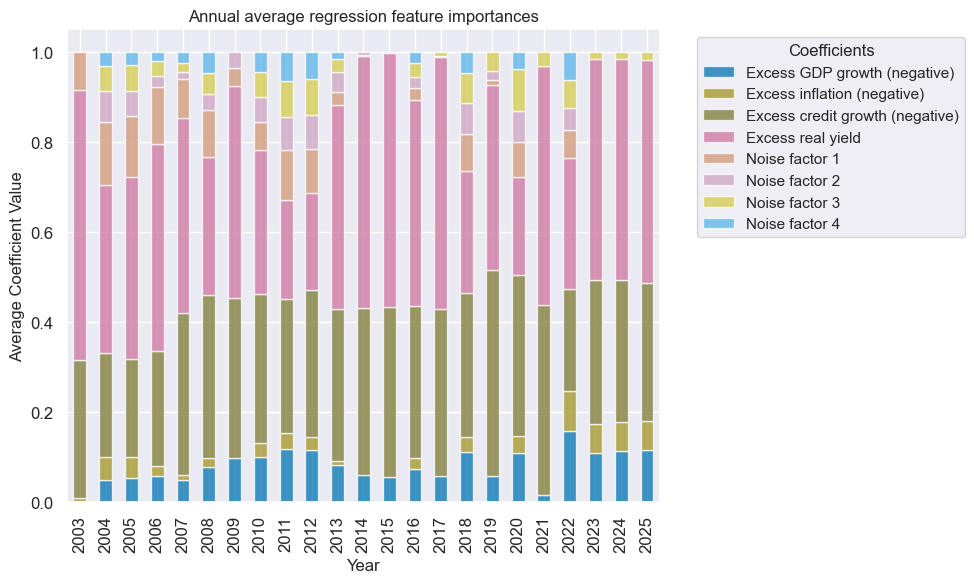
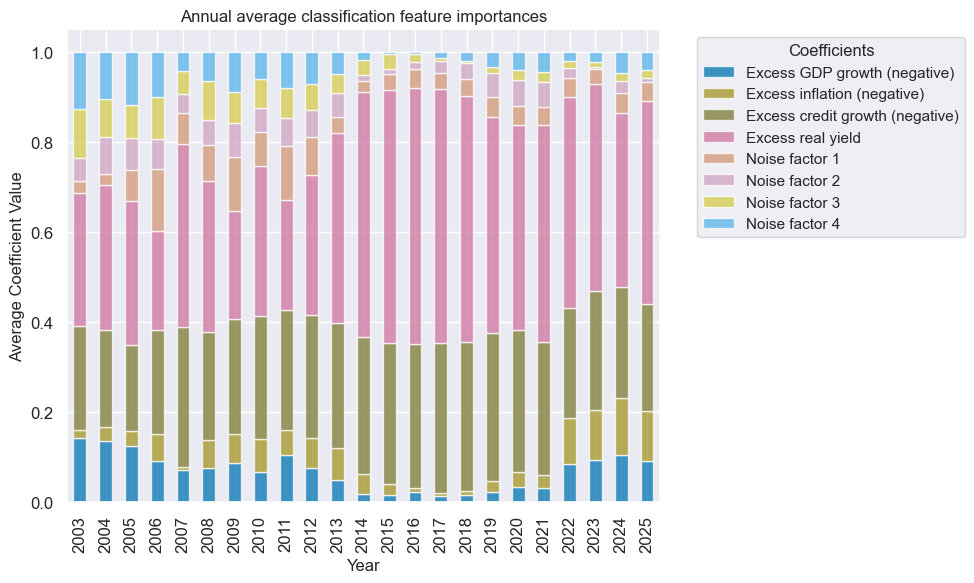
The “heatmap” displays the actual selected model, which changes frequently in the first ten years, but the settled on LASSO selector with a low penalty (0.01) and a panel test selector with a restrictive p-value threshold of 1%:

xcatx = macroz + ["DU05YXR_VT10"]
cidx = cids_dux

so_fsz = msl.SignalOptimizer(
    df = dfx,
    xcats = xcatx,
    cids = cidx,
    blacklist = fxblack,
    freq = "M",
    lag = 1,
    xcat_aggs = ["last", "sum"]
)
so_fsz.calculate_predictions(
    name = "MACRO_OPTSELZ",
    models = mods_fsz,
    hyperparameters = grids_fsz,
    scorers = {"maptest": score_fsz},
    inner_splitters = {"Rolling": splitter_fsz},
    search_type = "grid",
    normalize_fold_results = False,
    cv_summary = "mean",
    min_cids = 4,
    min_periods = 36,
    test_size = 1,
    n_jobs_outer = -1,
)

# Get optimized signals and view models heatmap
dfa = so_fsz.get_optimized_signals()
som = so_fsz.models_heatmap(
    name="MACRO_OPTSELZ",
    cap=6,
    title="Optimal selection models over time",
    figsize=(18, 6),
)
display(som)

dfx = msm.update_df(dfx, dfa)
https://macrosynergy.com/notebooks.build/data-science/signal-optimization-basics/_images/8a4be06a179cfa8044d06230e61023afad3d56efdde457d0114e54c1d30e8fbb.png
None

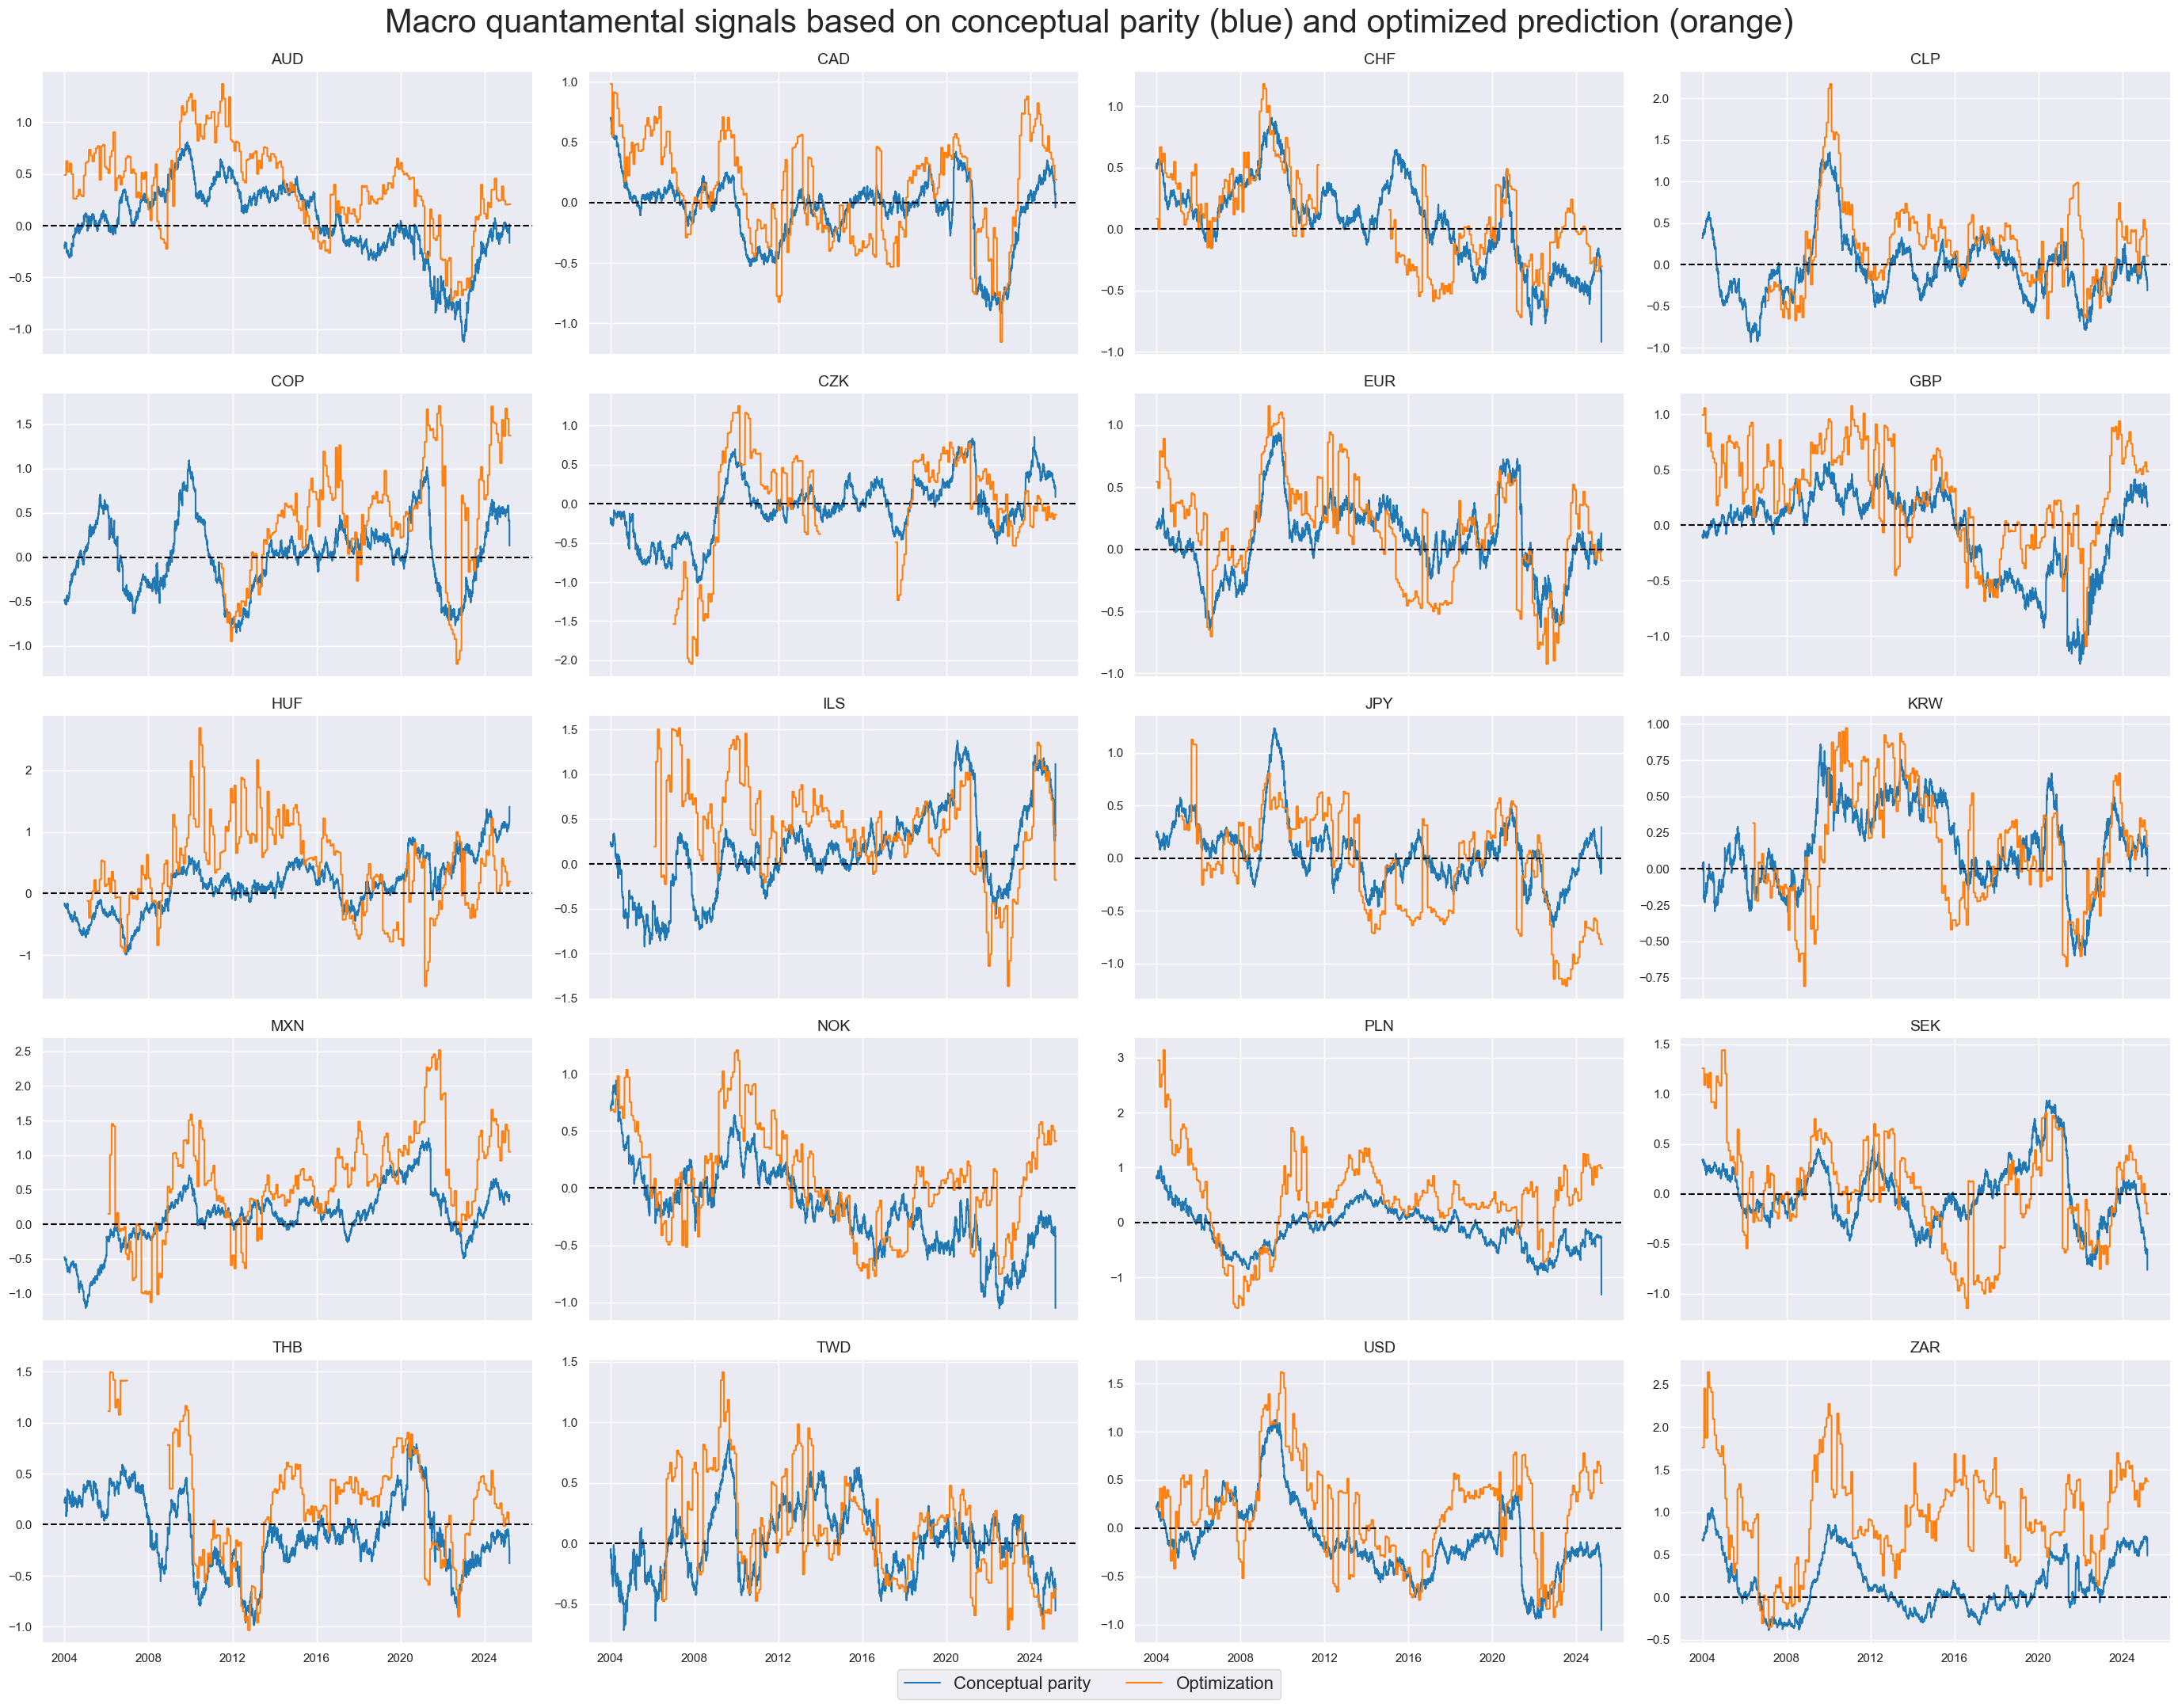
The function view_timelines() conveniently displays the original, non-optimized composite signal MACRO_AVGZ and the trading signal based on optimized feature selection MACRO_OPTSELZ , which shares a good part of the dynamics, but displays more abrupt changes and higher volatility due to frequent model changes.

xcatx = ["MACRO_AVGZ", "MACRO_OPTSELZ"]

msp.view_timelines(
    dfx,
    xcats=xcatx,
    cids=cids_dux,
    ncol=4,
    start="2004-01-01",
    title="Composite signal scores: simple (blue) and with sequentially optimized selection (orange)",
    title_fontsize=30,
    same_y=False,
    cs_mean=False,
    xcat_labels=["Simple average score", "Average score with optimized selection"],
    legend_fontsize=16,
)
https://macrosynergy.com/notebooks.build/data-science/signal-optimization-basics/_images/93bbe629f9b1afe900609a59718a5040fa3afc08935c7e1a99ef26ce65d5105b.png

Value checks #

This part tests accuracy and significance levels for the non-optimized composite signal MACRO_AVGZ and the trading signal based on optimized feature selection MACRO_OPTSELZ according to the common metrics of accuracy, precision and probability values.

The SignalReturnRelations class from the macrosynergy.signal module is specifically designed to analyze, visualize, and compare the relationships between panels of trading signals ( MACRO_AVGZ and MACRO_OPTSELZ ) and panels of subsequent returns ( DU05YXR_VT10 ).

## Compare optimized signals with simple average z-scores

srr = mss.SignalReturnRelations(
    df=dfx,
    rets=["DU05YXR_VT10"],
    sigs=["MACRO_AVGZ", "MACRO_OPTSELZ"],
    cosp=True,
    freqs=["M"],
    agg_sigs=["last"],
    start="2004-01-01",
    blacklist=fxblack,
    slip=1,
)

tbl_srr = srr.signals_table()

The interpretations of the columns of the summary table can be found here

display(tbl_srr.astype("float").round(3))
accuracy bal_accuracy pos_sigr pos_retr pos_prec neg_prec pearson pearson_pval kendall kendall_pval auc
Return Signal Frequency Aggregation
DU05YXR_VT10 MACRO_AVGZ M last 0.540 0.537 0.546 0.535 0.569 0.505 0.094 0.0 0.058 0.0 0.537
MACRO_OPTSELZ M last 0.543 0.543 0.505 0.535 0.578 0.508 0.101 0.0 0.067 0.0 0.543

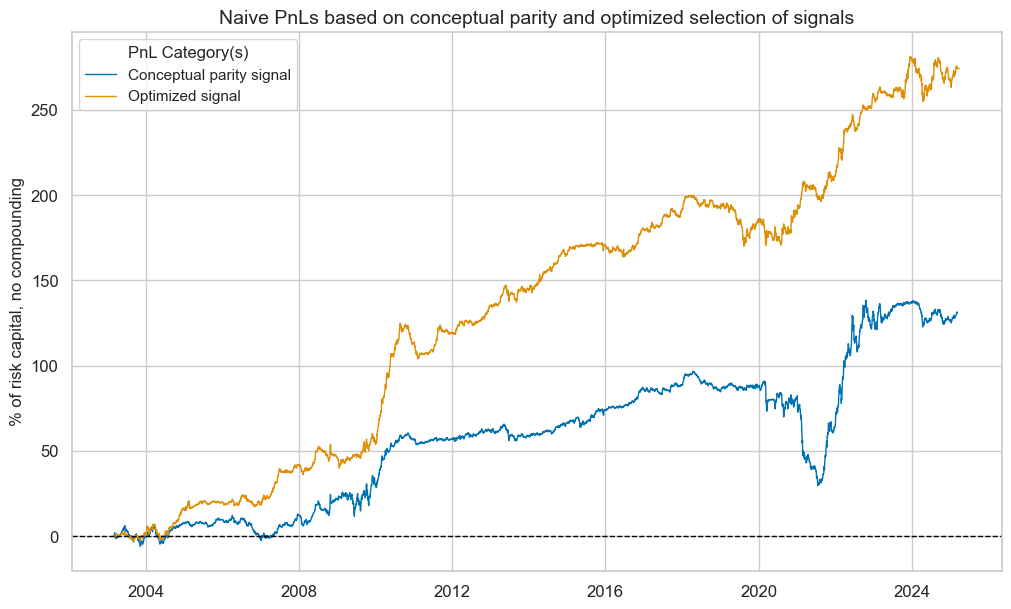
NaivePnl() class is designed to provide a quick and simple overview of a stylized PnL profile of a set of trading signals. The class is labeled naive because its methods do not consider transaction costs or position limitations, such as risk management considerations. This is deliberate because costs and limitations are specific to trading size, institutional rules, and regulations.

Here, the comparison is made between PnLs based on two signals, MACRO_AVGZ and MACRO_OPTSELZ . Here are the main options chosen for the calculation:

  • The target is DU05YXR_VT10 ,

  • the rebalancing frequency ( rebal_freq ) for positions according to signal is chosen monthly,

  • rebalancing slippage ( rebal_slip ) in days is 1, which means that it takes one day to rebalance the position and that the new position produces PnL from the second day after the signal has been recorded,

  • zn_score_pan option transforms raw signals into z-scores around zero value based on the whole panel. The neutral level & standard deviation will use the cross-section of panels. Zn-score here means standardized score with zero being the neutral level and standardization through division by mean absolute value,

  • threshold value ( thresh ) beyond which scores are winsorized, i.e., contained at that threshold. This is often realistic, as risk management and the potential of signal value distortions typically preclude outsized and concentrated positions within a strategy. We apply a threshold of 3.

plot_pnls() method of the NaivePnl() class is used to plot a line chart of cumulative PnL associated with both signals

sigs = ["MACRO_AVGZ", "MACRO_OPTSELZ"]


pnl = msn.NaivePnL(
    df=dfx,
    ret="DU05YXR_VT10",
    sigs=sigs,
    cids=cids,
    start="2004-01-01",
    blacklist=fxblack,
    bms="USD_DU05YXR_NSA",
)
for sig in sigs:
    pnl.make_pnl(
        sig=sig,
        sig_op="zn_score_pan",
        rebal_freq="monthly",
        neutral="zero",
        rebal_slip=1,
        vol_scale=10,
        thresh=3,
    )


pnl.plot_pnls(
    title="Naive PnLs for average scores, simple and optimized selection",
    title_fontsize=14,
    xcat_labels=["Simple average score", "Average score with optimized selection"],
)
pcats = ["PNL_" + sig for sig in sigs]
USD_DU05YXR_NSA has no observations in the DataFrame.
https://macrosynergy.com/notebooks.build/data-science/signal-optimization-basics/_images/c262e5d23d8aa2afda701dec6ed47181c31b6f2204df97dd672cd7f931c910d6.png

The method evaluate_pnls() returns a small dataframe of key PnL statistics for the tested strategies

pnl.evaluate_pnls(pnl_cats=pcats)
xcat PNL_MACRO_AVGZ PNL_MACRO_OPTSELZ
Return % 10.264162 11.275406
St. Dev. % 10.0 10.0
Sharpe Ratio 1.026416 1.127541
Sortino Ratio 1.599642 1.691901
Max 21-Day Draw % -22.306854 -18.372961
Max 6-Month Draw % -31.316263 -19.03049
Peak to Trough Draw % -37.552718 -30.130581
Top 5% Monthly PnL Share 0.743958 0.60466
Traded Months 251 251

Prediction #

Sequential optimization #

The second application of statistical learning methods involves choosing sequentially an optimal prediction method of monthly target returns and then applying it as a signal. Thus, at the end of each month, the method uses the optimized hyperparameters and parameters, which are then used to derive a signal for the next month.

Two possible models are defined here:

  • Linear regression model with and without intercept. By specifying positive=True , we force the coefficients to be positive

  • k nearest neighbors regression . This is a non-parametric regression that can be implemented with scikit-learn’s KNeighborsRegressor. Here, we specify the possible set for the number of neighbors as [4, 8, 16, 32, 64, 128, 256, 512, 1024, 2048, 4096], and the weights function used in prediction. The choices here are:

    • ‘uniform’: uniform weights, where all points in each neighborhood are weighted equally.

    • ‘distance’: weight points by the inverse of their distance. in this case, closer neighbors of a query point will have a greater influence than neighbors which are further away.

# Define models and grids for optimization
mods_reg = {"knnr": KNeighborsRegressor(), "linreg": LinearRegression(positive=True)}

grids_reg = {
    "knnr": {
        "n_neighbors": [2**i for i in range(2, 9)],
        "weights": ["uniform", "distance"],
    },
    "linreg": {"fit_intercept": [True, False]},
}

The standard make_scorer() function from the scikit-learn library is used to create a scorer object that can be used to evaluate the performance on the test set. The scorer function is based on the R-squared (coefficient of determination) regression score function, and the chosen cross-validation split here is the RollingKFoldPanelSplit .

# Define the optimization criterion
score_reg = make_scorer(r2_score, greater_is_better=True)

# Define splits for cross-validation
splitter_reg = msl.RollingKFoldPanelSplit(n_splits=5)

As for feature selection, the sequential model selection and optimized predictions can be executed by the SignalOptimizer class from the macrosynergy package. And the actual choice of a particular model is displayed with the help of “heatmap”. We note greater stability of the model than with feature selection. Interestingly, the simpler linear regression models are prefered to nearest neighbor models over the trading history.

xcatx = macroz + ["DU05YXR_VT10"]
cidx = cids_dux

so_reg = msl.SignalOptimizer(
    df = dfx,
    xcats = xcatx,
    cids = cidx,
    blacklist = fxblack,
    freq = "M",
    lag = 1,
    xcat_aggs = ["last", "sum"]
)
so_reg.calculate_predictions(
    name = "MACRO_OPTREG",
    models = mods_reg,
    hyperparameters = grids_reg,
    scorers = {"r2": score_reg},
    inner_splitters = {"Rolling": splitter_reg},
    search_type = "grid",
    normalize_fold_results = False,
    cv_summary = "mean",
    min_cids = 4,
    min_periods = 36,
    test_size = 1,
    n_jobs_outer = -1,
)

# Get optimized signals and view models heatmap
dfa = so_reg.get_optimized_signals()
som = so_reg.models_heatmap(
    name="MACRO_OPTREG",
    cap=6,
    title="Optimal regression model used over time",
    figsize=(18, 6),
)
display(som)

dfx = msm.update_df(dfx, dfa)
https://macrosynergy.com/notebooks.build/data-science/signal-optimization-basics/_images/a4d8aeccd9928f71a8f8ca39dd379265199a77da21759667597e9454f3c17f9a.png
None

The function view_timelines() conveniently displays the original, non-optimized composite signal MACRO_AVGZ together with the optimized regression-based predictor MACRO_OPTREG . The latter displays a long bias compared with the non-optimized signal.

xcatx = ["MACRO_AVGZ", "MACRO_OPTREG"]

msp.view_timelines(
    dfx,
    xcats=xcatx,
    cids=cids_dux,
    ncol=4,
    start="2004-01-01",
    title="Composite signal score (blue) and sequentially optimized regression-based forecast (orange)",
    title_fontsize=30,
    same_y=False,
    cs_mean=False,
    xcat_labels=["Simple average score", "Sequentially optimized forecasts"],
    legend_fontsize=16,
)
https://macrosynergy.com/notebooks.build/data-science/signal-optimization-basics/_images/350bc49109c1a030e5c8800042ad44a016711278fe46c5fa0856ea8c6837e309.png

Value checks #

This part again tests the accuracy and significance levels for the MACRO_AVGZ and the optimized regression-based predictor MACRO_OPTREG according to the common metrics of accuracy, precision and probability values. The SignalReturnRelations class from the macrosynergy.signal module is specifically designed to analyze, visualize, and compare the relationships between panels of trading signals ( MACRO_AVGZ and MACRO_OPTREG ) and panels of subsequent returns ( DU05YXR_VT10 ).

## Compare optimized signals with simple average z-scores

srr = mss.SignalReturnRelations(
    df=dfx,
    rets=["DU05YXR_VT10"],
    sigs=["MACRO_AVGZ", "MACRO_OPTREG"],
    cosp=True,
    freqs=["M"],
    agg_sigs=["last"],
    start="2004-01-01",
    blacklist=fxblack,
    slip=1,
)

tbl_srr = srr.signals_table()

The interpretations of the columns of the summary table can be found here

display(tbl_srr.astype("float").round(3))
accuracy bal_accuracy pos_sigr pos_retr pos_prec neg_prec pearson pearson_pval kendall kendall_pval auc
Return Signal Frequency Aggregation
DU05YXR_VT10 MACRO_AVGZ M last 0.540 0.537 0.546 0.535 0.569 0.505 0.094 0.0 0.058 0.0 0.537
MACRO_OPTREG M last 0.549 0.541 0.731 0.536 0.557 0.524 0.086 0.0 0.056 0.0 0.532

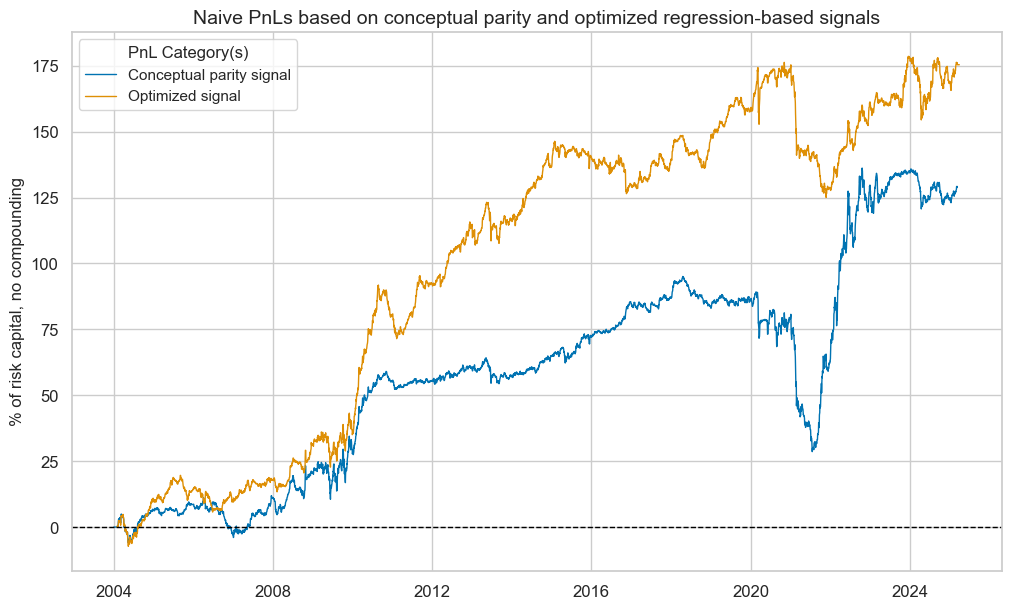
As with feature selection, we use NaivePnl() class to provide a quick and simple overview of a stylized PnL profile of a set of trading signals.

Here, the comparison is made between PnLs based on two signals, MACRO_AVGZ and MACRO_OPTREG , and we choose the same parameters as above:

  • The target is DU05YXR_VT10 ,

  • the rebalancing frequency ( rebal_freq ) for positions according to signal is chosen monthly,

  • rebalancing slippage ( rebal_slip ) in days is 1

  • The zn_score_pan option transforms raw signals into z-scores around zero value based on the whole panel.

  • threshold value ( thresh ) is 3.

plot_pnls() method of the NaivePnl() class is used to plot a line chart of cumulative PnL associated with both signals.

sigs = ["MACRO_AVGZ", "MACRO_OPTREG"]


pnl = msn.NaivePnL(
    df=dfx,
    ret="DU05YXR_VT10",
    sigs=sigs,
    cids=cids,
    start="2004-01-01",
    blacklist=fxblack,
    bms="USD_DU05YXR_NSA",
)
for sig in sigs:
    pnl.make_pnl(
        sig=sig,
        sig_op="zn_score_pan",
        rebal_freq="monthly",
        neutral="zero",
        rebal_slip=1,
        vol_scale=10,
        thresh=3,
    )

pnl.plot_pnls(
    title="Naive PnLs for average scores and optimized regression forecasts",
    title_fontsize=14,
    xcat_labels=["Simple average score", "Optimized regression forecasts"],
)
pcats = ["PNL_" + sig for sig in sigs]
USD_DU05YXR_NSA has no observations in the DataFrame.
https://macrosynergy.com/notebooks.build/data-science/signal-optimization-basics/_images/6ab8d8be7d4ac1f9ca0d339723aa5527af3445c0b82a56d20d7ecf1908d97a9f.png

The method evaluate_pnls() returns a small dataframe of key PnL statistics for the tested strategies

pnl.evaluate_pnls(pnl_cats=pcats)
xcat PNL_MACRO_AVGZ PNL_MACRO_OPTREG
Return % 10.264162 9.909633
St. Dev. % 10.0 10.0
Sharpe Ratio 1.026416 0.990963
Sortino Ratio 1.599642 1.432351
Max 21-Day Draw % -22.306854 -16.646417
Max 6-Month Draw % -31.316263 -24.174335
Peak to Trough Draw % -37.552718 -43.719384
Top 5% Monthly PnL Share 0.743958 0.587526
Traded Months 251 251

Classification #

The third statistical learning application is the classification of rates market environment into “good” or “bad” for subsequent monthly IRS receiver returns. For that, the dummy variable MACRO_AVGZ_SIGN is added to the dataframe. It receives the value of +1 if MACRO_AVGZ is positive and -1 otherwise.

Sequential optimization #

# Calculate categorical series
ys = np.sign(y)
calcs = [
    "MACRO_AVGZ_SIGN = np.sign( MACRO_AVGZ )"
]
dfa = msp.panel_calculator(dfx, calcs=calcs, cids=cids)
dfx = msm.update_df(dfx, dfa)

Two models are defined:

  • knncls is a K-nearest neighbors classifier with

    • number of neighbours from the set [4, 16, 64, 256, 1024, 4096]

    • the choice of

      • ‘uniform’: uniform weights, where all points in each neighborhood are weighted equally.

      • ‘distance’: weight points by the inverse of their distance. in this case, closer neighbors of a query point will have a greater influence than neighbors which are further away

  • logreg is a logistic regression with and without intercept.

# Define models and grids for optimization
mods_cls = {"knncls" : KNeighborsClassifier(), "logreg": LogisticRegression()}

grids_cls = {
    "knncls": {
        "n_neighbors": [2**i for i in range(2, 9)],
        "weights": ["uniform", "distance"],
    },
    "logreg": {"fit_intercept": [True, False]},
}

The standard make_scorer() function from the scikit-learn library is used to create a scorer object that can be used to evaluate the performance on the test set. The scorer function balanced_accuracy_score , i.e., the average of recall obtained on each class. This function is more suitable for imbalanced datasets than simple accuracy_score .

# Define the optimization criterion
score_cls = make_scorer(balanced_accuracy_score) 

# Define splits for cross-validation
splitter_cls = msl.RollingKFoldPanelSplit(n_splits=5)

The actual model is then selected using SignalOptimizer class from the macrosynergy package. This class calculates the new optimized indicator MACRO_OPTCLASS according to the two specified models with respective parameters, and then the actual selection at each point is displayed using the “heatmap”. The heatmap reveals a strong preference for classification through logistic regression without intercept, the most restrictive model on the menu.

xcatx = macroz + ["DU05YXR_VT10"]
cidx = cids_dux

so_cls = msl.SignalOptimizer(
    df = dfx,
    xcats = xcatx,
    cids = cidx,
    blacklist = fxblack,
    freq = "M",
    lag = 1,
    xcat_aggs = ["last", "sum"],
    generate_labels= lambda x: 1 if x >= 0 else -1
)
so_cls.calculate_predictions(
    name = "MACRO_OPTCLASS",
    models = mods_cls,
    hyperparameters = grids_cls,
    scorers = {"bac": score_cls},
    inner_splitters = {"Rolling": splitter_cls},
    search_type = "grid",
    normalize_fold_results = False,
    cv_summary = "mean",
    min_cids = 4,
    min_periods = 36,
    test_size = 1,
    n_jobs_outer = -1,
)

# Get optimized signals and view models heatmap
dfa = so_cls.get_optimized_signals()
som = so_cls.models_heatmap(
    name="MACRO_OPTCLASS",
    cap=6,
    title="Optimal classification model used over time",
    figsize=(18, 6),
)
display(som)

dfx = msm.update_df(dfx, dfa)
https://macrosynergy.com/notebooks.build/data-science/signal-optimization-basics/_images/dc0337ae75a41bb6bf5c31c00349737c55115f4535489cac9f2e194016f3a94a.png
None

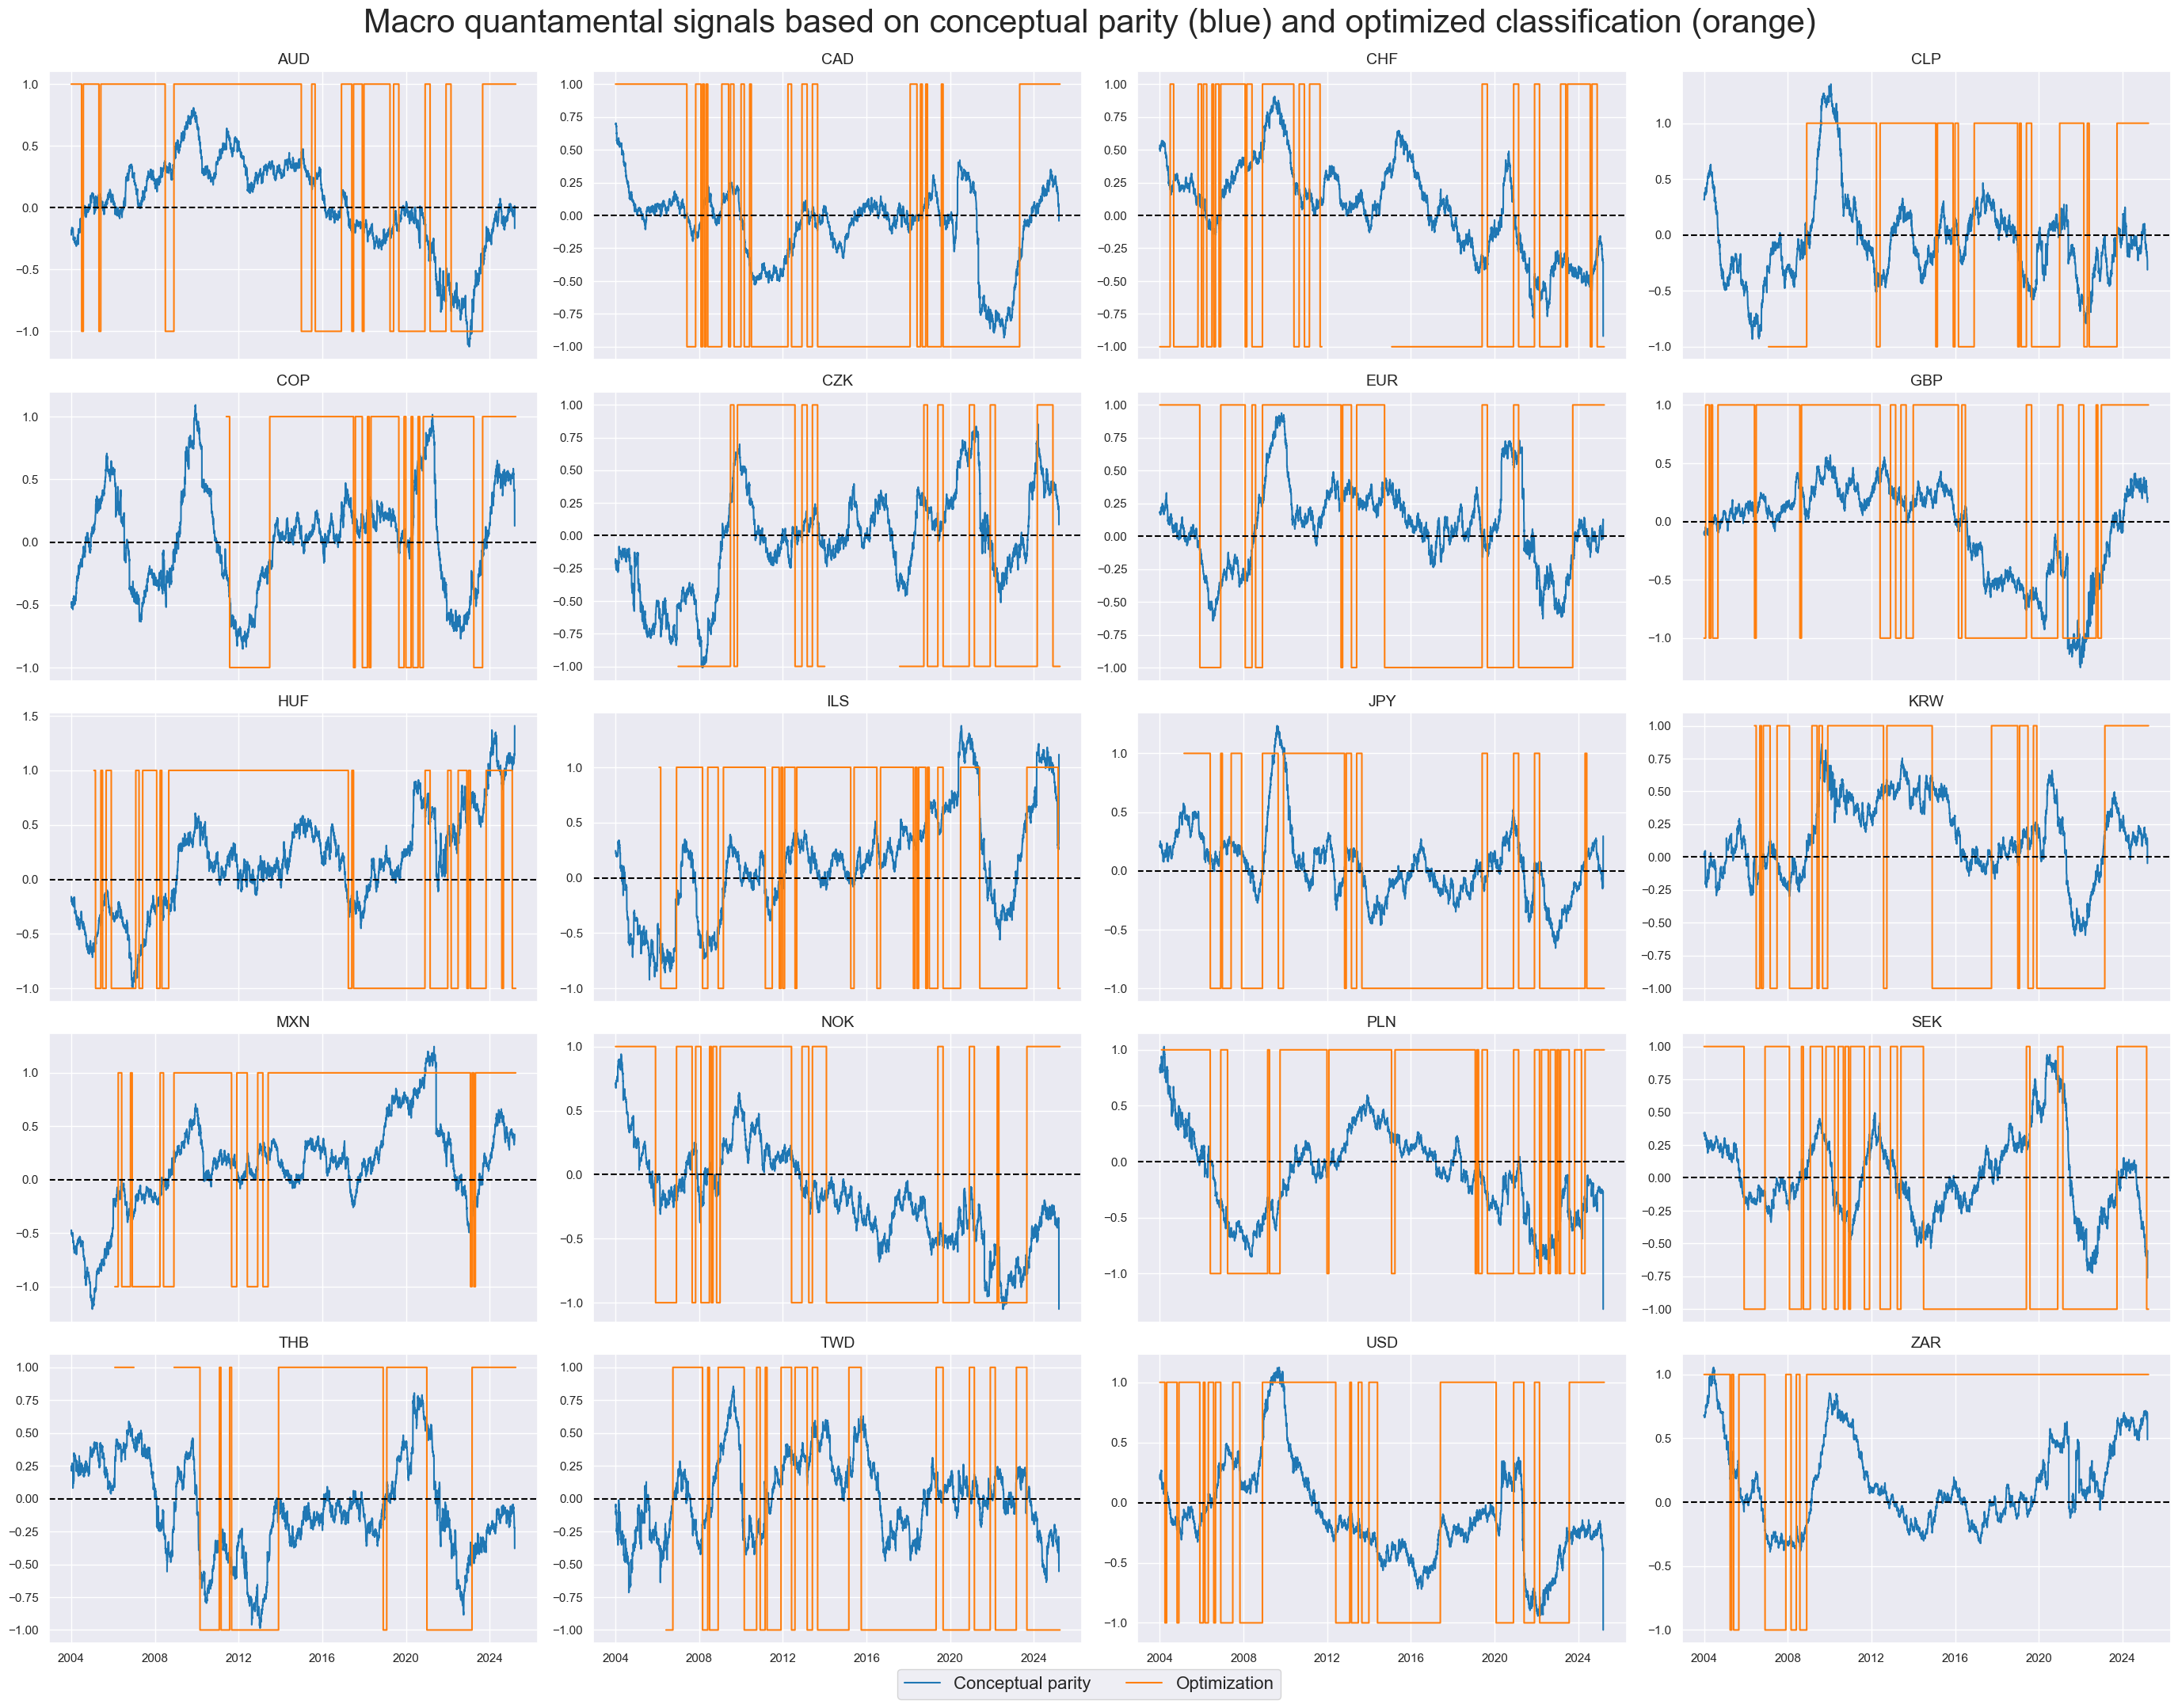
The function view_timelines() conveniently displays the original, non-optimized composite signal MACRO_AVGZ and the Optimized classifier MACRO_OPTCLASS .

xcatx = ["MACRO_AVGZ", "MACRO_OPTCLASS"]

msp.view_timelines(
    dfx,
    xcats=xcatx,
    cids=cids_dux,
    ncol=4,
    start="2004-01-01",
    title="Composite signal score (blue) and sequentially optimized classification (orange)",
    title_fontsize=30,
    same_y=False,
    cs_mean=False,
    xcat_labels=["Simple average score", "Sequentially optimized classification"],
    legend_fontsize=16,
)
https://macrosynergy.com/notebooks.build/data-science/signal-optimization-basics/_images/3c12046d41cc233f73161a0ed480268c6a09ee8fedb8f8d4bf99fbce426ddc9b.png

Value checks #

This part tests accuracy and significance levels for the non-optimized composite signal MACRO_AVGZ and the trading signal based on optimized feature selection MACRO_OPTSELZ according to the standard metrics of accuracy, precision and probability values. .

The SignalReturnRelations class from the macrosynergy.signal module is specifically designed to analyze, visualize, and compare the relationships between panels of trading signals and panels of subsequent returns.

## Compare optimized signals with simple average z-scores

srr = mss.SignalReturnRelations(
    df=dfx,
    rets=["DU05YXR_VT10"],
    sigs=["MACRO_AVGZ", "MACRO_OPTCLASS"],
    cosp=True,
    freqs=["M"],
    agg_sigs=["last"],
    start="2004-01-01",
    blacklist=fxblack,
    slip=1,
)

tbl_srr = srr.signals_table()

The interpretations of the columns of the summary table can be found here

display(tbl_srr.astype("float").round(3))
accuracy bal_accuracy pos_sigr pos_retr pos_prec neg_prec pearson pearson_pval kendall kendall_pval auc
Return Signal Frequency Aggregation
DU05YXR_VT10 MACRO_AVGZ M last 0.540 0.537 0.546 0.535 0.569 0.505 0.094 0.0 0.058 0.0 0.537
MACRO_OPTCLASS M last 0.541 0.538 0.536 0.536 0.571 0.506 0.077 0.0 0.065 0.0 0.538

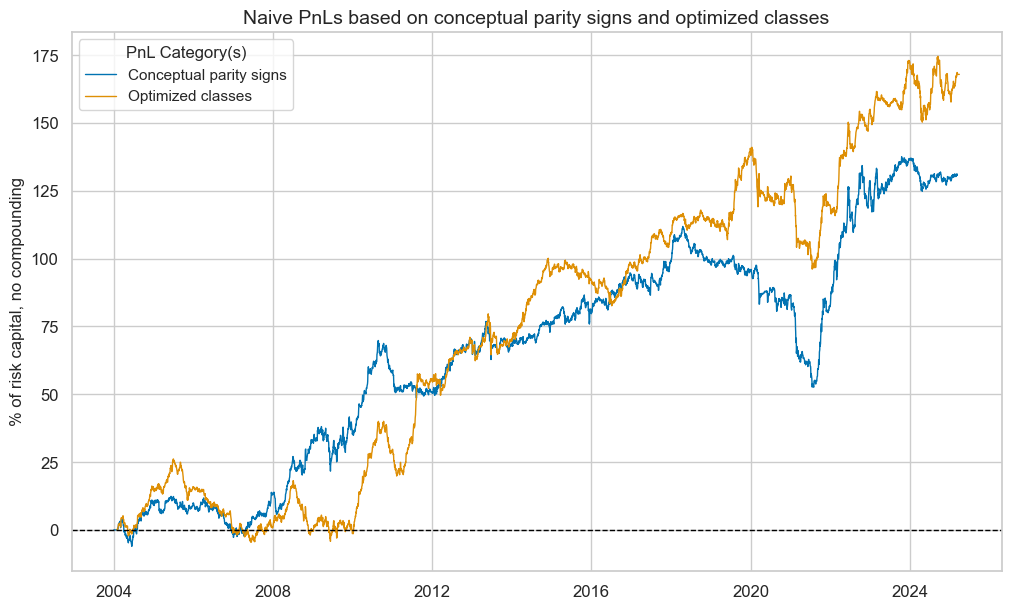
As with feature selection and prediction, we use NaivePnl() class to provide a quick and simple overview of a stylized PnL profile of a set of trading signals.

Here, the comparison is made between PnLs based on two signals, MACRO_AVGZ and MACRO_OPTCLASS , and we choose the same parameters as above:

  • The target is DU05YXR_VT10 ,

  • the rebalancing frequency ( rebal_freq ) for positions according to signal is chosen monthly,

  • rebalancing slippage ( rebal_slip ) in days is 1

  • zn_score_pan option, which transforms raw signals into z-scores around zero value based on the whole panel.

  • threshold value ( thresh ) is 3.

plot_pnls() method of the NaivePnl() class is used to plot a line chart of cumulative PnL associated with both signals.

sigs = ["MACRO_AVGZ", "MACRO_OPTCLASS"]


pnl = msn.NaivePnL(
    df=dfx,
    ret="DU05YXR_VT10",
    sigs=sigs,
    cids=cids,
    start="2004-01-01",
    blacklist=fxblack,
)
for sig in sigs:
    pnl.make_pnl(
        sig=sig,
        sig_op="binary",
        rebal_freq="monthly",
        neutral="zero",
        rebal_slip=1,
        vol_scale=10,
        thresh=3,
    )

pnl.plot_pnls(
    title="Naive PnLs for average score signs and optimized classifications",
    title_fontsize=14,
    xcat_labels=["Simple average score signs", "Optimized classifications"],
)
pcats = ["PNL_" + sig for sig in sigs]
https://macrosynergy.com/notebooks.build/data-science/signal-optimization-basics/_images/4a35d17999a75fb714fede16afa5d70c0779fa922a4358d88347dc6202d36c9f.png

The method evaluate_pnls() returns a small dataframe of key PnL statistics for the tested strategies

pnl.evaluate_pnls(pnl_cats=pcats)
xcat PNL_MACRO_AVGZ PNL_MACRO_OPTCLASS
Return % 10.786192 10.454272
St. Dev. % 10.0 10.0
Sharpe Ratio 1.078619 1.045427
Sortino Ratio 1.564135 1.558914
Max 21-Day Draw % -22.491303 -19.074865
Max 6-Month Draw % -35.775242 -22.894752
Peak to Trough Draw % -45.596183 -28.025411
Top 5% Monthly PnL Share 0.590013 0.570189
Traded Months 251 251

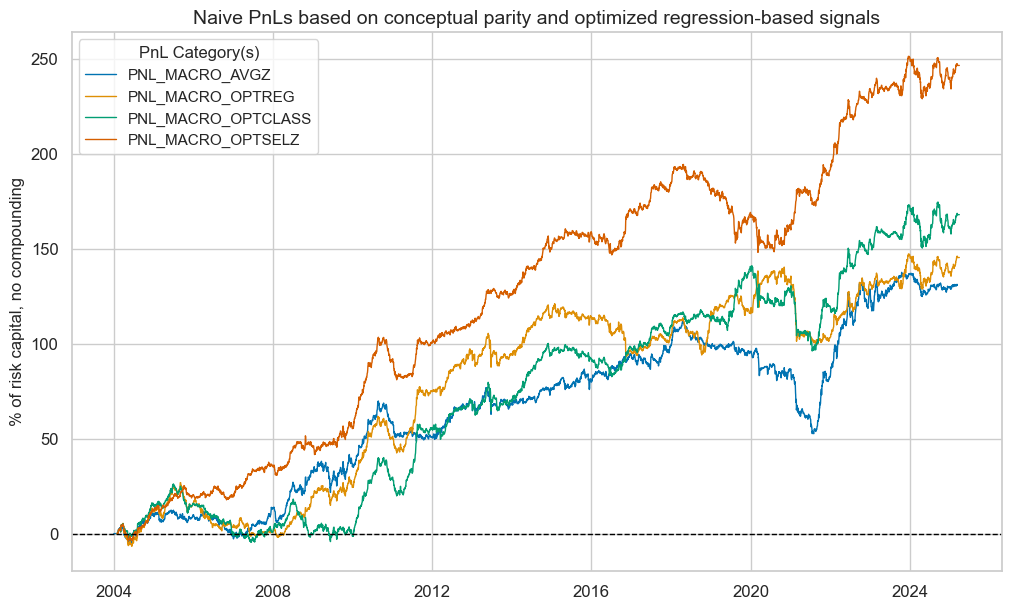
The model selection heatmap in this section indicates that starting from approximately 2009, the algorithm consistently opts for logistic regression without an intercept. When running profit and loss (PnL) analyses from 2009, the optimized classifier yields even more noteworthy outcomes:

sigs = ["MACRO_AVGZ", "MACRO_OPTCLASS"]


pnl = msn.NaivePnL(
    df=dfx,
    ret="DU05YXR_VT10",
    sigs=sigs,
    cids=cids,
    start="2009-01-01",
    blacklist=fxblack,
    bms="USD_DU05YXR_NSA",
)
for sig in sigs:
    pnl.make_pnl(
        sig=sig,
        sig_op="binary",
        rebal_freq="monthly",
        neutral="zero",
        rebal_slip=1,
        vol_scale=10,
        thresh=3,
    )

pnl.plot_pnls(
    title="Naive PnLs for average score signs and optimized classifications, post 2008",
    title_fontsize=14,
    xcat_labels=["Simple average score signs", "Optimized classifications"],
)
pcats = ["PNL_" + sig for sig in sigs]
USD_DU05YXR_NSA has no observations in the DataFrame.
https://macrosynergy.com/notebooks.build/data-science/signal-optimization-basics/_images/35ddaa97a858b7a19ec11a3e9156198ce7f176ff19eb087a35e380bc77b3d2aa.png
pnl.evaluate_pnls(pnl_cats=pcats)
xcat PNL_MACRO_AVGZ PNL_MACRO_OPTCLASS
Return % 11.107071 12.493167
St. Dev. % 10.0 10.0
Sharpe Ratio 1.110707 1.249317
Sortino Ratio 1.610543 1.87692
Max 21-Day Draw % -20.712568 -17.807419
Max 6-Month Draw % -32.94594 -21.37349
Peak to Trough Draw % -41.990188 -26.163239
Top 5% Monthly PnL Share 0.58647 0.471872
Traded Months 191 191