Machine learning for international trading strategies #
Get packages and JPMaQS data #
import numpy as np
import pandas as pd
from pandas import Timestamp
import matplotlib.pyplot as plt
import seaborn as sns
from scipy.stats import norm
import itertools

import warnings
import os
from datetime import date

import macrosynergy.management as msm
import macrosynergy.panel as msp
import macrosynergy.signal as mss
import macrosynergy.learning as msl
import macrosynergy.pnl as msn
import macrosynergy.visuals as msv
from macrosynergy.download import JPMaQSDownload
from macrosynergy.management.utils import merge_categories

from sklearn.linear_model import Ridge
from sklearn.metrics import make_scorer, root_mean_squared_error
from sklearn.pipeline import Pipeline

warnings.simplefilter("ignore")
# Cross-sections of interest

cids_dmeq = ["AUD", "CAD", "CHF", "EUR", "GBP", "JPY", "SEK", "USD"]
cids_aseq = ["KRW", "MYR", "SGD", "THB", "TWD"]
cids_exeq = ["BRL", "TRY", "ZAR"]
cids_nueq = ["MXN", "PLN"]

cids_emeq = cids_aseq + cids_exeq + cids_nueq

cids_eq = sorted(cids_dmeq + cids_emeq)
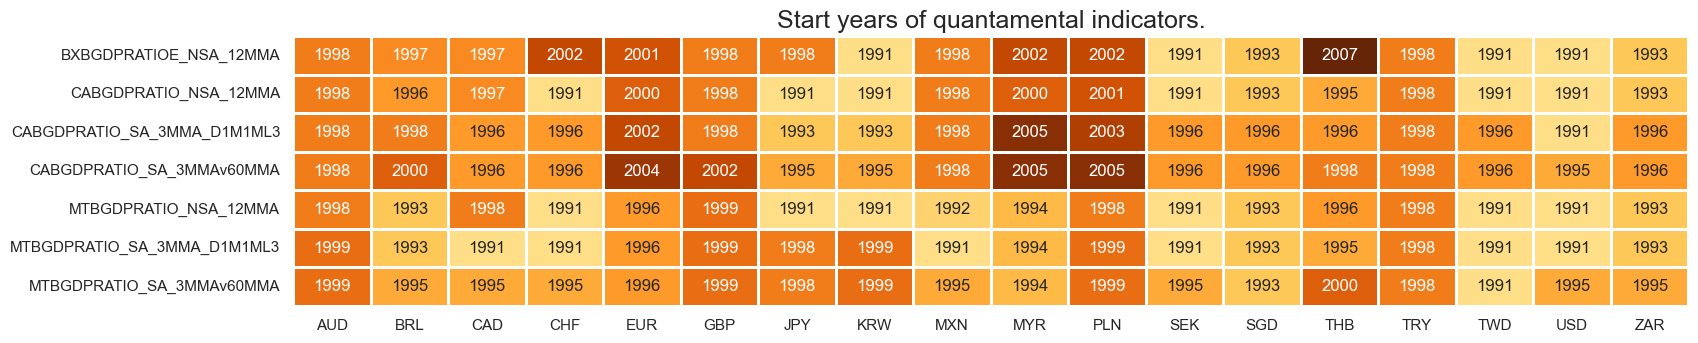
# External balances and changes
xbal = [
"BXBGDPRATIOE_NSA_12MMA",
"CABGDPRATIO_NSA_12MMA",
"MTBGDPRATIO_NSA_12MMA",
]
xbal_chg = [
"CABGDPRATIO_SA_3MMA_D1M1ML3",
"CABGDPRATIO_SA_1QMA_D1Q1QL1",
"CABGDPRATIO_SA_3MMAv60MMA",
"CABGDPRATIO_SA_1QMAv20QMA",
"MTBGDPRATIO_SA_3MMA_D1M1ML3",
"MTBGDPRATIO_SA_3MMAv60MMA",
]
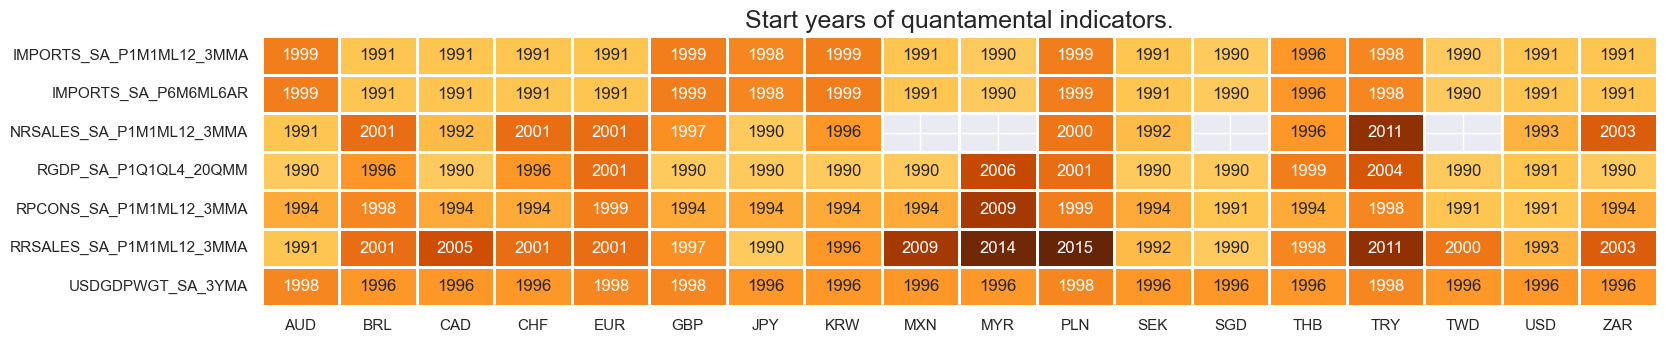
# Domestic spending growth
imports = [
"IMPORTS_SA_P6M6ML6AR",
"IMPORTS_SA_P1M1ML12_3MMA",
]
rsales = [
"NRSALES_SA_P1M1ML12_3MMA",
"RRSALES_SA_P1M1ML12_3MMA",
"NRSALES_SA_P1Q1QL4",
"RRSALES_SA_P1Q1QL4",
]
pcons = [
"RPCONS_SA_P1M1ML12_3MMA",
"RPCONS_SA_P1Q1QL4",
]
domspend = imports + rsales + pcons
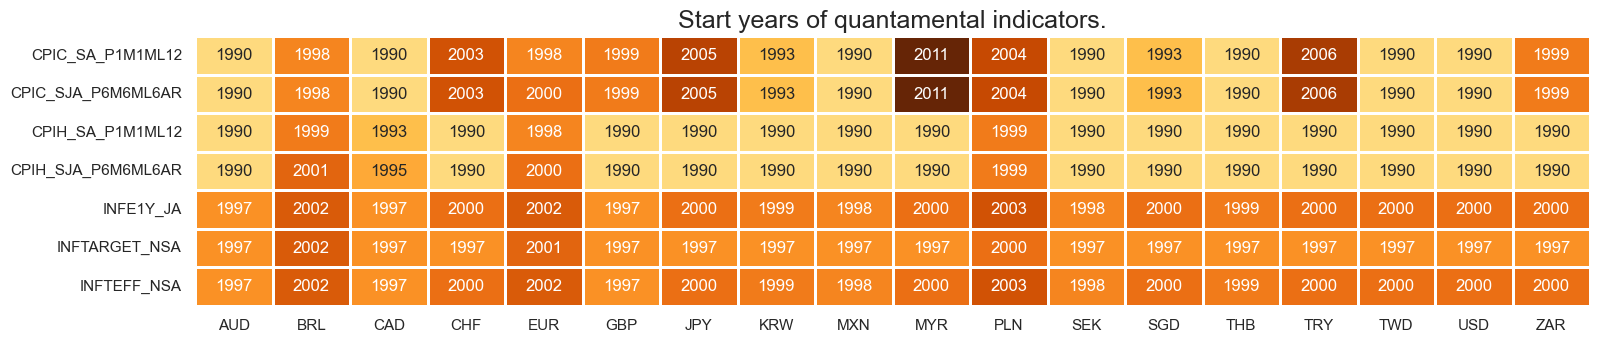
# CPI inflation
cpi = [
"CPIH_SA_P1M1ML12",
"CPIH_SJA_P6M6ML6AR",
"CPIC_SA_P1M1ML12",
"CPIC_SJA_P6M6ML6AR",
]
# Labor market
labor = [
"EMPL_NSA_P1M1ML12_3MMA",
"EMPL_NSA_P1Q1QL4",
"UNEMPLRATE_NSA_3MMA_D1M1ML12",
"UNEMPLRATE_NSA_D1Q1QL4",
]
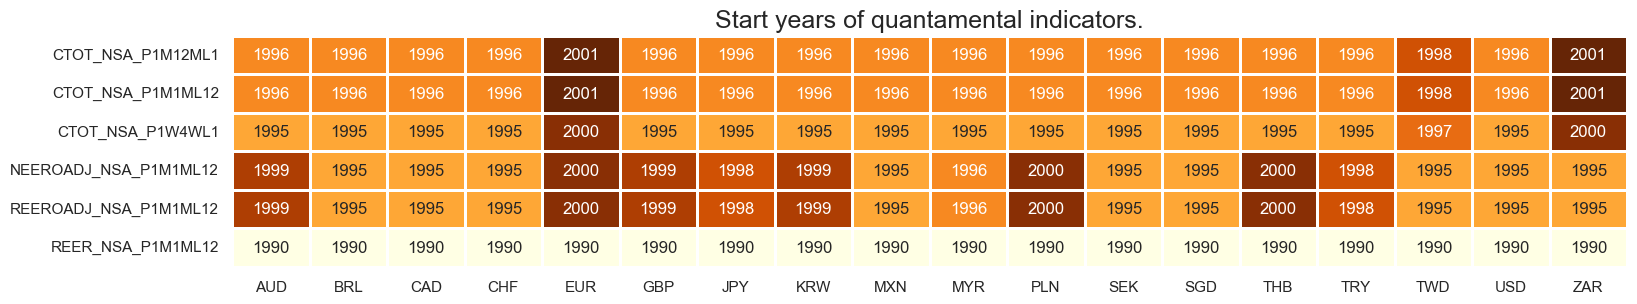
# FX dynamics and terms of trade
effx = [
"REEROADJ_NSA_P1M1ML12",
"NEEROADJ_NSA_P1M1ML12",
"REER_NSA_P1M1ML12",
]
ctot = [
"CTOT_NSA_P1M1ML12",
"CTOT_NSA_P1M12ML1",
"CTOT_NSA_P1W4WL1",
]
# Business confidence and changes
bus_conf = [
# Manufacturing
"MBCSCORE_SA",
"MBCSCORE_SA_3MMA",
# Services
"SBCSCORE_SA",
"SBCSCORE_SA_3MMA",
# Construction
"CBCSCORE_SA",
"CBCSCORE_SA_3MMA",
]
bus_conf_chg = [
# Manufacturing confidence
"MBCSCORE_SA_D3M3ML3",
"MBCSCORE_SA_D1Q1QL1",
"MBCSCORE_SA_D6M6ML6",
"MBCSCORE_SA_D2Q2QL2",
# Services confidence
"SBCSCORE_SA_D3M3ML3",
"SBCSCORE_SA_D1Q1QL1",
"SBCSCORE_SA_D6M6ML6",
"SBCSCORE_SA_D2Q2QL2",
# Construction confidence
"CBCSCORE_SA_D3M3ML3",
"CBCSCORE_SA_D1Q1QL1",
"CBCSCORE_SA_D6M6ML6",
"CBCSCORE_SA_D2Q2QL2",
]
# Monetary and financial conditions
mon_agg = [
"MNARROW_SJA_P1M1ML12",
"MBROAD_SJA_P1M1ML12",
]
liq = [
"INTLIQGDP_NSA_D1M1ML1",
"INTLIQGDP_NSA_D1M1ML3",
"INTLIQGDP_NSA_D1M1ML6",
]
rir = [
"RIR_NSA",
"RYLDIRS02Y_NSA",
"RYLDIRS05Y_NSA",
]
# Supporting economic indicators
wforce = [
"WFORCE_NSA_P1Y1YL1_5YMM",
"WFORCE_NSA_P1Y1YL1",
"WFORCE_NSA_P1Q1QL4",
]
infes = [
"INFTEFF_NSA",
"INFTARGET_NSA",
"INFE1Y_JA"
]
nugdp = [
"RGDP_SA_P1Q1QL4_20QMM",
"USDGDPWGT_SA_3YMA",
]
extras = wforce + infes + nugdp
# Market indicators
markets = ["EQXR_NSA", "EQXR_VT10"]
# Composite lists
mains = (
rir
+ xbal
+ xbal_chg
+ domspend
+ cpi
+ liq
+ labor
+ effx
+ ctot
+ bus_conf
+ bus_conf_chg
+ mon_agg
)
supports = wforce + extras
xcats = mains + supports + markets
# Resultant tickers
tickers = [cid + "_" + xcat for cid in cids_eq for xcat in xcats]
print(f"Maximum number of tickers is {len(tickers)}")
Maximum number of tickers is 1260
client_id: str = os.getenv("DQ_CLIENT_ID")
client_secret: str = os.getenv("DQ_CLIENT_SECRET")

with JPMaQSDownload(oauth=True, client_id=client_id, client_secret=client_secret) as dq:
    assert dq.check_connection()
    df = dq.download(
        tickers=tickers,
        start_date="1990-01-01",
        suppress_warning=True,
        metrics=["value"],
        show_progress=True,
    )
    assert isinstance(df, pd.DataFrame) and not df.empty

print("Last updated:", date.today())
Downloading data from JPMaQS.
Timestamp UTC:  2025-07-24 11:06:43
Connection successful!
Requesting data: 100%|█████████████████████████████████████████████████████████████████| 61/61 [00:12<00:00,  4.80it/s]
Downloading data: 100%|████████████████████████████████████████████████████████████████| 61/61 [01:34<00:00,  1.54s/it]
Some expressions are missing from the downloaded data. Check logger output for complete list.
301 out of 1206 expressions are missing. To download the catalogue of all available expressions and filter the unavailable expressions, set `get_catalogue=True` in the call to `JPMaQSDownload.download()`.
Last updated: 2025-07-24
dfx = df.copy().sort_values(["cid", "xcat", "real_date"])
dfx.info()
<class 'pandas.core.frame.DataFrame'>
Index: 6579977 entries, 63562 to 6516039
Data columns (total 4 columns):
 #   Column     Dtype
---  ------     -----
 0   real_date  datetime64[ns]
 1   cid        object
 2   xcat       object
 3   value      float64
dtypes: datetime64[ns](1), float64(1), object(2)
memory usage: 251.0+ MB
Transformations and availability checks #
Renaming #
dict_repl = {
    # External balances
    "CABGDPRATIO_SA_1QMA_D1Q1QL1": "CABGDPRATIO_SA_3MMA_D1M1ML3",
    "CABGDPRATIO_SA_1QMAv20QMA": "CABGDPRATIO_SA_3MMAv60MMA",
    # Consumption
    "RPCONS_SA_P1Q1QL4": "RPCONS_SA_P1M1ML12_3MMA",
    "RRSALES_SA_P1Q1QL4": "RRSALES_SA_P1M1ML12_3MMA",
    "NRSALES_SA_P1Q1QL4": "NRSALES_SA_P1M1ML12_3MMA",
    # labor
    "EMPL_NSA_P1Q1QL4": "EMPL_NSA_P1M1ML12_3MMA",
    "UNEMPLRATE_NSA_D1Q1QL4": "UNEMPLRATE_NSA_3MMA_D1M1ML12",
    # Business confidence
    "MBCSCORE_SA_D1Q1QL1": "MBCSCORE_SA_D3M3ML3",
    "MBCSCORE_SA_D2Q2QL2": "MBCSCORE_SA_D6M6ML6",
    "SBCSCORE_SA_D1Q1QL1": "SBCSCORE_SA_D3M3ML3",
    "SBCSCORE_SA_D2Q2QL2": "SBCSCORE_SA_D6M6ML6",
    "CBCSCORE_SA_D1Q1QL1": "CBCSCORE_SA_D3M3ML3",
    "CBCSCORE_SA_D2Q2QL2": "CBCSCORE_SA_D6M6ML6",
}

# Ensure 'xcat' exists in dfx before replacement
if "xcat" in dfx.columns:
    dfx["xcat"] = dfx["xcat"].replace(dict_repl, regex=False)
else:
    print("Column 'xcat' not found in dfx.")
Availability #
# External balances and changes
xcatx = xbal + xbal_chg
msm.check_availability(df=dfx, xcats=xcatx, cids=cids_eq, missing_recent=False)
# Domestic spending growth and support benchmarks
xcatx = domspend + nugdp
msm.check_availability(df=dfx, xcats=xcatx, cids=cids_eq, missing_recent=False)
# CPI inflation and benchmarks
xcatx = cpi + infes
msm.check_availability(df=dfx, xcats=xcatx, cids=cids_eq, missing_recent=False)
# Labor market
xcatx = labor
msm.check_availability(df=dfx, xcats=xcatx, cids=cids_eq, missing_recent=False)

# Terms of trade and effective exchange rates
xcatx = effx + ctot
msm.check_availability(df=dfx, xcats=xcatx, cids=cids_eq, missing_recent=False)
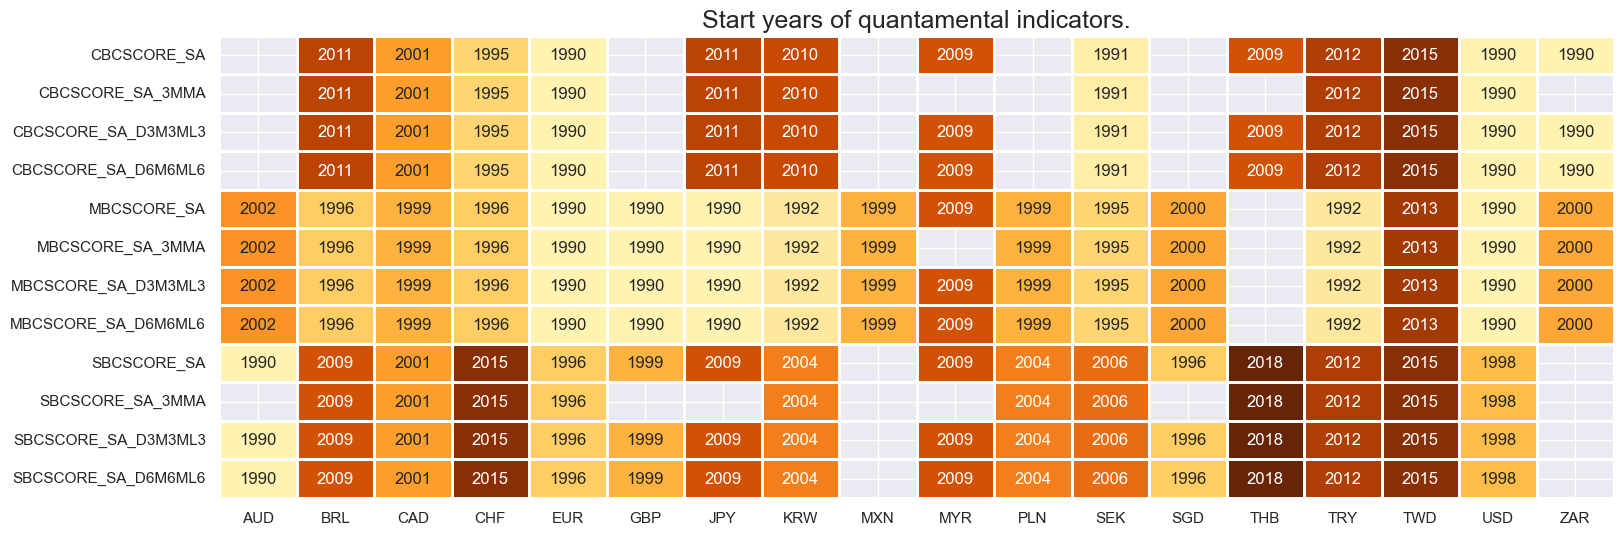
# Business confidence and changes
xcatx = bus_conf + bus_conf_chg
msm.check_availability(df=dfx, xcats=xcatx, cids=cids_eq, missing_recent=False)
# Monetary and financial conditions
xcatx = mon_agg + liq + rir
msm.check_availability(df=dfx, xcats=xcatx, cids=cids_eq, missing_recent=False)

# Equity index futures returns
xcatx = markets
msm.check_availability(df=dfx, xcats=xcatx, cids=cids_eq, missing_recent=False)

Feature engineering #
dict_facts = {}
Domestic spending growth shortfall #
Specs #
# Un-scored indicators and score weights and signs

dict_domspend = {
    "IMPORTS_SA_P6M6ML6AR": (0.5, -1),
    "IMPORTS_SA_P1M1ML12_3MMA": (0.5, -1),
    "NRSALES_SA_P1M1ML12_3MMA": (0.5, -1),
    "RRSALES_SA_P1M1ML12_3MMA": (0.5, -1),
    "RPCONS_SA_P1M1ML12_3MMA": (1, -1),
}
Constituent scores #
# Excess spending growth

xcatx_nominal = [
    "IMPORTS_SA_P6M6ML6AR",
    "IMPORTS_SA_P1M1ML12_3MMA",
    "NRSALES_SA_P1M1ML12_3MMA",
]
xcatx_real = [
    "RRSALES_SA_P1M1ML12_3MMA",
    "RPCONS_SA_P1M1ML12_3MMA",
]

calcs = [f"X{xc} = {xc} - RGDP_SA_P1Q1QL4_20QMM - INFTEFF_NSA" for xc in xcatx_nominal]
calcs += [f"X{xc} = {xc} - RGDP_SA_P1Q1QL4_20QMM" for xc in xcatx_real]

dfa = msp.panel_calculator(
    dfx,
    calcs=calcs,
    cids=cids_eq,
)
dfx = msm.update_df(dfx, dfa)
# Normalization of excess spending growth indicators
cidx = cids_eq
xcatx = ["X" + xc for xc in list(dict_domspend.keys())]
sdate = "1990-01-01"
for xc in xcatx:
dfaa = msp.make_zn_scores(
dfx,
xcat=xc,
cids=cidx,
sequential=True,
min_obs=261 * 5,
neutral="zero",
pan_weight=1,
thresh=3,
postfix="_ZN",
est_freq="m",
)
dfa = msm.update_df(dfa, dfaa)
dfx = msm.update_df(dfx, dfa)
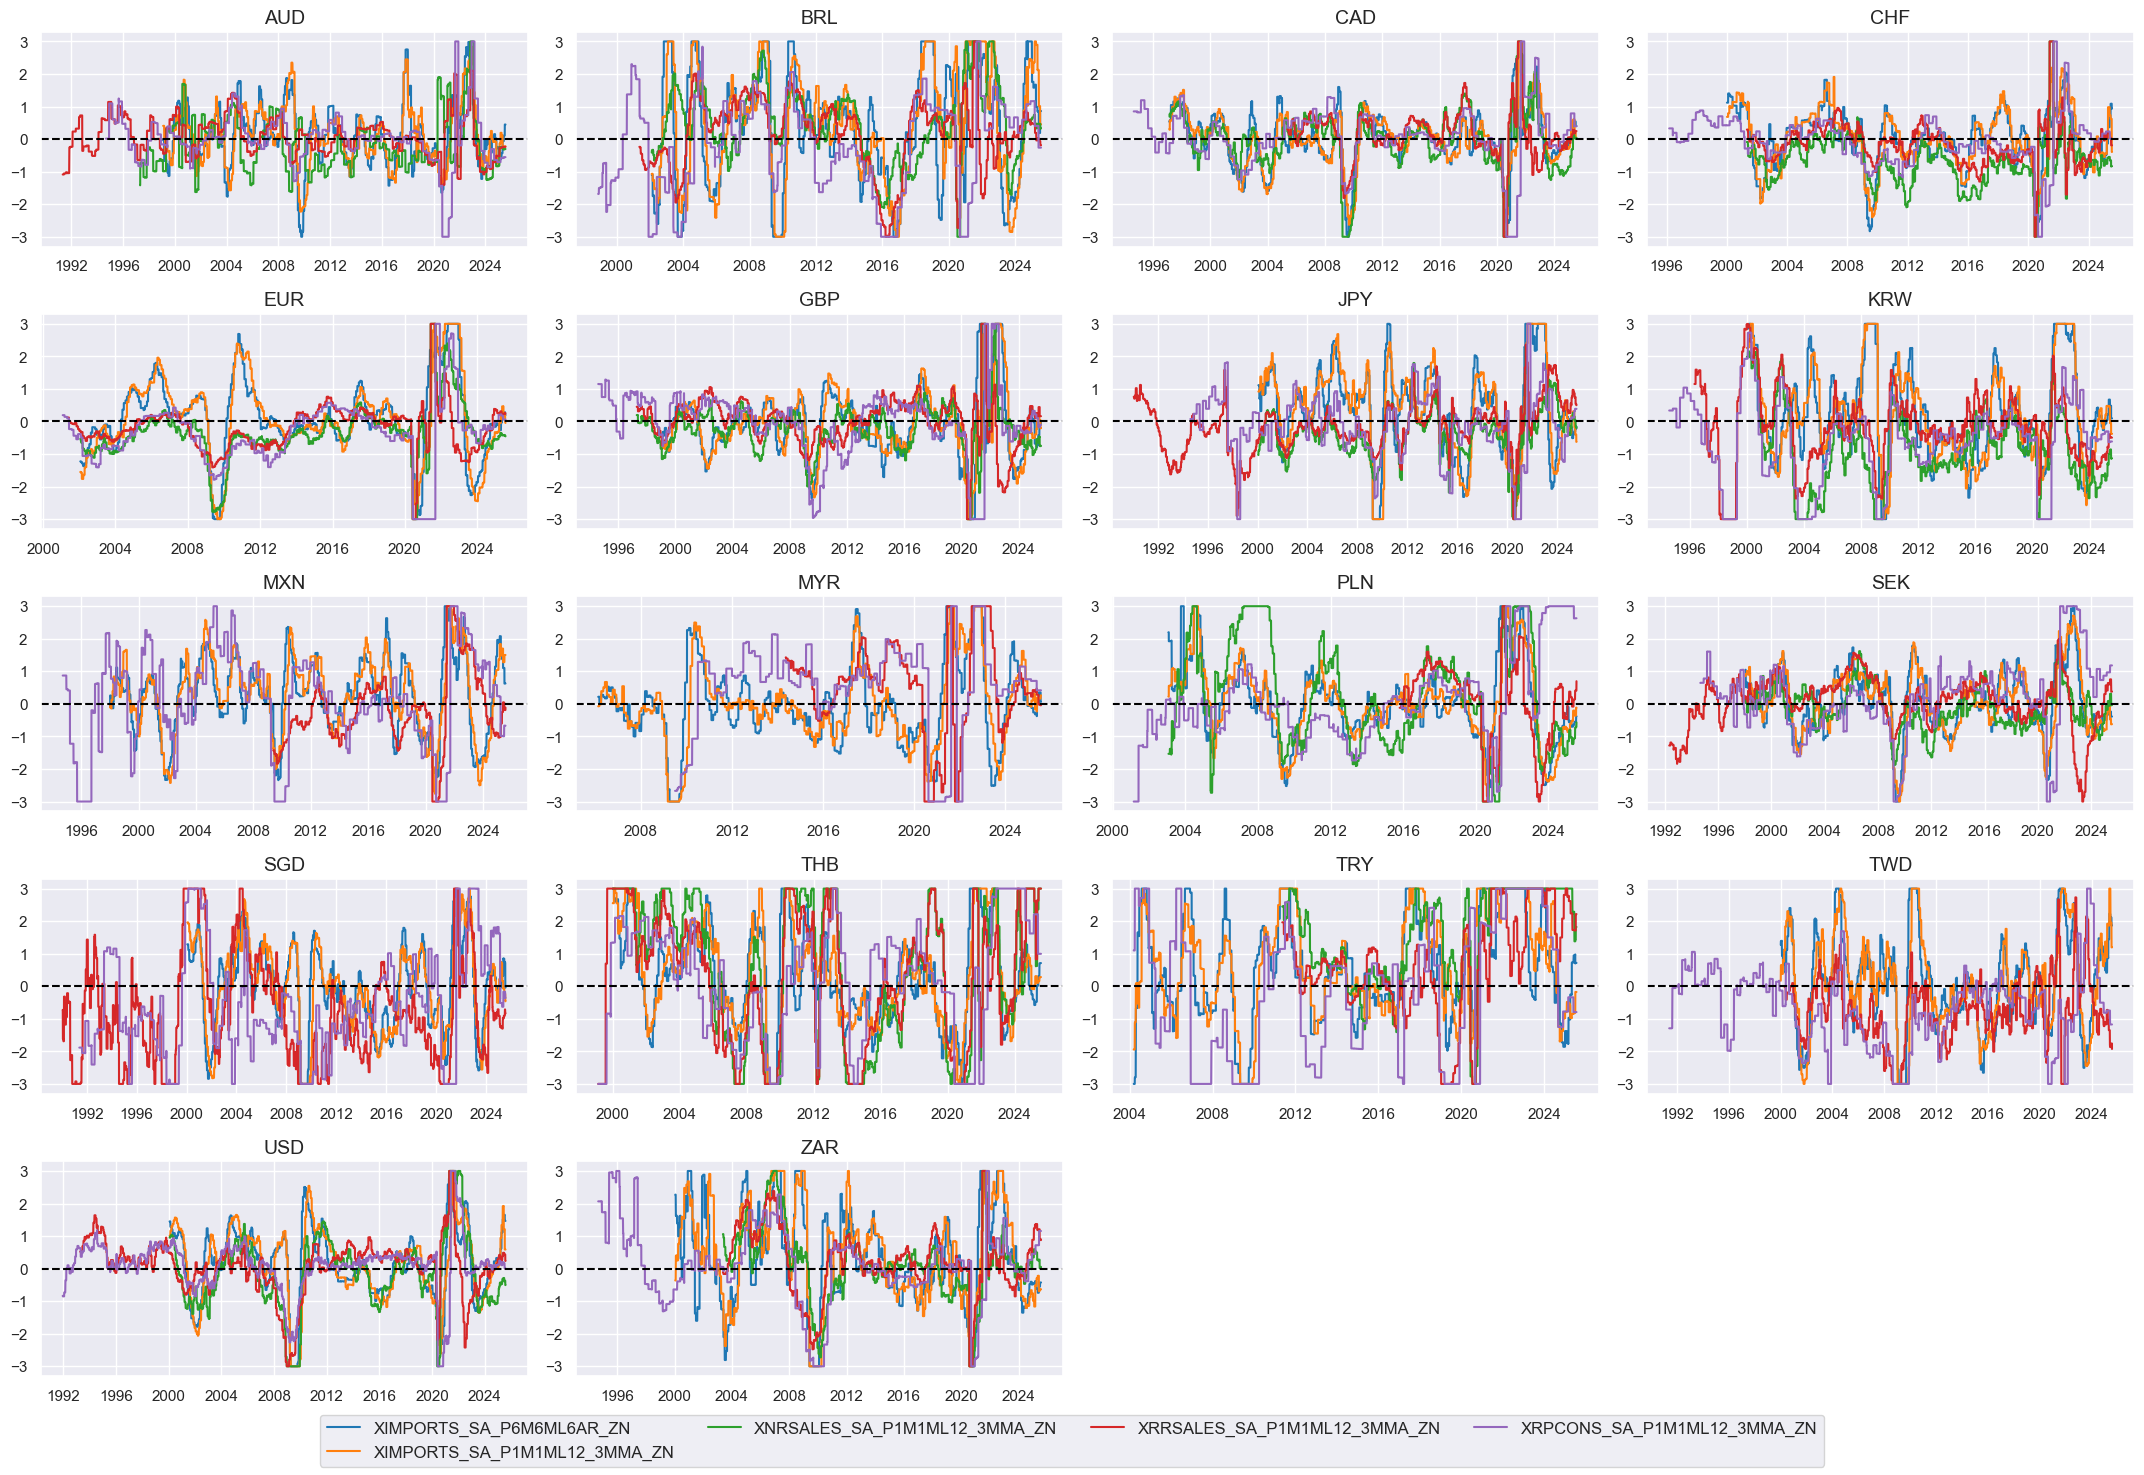
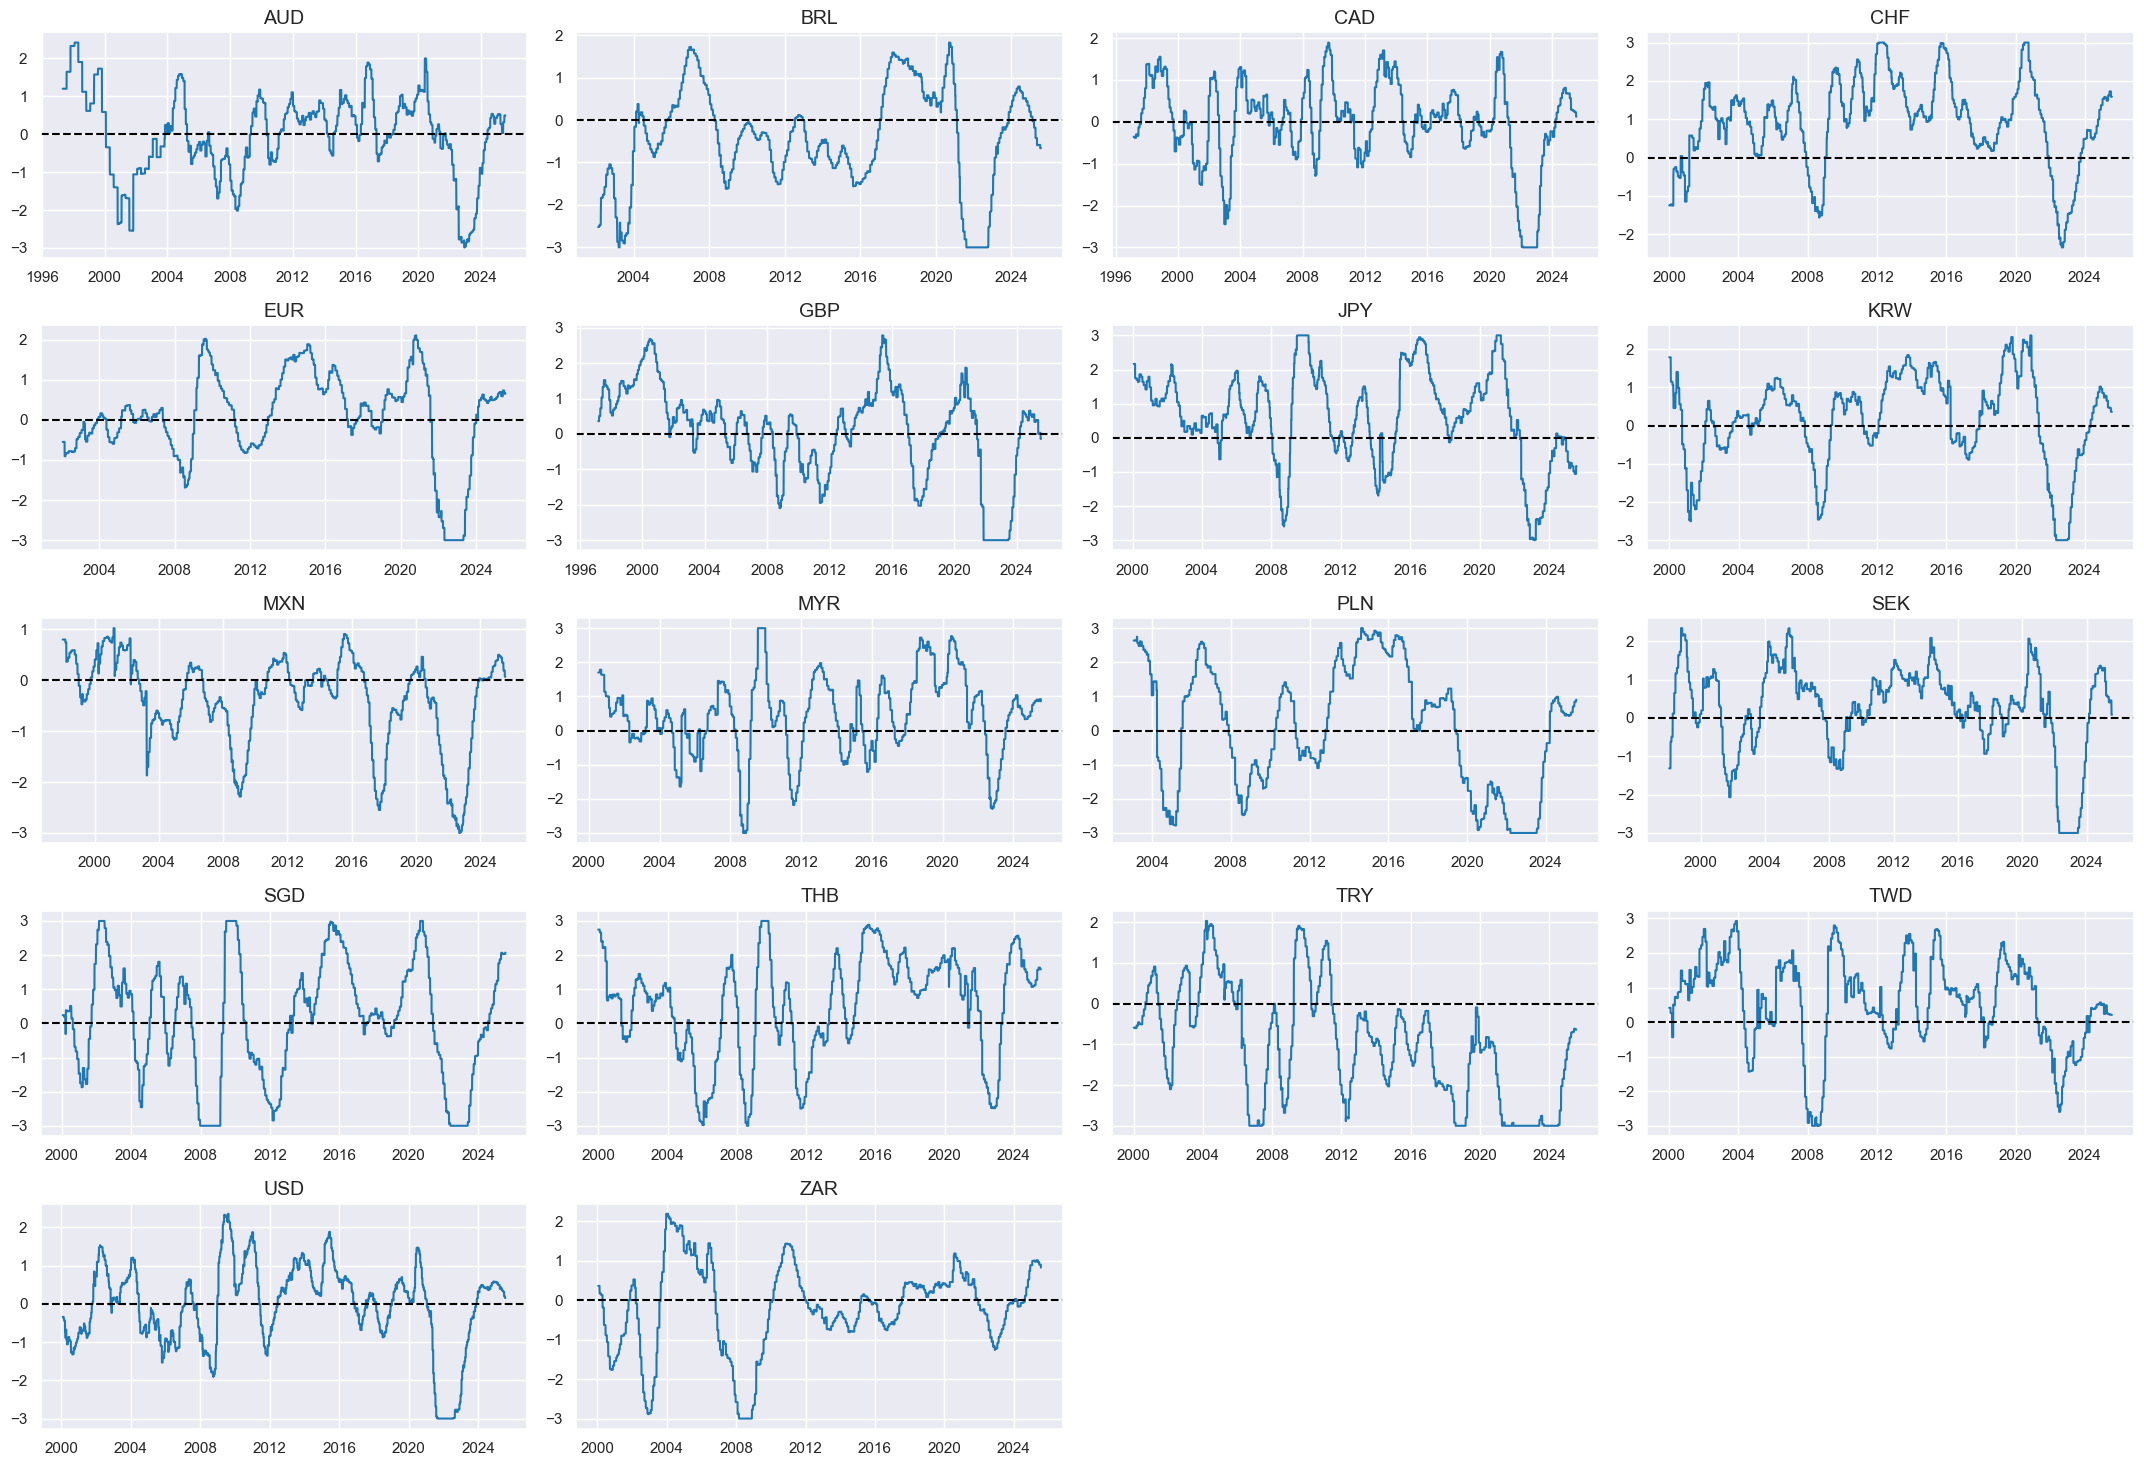
xspendz = [xcat + "_ZN" for xcat in xcatx]
xcatx = xspendz
cidx = cids_eq
sdate = "1990-01-01"

msp.view_timelines(
    dfx,
    xcats=xcatx,
    cids=cidx,
    ncol=4,
    same_y=False,
    all_xticks=True,
    aspect=1.8,
    height=2,
)
Composite scores #
# Weighted linear combination for directional signal
cidx = cids_eq
dix = dict_domspend
xcatx = ["X" + k + "_ZN" for k in list(dix.keys())]
weights = [v[0] for v in list(dix.values())]
signs = [v[1] for v in list(dix.values())]
czs = "XSPEND_NEG"
dfa = msp.linear_composite(
dfx,
xcats=xcatx,
cids=cidx,
weights=weights,
signs=signs,
normalize_weights=True,
complete_xcats=False, # score works with what is available
new_xcat=czs,
)
dfx = msm.update_df(dfx, dfa)
# Re-scoring
dfa = msp.make_zn_scores(
dfx,
xcat=czs,
cids=cidx,
sequential=True,
min_obs=261 * 3,
neutral="zero",
pan_weight=1,
thresh=3,
postfix="_ZN",
est_freq="m",
)
dfx = msm.update_df(dfx, dfa)
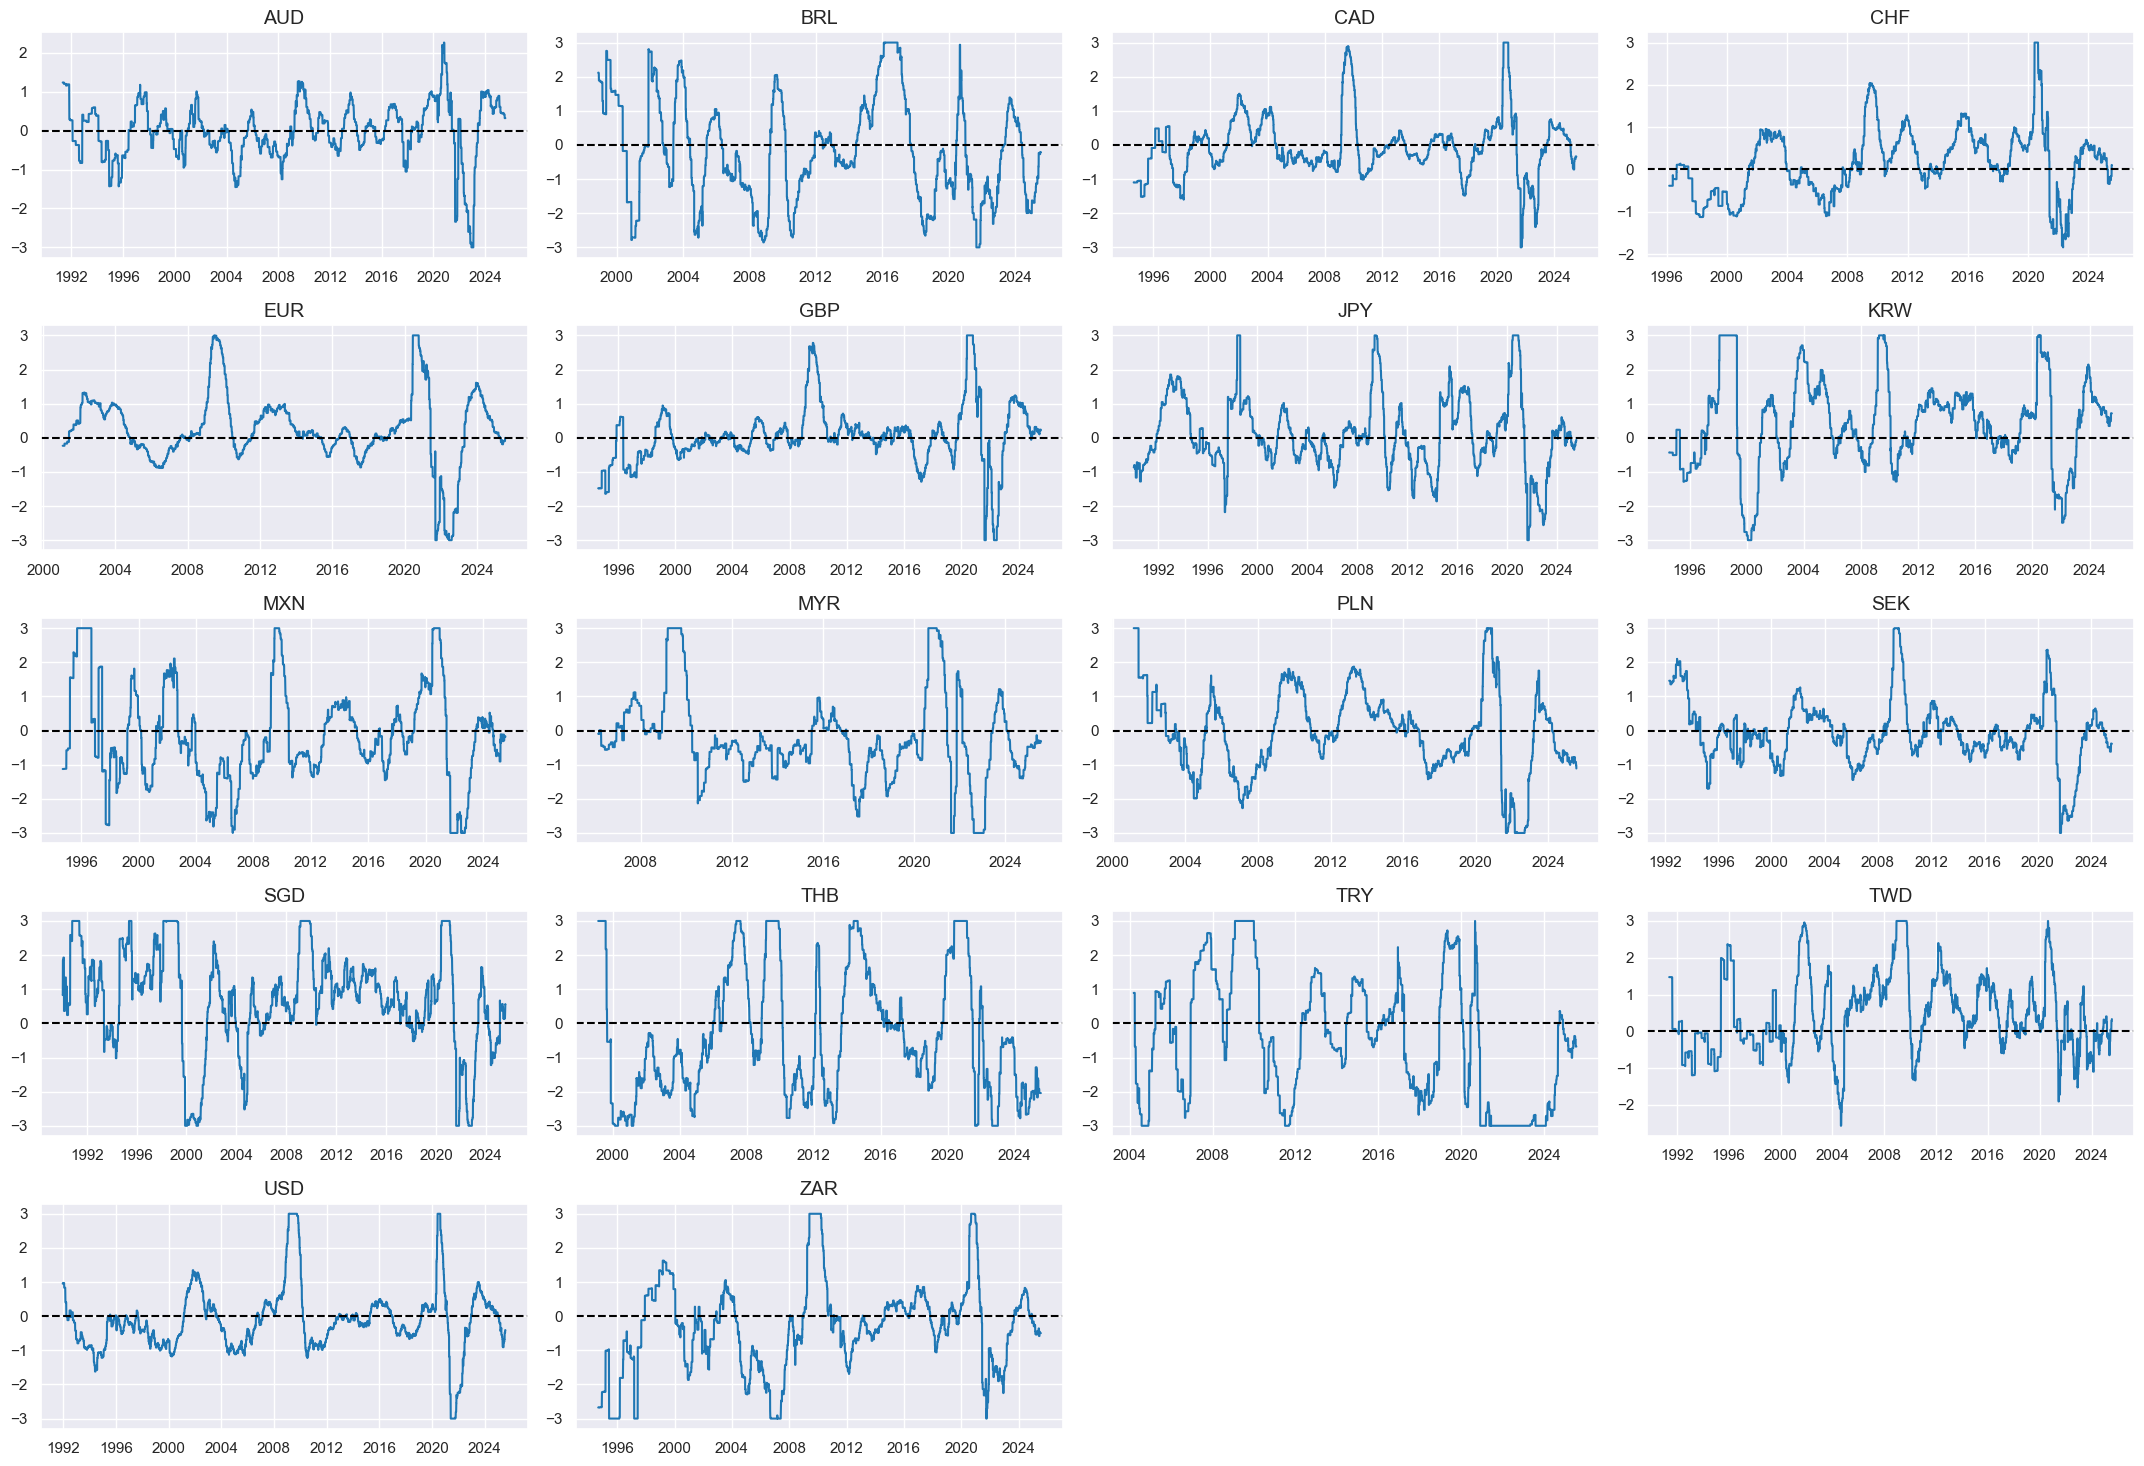
dict_facts[czs + "_ZN"] = "Domestic spending shortfall"
xcatx = ["XSPEND_NEG_ZN"]
cidx = cids_eq
sdate = "1990-01-01"

msp.view_timelines(
    dfx,
    xcats=xcatx,
    cids=cidx,
    ncol=4,
    same_y=False,
    all_xticks=True,
    aspect=1.8,
    height=2,
)
Inflation shortfall ratios #
Specs #
# Un-scored indicators and score weights and signs

dict_infl = {
    "CPIH_SA_P1M1ML12": (0.5, -1),
    "CPIH_SJA_P6M6ML6AR": (0.5, -1),
    "CPIC_SA_P1M1ML12": (0.5, -1),
    "CPIC_SJA_P6M6ML6AR": (0.5, -1),
}
Constituent scores #
# Excess inflation ratios

xcatx = list(dict_infl.keys())

calcs = [f"X{xc}vIETR = ( {xc} - INFTEFF_NSA ) / INFTEFF_NSA .clip(lower=2) " for xc in xcatx]

dfa = msp.panel_calculator(
    dfx,
    calcs=calcs,
    cids=cids_eq,
)
dfx = msm.update_df(dfx, dfa)
# Relative value of constituents

cidx = cids_eq
xcatx = ["X" + xc + "vIETR" for xc in list(dict_infl.keys())]

dfa = msp.make_relative_value(
    df=dfx,
    xcats=xcatx,
    cids=cidx,
    postfix="vGLB",
)
dfx = msm.update_df(dfx, dfa)
# Panel-based normalization
cidx = cids_eq
xcatx = ["X" + xc + "vIETR" for xc in list(dict_infl.keys())]
sdate = "1990-01-01"
for xc in xcatx:
dfaa = msp.make_zn_scores(
dfx,
xcat=xc,
cids=cidx,
sequential=True,
min_obs=261 * 5,
neutral="zero",
pan_weight=1,
thresh=3,
postfix="_ZN",
est_freq="m",
)
dfa = msm.update_df(dfa, dfaa)
dfx = msm.update_df(dfx, dfa)
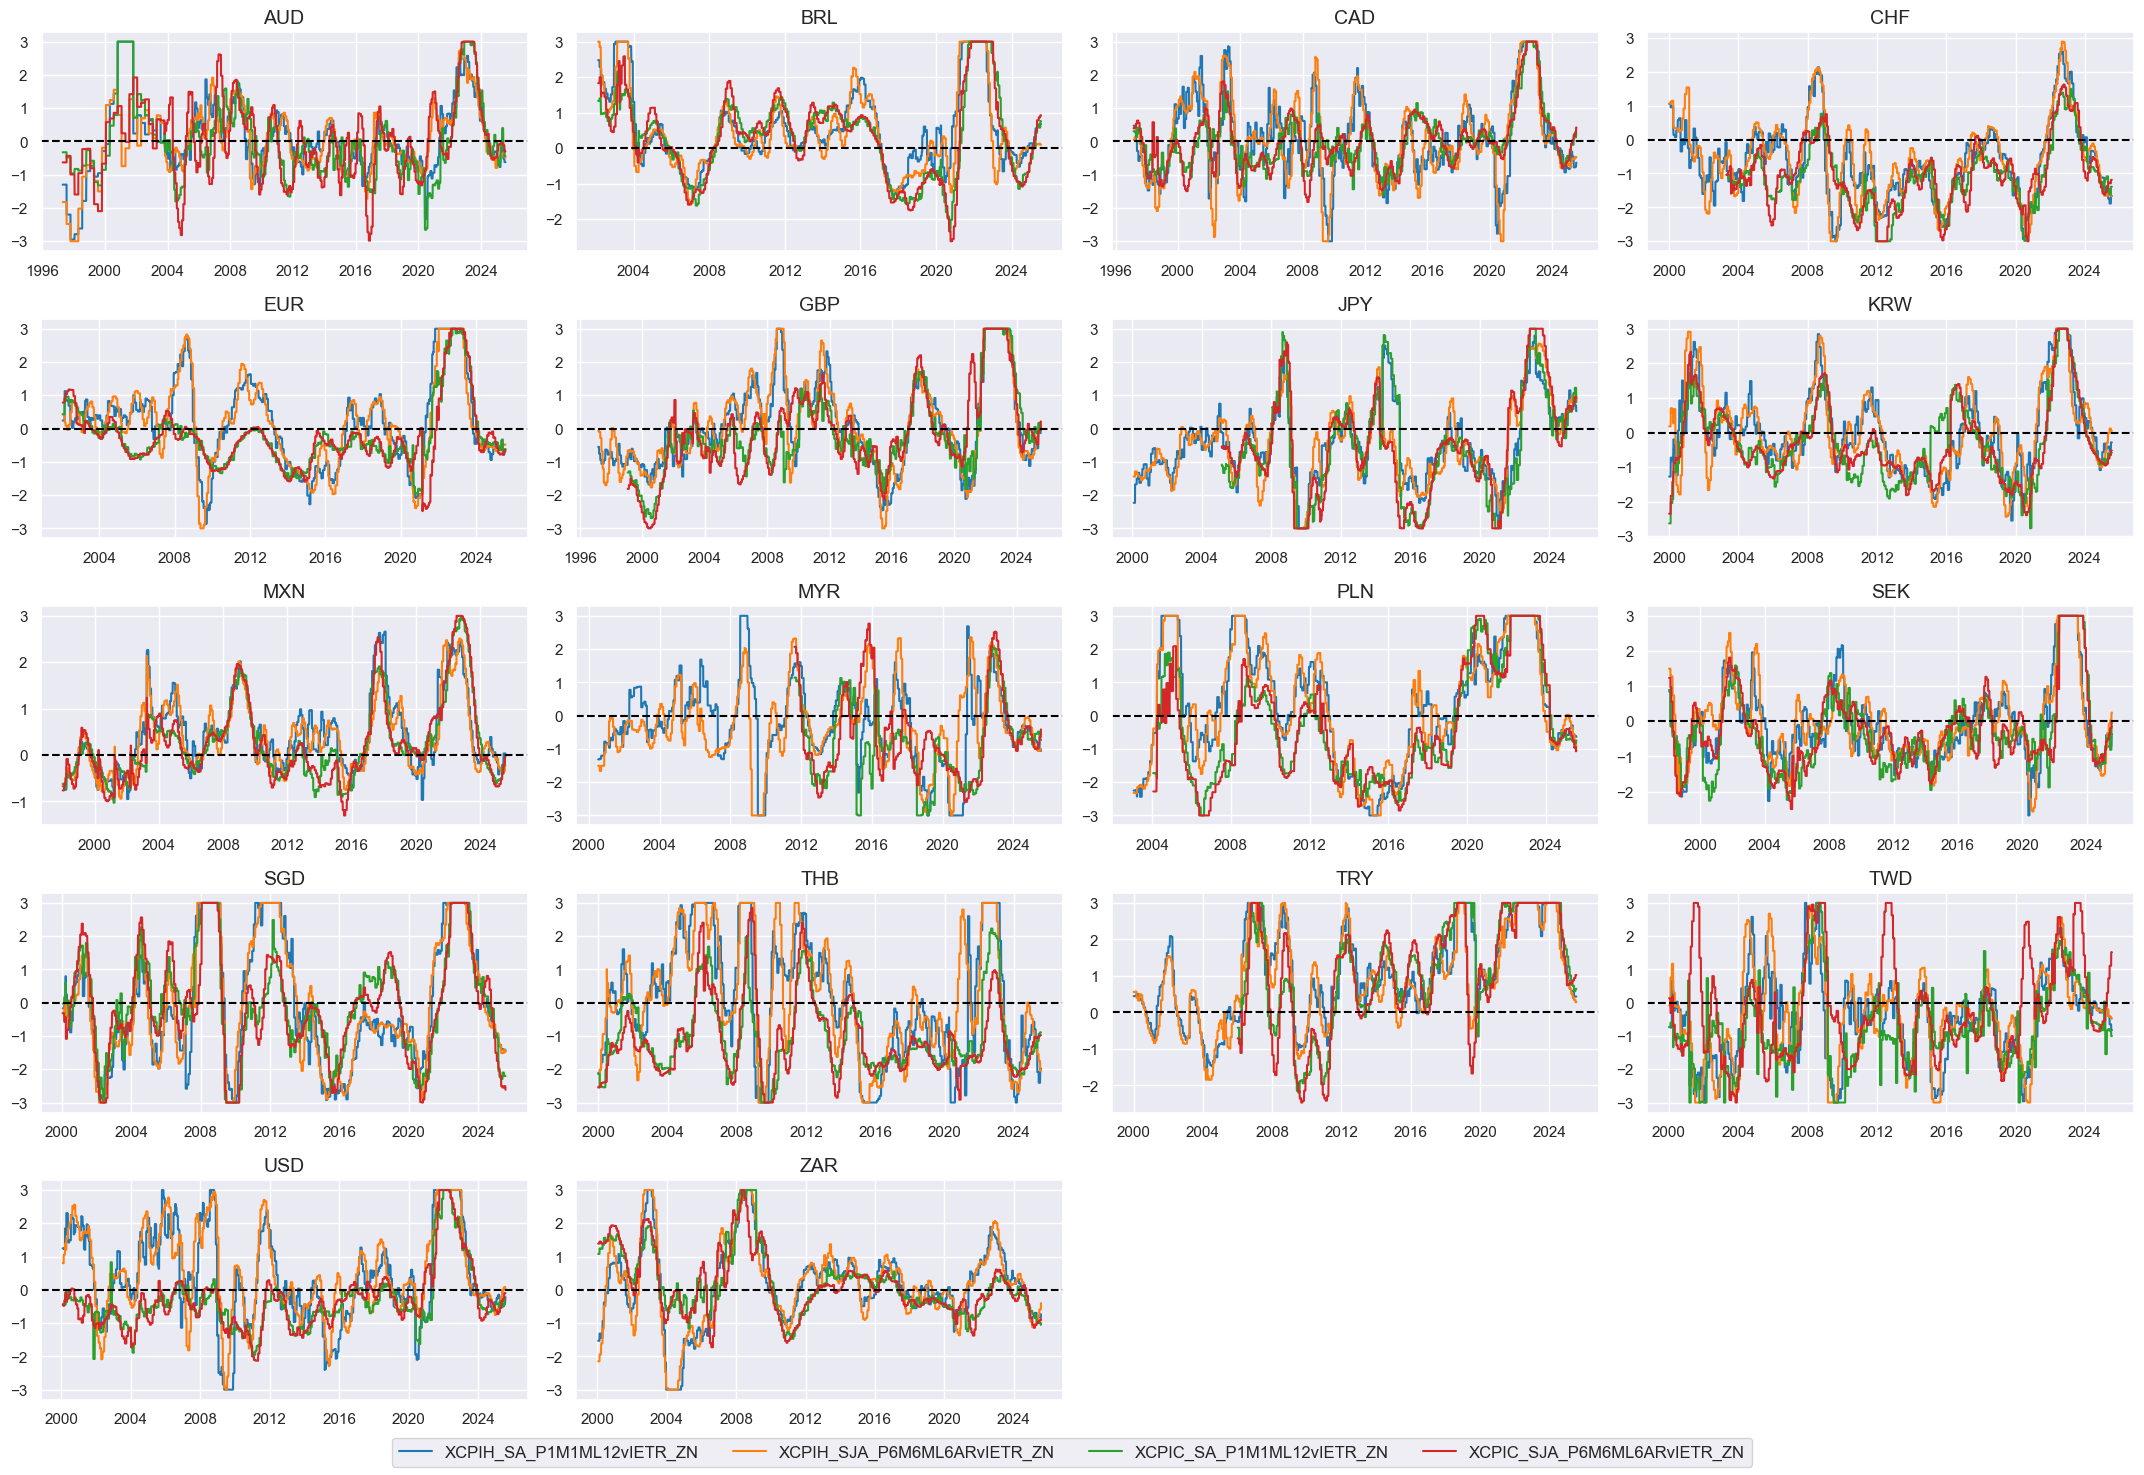
xinflz = [xcat + "_ZN" for xcat in xcatx]
cidx = cids_eq
xcatx = xinflz

msp.view_timelines(
    dfx,
    xcats=xcatx,
    cids=cidx,
    ncol=4,
    same_y=False,
    all_xticks=True,
    aspect=1.8,
    height=2,
)
Composite scores #
# Weighted linear combination

cidx = cids_eq
dix = dict_infl

xcatx = ["X" + k + "vIETR_ZN" for k in list(dix.keys())]
weights = [v[0] for v in list(dix.values())]
signs = [v[1] for v in list(dix.values())]
czs = "XINFL_NEG"

dfa = msp.linear_composite(
    dfx,
    xcats=xcatx,
    cids=cidx,
    weights=weights,
    signs=signs,
    normalize_weights=True,
    complete_xcats=False,  # score works with what is available
    new_xcat=czs,
)
dfx = msm.update_df(dfx, dfa)

# Re-scoring

dfa = msp.make_zn_scores(
    dfx,
    xcat=czs,
    cids=cidx,
    sequential=True,
    min_obs=261 * 3,
    neutral="zero",
    pan_weight=1,
    thresh=3,
    postfix="_ZN",
    est_freq="m",
)
dfx = msm.update_df(dfx, dfa)

dict_facts[czs + "_ZN"] = "Inflation shortfall ratio"
xcatx = ["XINFL_NEG_ZN"]
cidx = cids_eq
sdate = "1990-01-01"

msp.view_timelines(
    dfx,
    xcats=xcatx,
    cids=cidx,
    ncol=4,
    same_y=False,
    all_xticks=True,
    aspect=1.8,
    height=2,
)
Intervention liquidity growth #
Specs #
# Un-scored indicators and score weights and signs

dict_liq = {
    "INTLIQGDP_NSA_D1M1ML3": (1/2, 1),
    "INTLIQGDP_NSA_D1M1ML6": (1/2, 1),
}
Constituent scores #
# Panel-based normalization
cidx = cids_eq
xcatx = [xc for xc in list(dict_liq.keys())]
sdate = "1990-01-01"
for xc in xcatx:
dfaa = msp.make_zn_scores(
dfx,
xcat=xc,
cids=cidx,
sequential=True,
min_obs=261 * 5,
neutral="zero",
pan_weight=1,
thresh=3,
postfix="_ZN",
est_freq="m",
)
dfa = msm.update_df(dfa, dfaa)
dfx = msm.update_df(dfx, dfa)
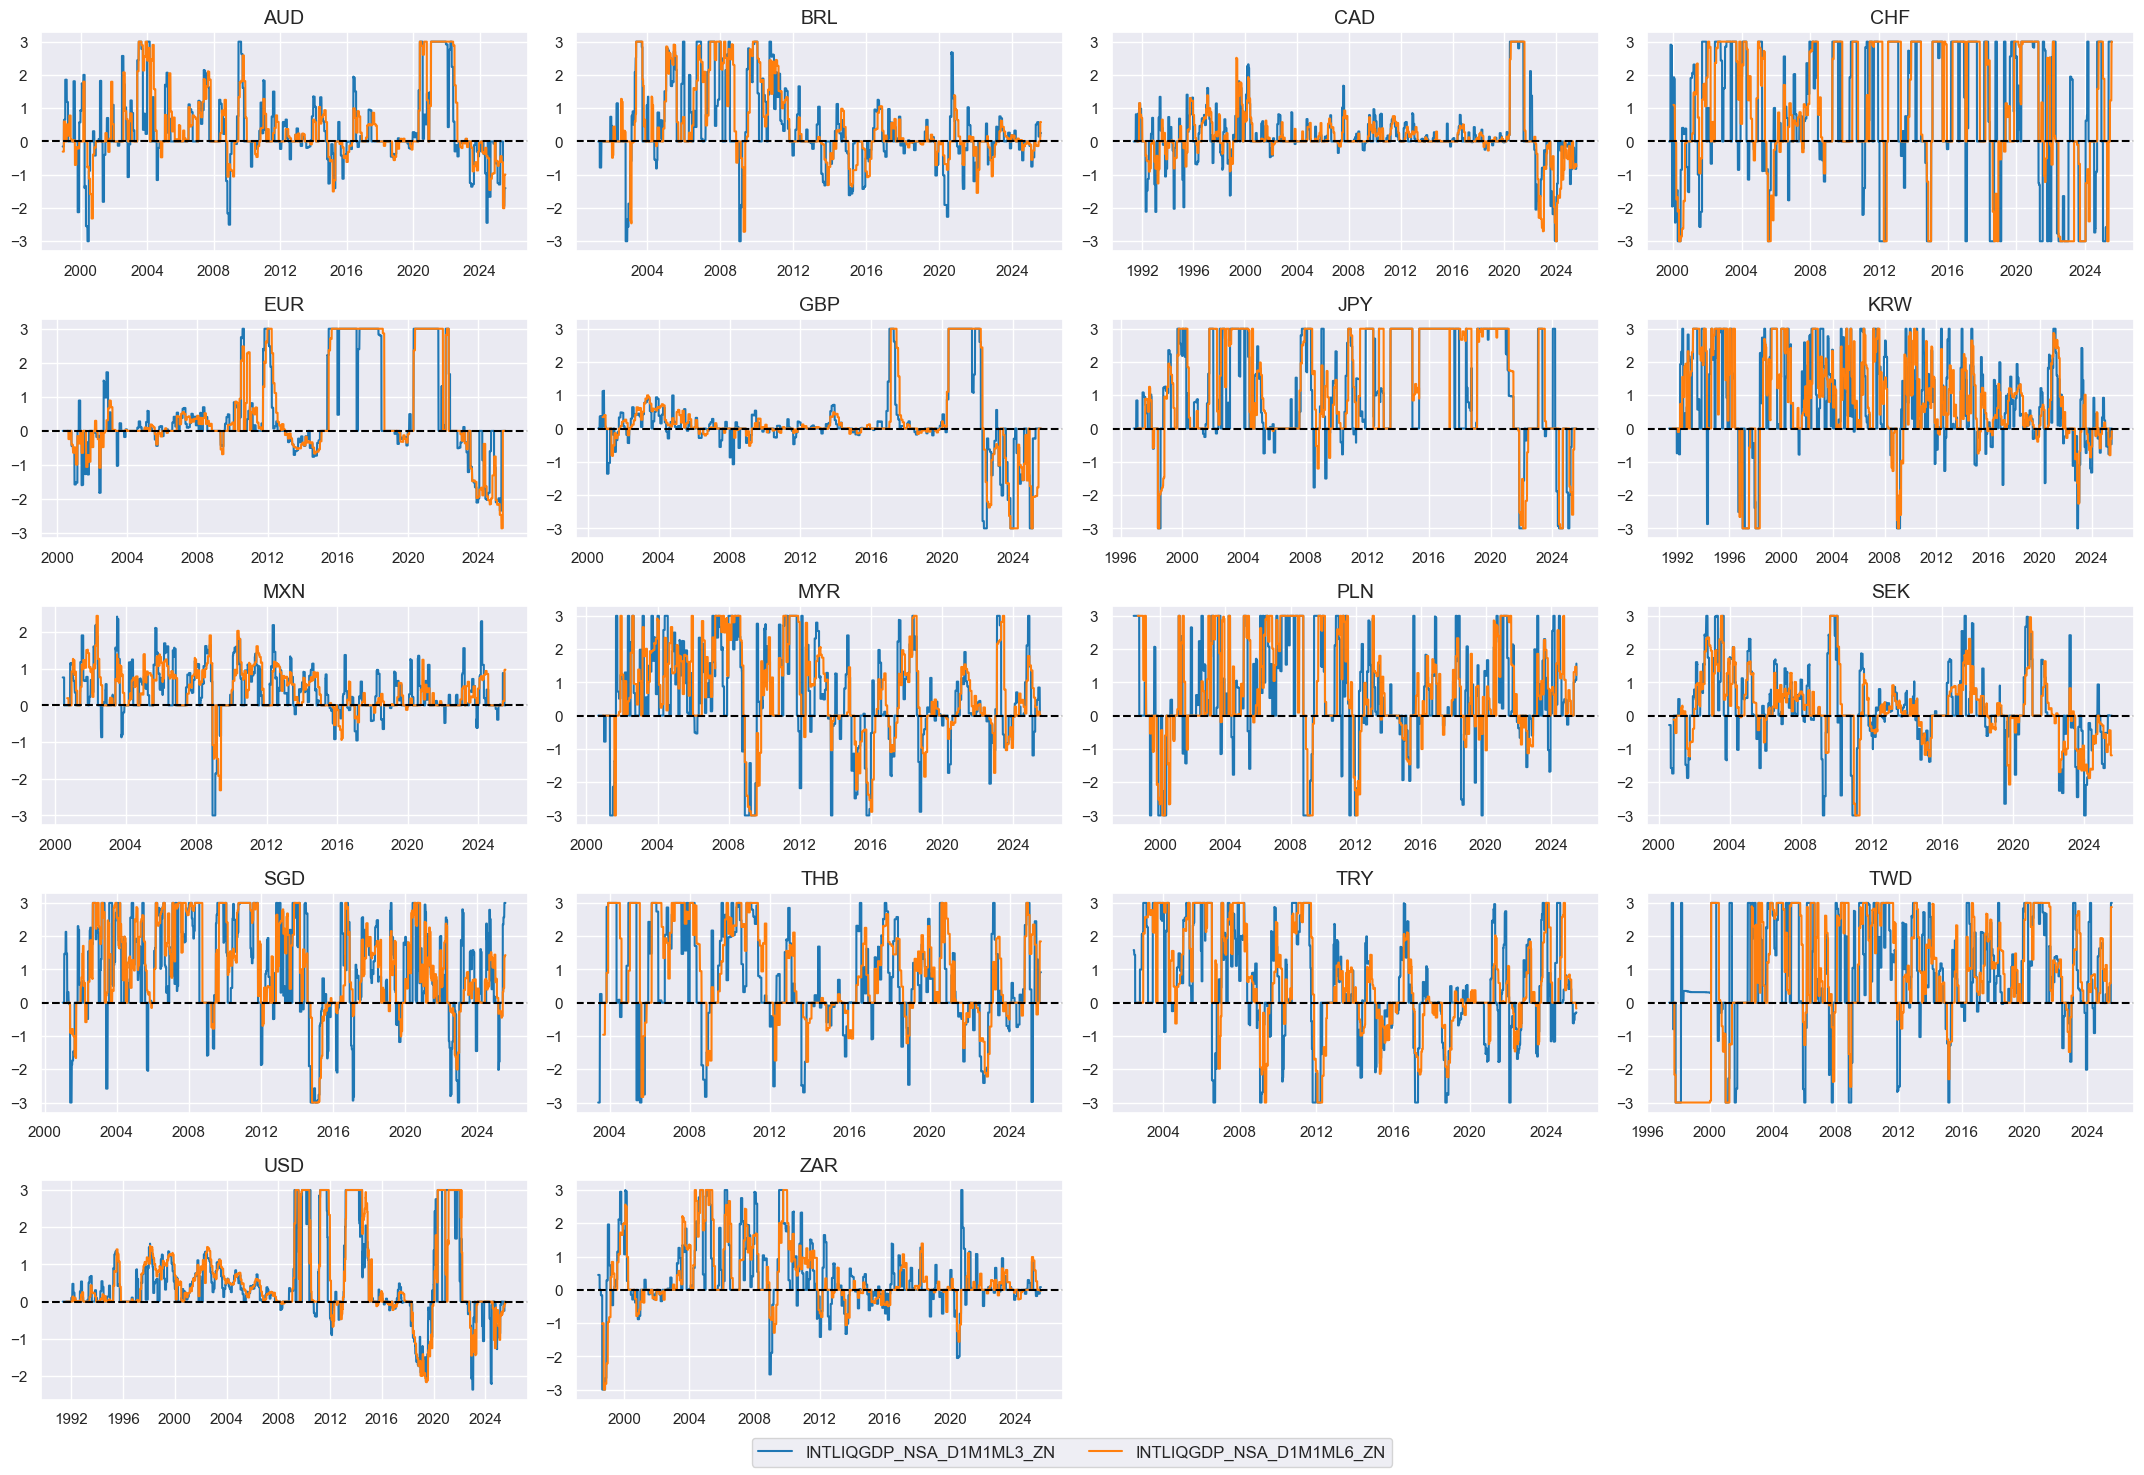
liqz = [xcat + "_ZN" for xcat in xcatx]
cidx = cids_eq
xcatx = liqz

msp.view_timelines(
    dfx,
    xcats=xcatx,
    cids=cidx,
    ncol=4,
    same_y=False,
    all_xticks=True,
    aspect=1.8,
    height=2,
)
Composite scores #
# Weighted linear combination
cidx = cids_eq
dix = dict_liq
xcatx = [k + "_ZN" for k in list(dix.keys())]
weights = [v[0] for v in list(dix.values())]
signs = [v[1] for v in list(dix.values())]
czs = "LIQ"
dfa = msp.linear_composite(
dfx,
xcats=xcatx,
cids=cidx,
weights=weights,
signs=signs,
normalize_weights=True,
complete_xcats=False, # score works with what is available
new_xcat=czs,
)
dfx = msm.update_df(dfx, dfa)
# Re-scoring
dfa = msp.make_zn_scores(
dfx,
xcat=czs,
cids=cidx,
sequential=True,
min_obs=261 * 3,
neutral="zero",
pan_weight=1,
thresh=3,
postfix="_ZN",
est_freq="m",
)
dfx = msm.update_df(dfx, dfa)
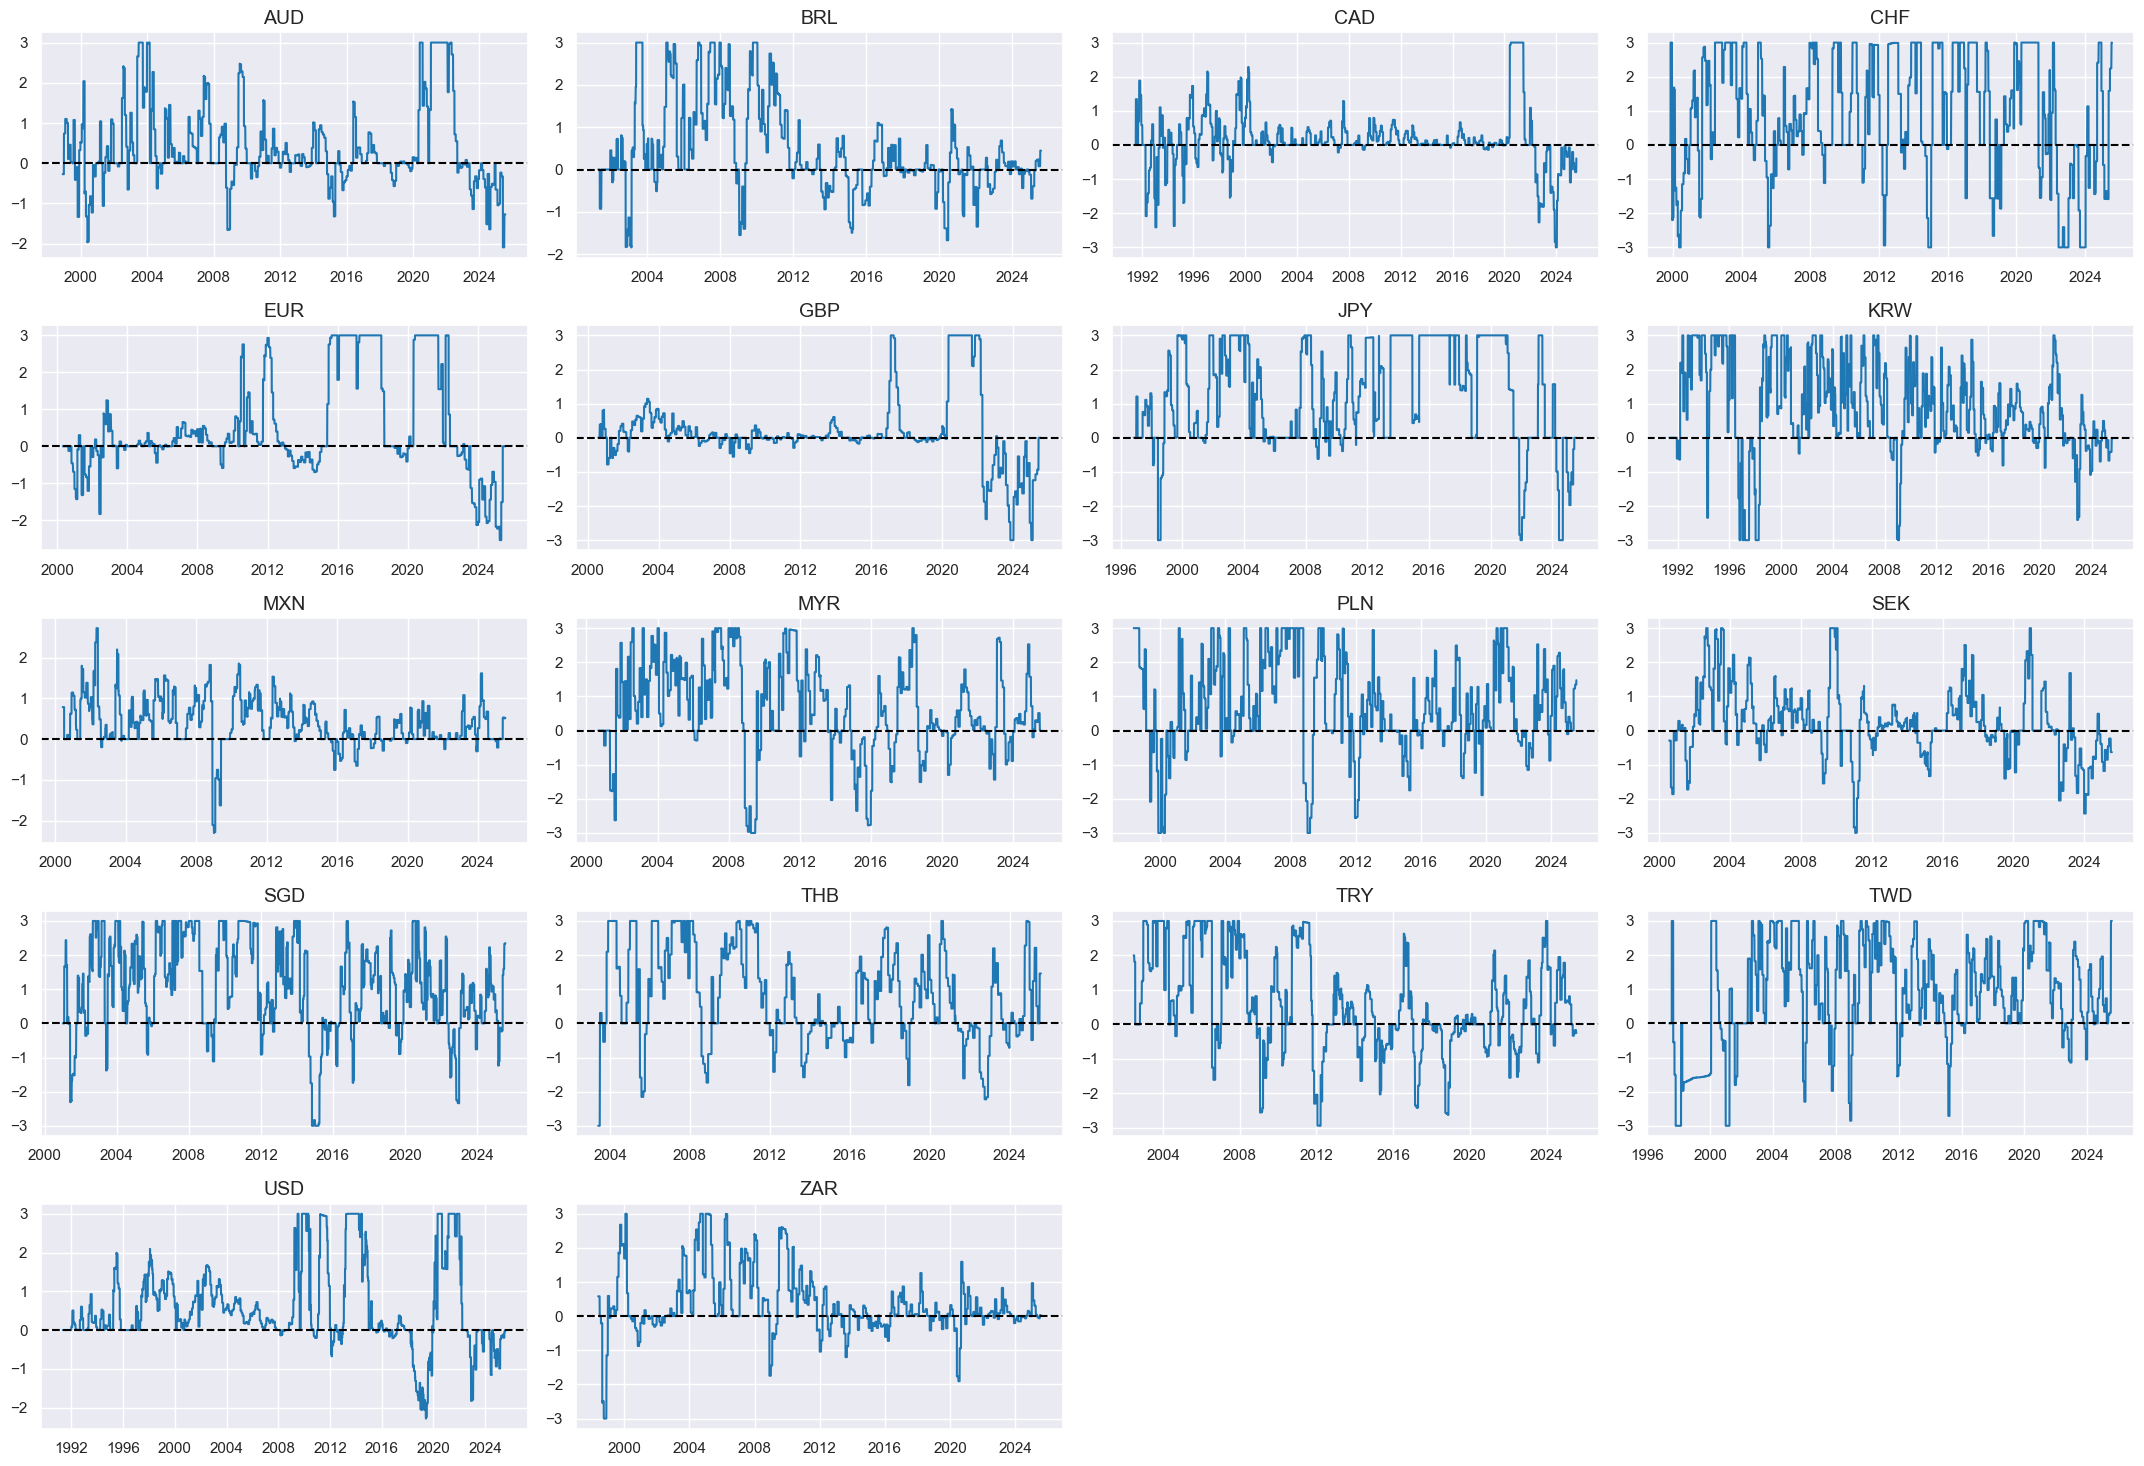
dict_facts[czs + "_ZN"] = "Liquidity growth"
xcatx = ["LIQ_ZN"]
cidx = cids_eq
sdate = "1990-01-01"

msp.view_timelines(
    dfx,
    xcats=xcatx,
    cids=cidx,
    ncol=4,
    same_y=False,
    all_xticks=True,
    aspect=1.8,
    height=2,
)
Real interest rates (negative) #
Specs #
# Un-scored indicators and score weights and signs

dict_rir = {
    "RIR_NSA": (1/3, -1),
    "RYLDIRS02Y_NSA": (1/3, -1),
    "RYLDIRS05Y_NSA": (1/3, -1),
}
Constituent scores #
# Excess real rates

xcatx = list(dict_rir.keys())

calcs = [
    f"X{xcat} = {xcat} - ( RGDP_SA_P1Q1QL4_20QMM - WFORCE_NSA_P1Y1YL1_5YMM )"
    for xcat in xcatx
]

dfa = msp.panel_calculator(
    dfx,
    calcs=calcs,
    cids=cids_eq,
)
dfx = msm.update_df(dfx, dfa)
# Panel-based normalization
cidx = cids_eq
xcatx = [f"X{xcat}" for xcat in list(dict_rir.keys())]
sdate = "1990-01-01"
for xc in xcatx:
dfaa = msp.make_zn_scores(
dfx,
xcat=xc,
cids=cidx,
sequential=True,
min_obs=261 * 5,
neutral="zero",
pan_weight=1,
thresh=3,
postfix="_ZN",
est_freq="m",
)
dfa = msm.update_df(dfa, dfaa)
dfx = msm.update_df(dfx, dfa)
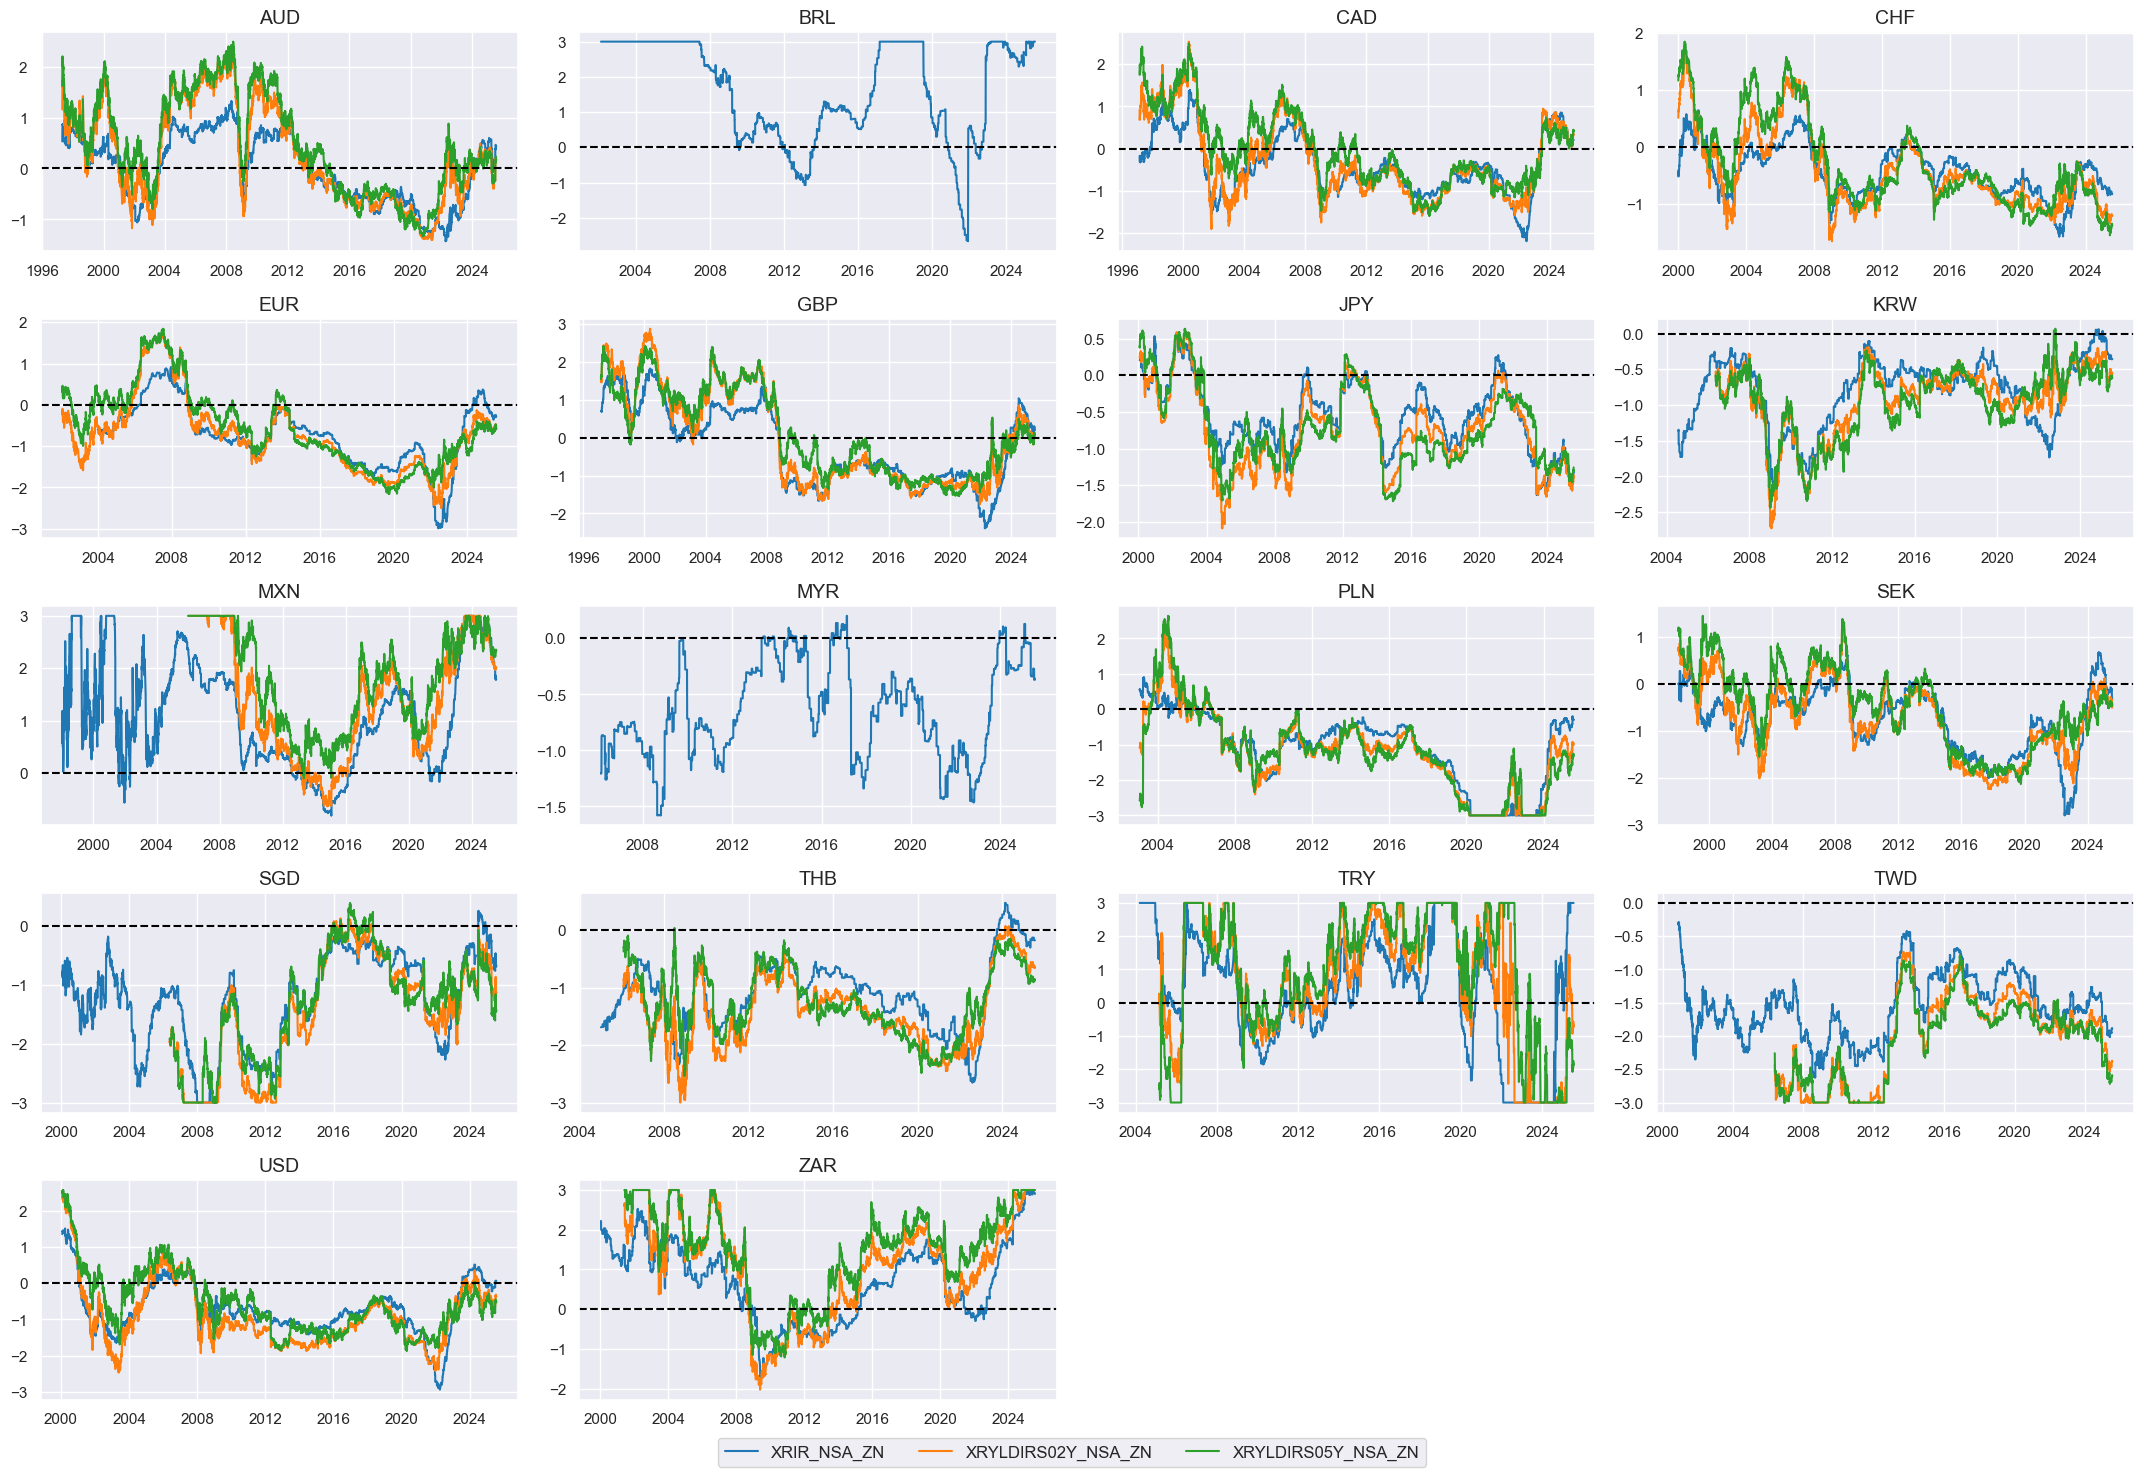
rirz = [xc + "_ZN" for xc in xcatx]
cidx = cids_eq
xcatx = rirz

msp.view_timelines(
    dfx,
    xcats=xcatx,
    cids=cidx,
    ncol=4,
    same_y=False,
    all_xticks=True,
    aspect=1.8,
    height=2,
)
Composite scores #
# Weighted linear combination

cidx = cids_eq
dix = dict_rir

xcatx = ["X" + k + "_ZN" for k in list(dix.keys())]
weights = [v[0] for v in list(dix.values())]
signs = [v[1] for v in list(dix.values())]
czs = "RIR_NEG"

dfa = msp.linear_composite(
    dfx,
    xcats=xcatx,
    cids=cidx,
    weights=weights,
    signs=signs,
    normalize_weights=True,
    complete_xcats=False,  # score works with what is available
    new_xcat=czs,
)
dfx = msm.update_df(dfx, dfa)

# Re-scoring

dfa = msp.make_zn_scores(
    dfx,
    xcat=czs,
    cids=cidx,
    sequential=True,
    min_obs=261 * 3,
    neutral="zero",
    pan_weight=1,
    thresh=3,
    postfix="_ZN",
    est_freq="m",
)
dfx = msm.update_df(dfx, dfa)

dict_facts[czs + "_ZN"] = "Real yield shortfall"
xcatx = ["RIR_NEG_ZN"]
cidx = cids_eq
sdate = "1990-01-01"

msp.view_timelines(
    dfx,
    xcats=xcatx,
    cids=cidx,
    ncol=4,
    same_y=False,
    all_xticks=True,
    aspect=1.8,
    height=2,
)
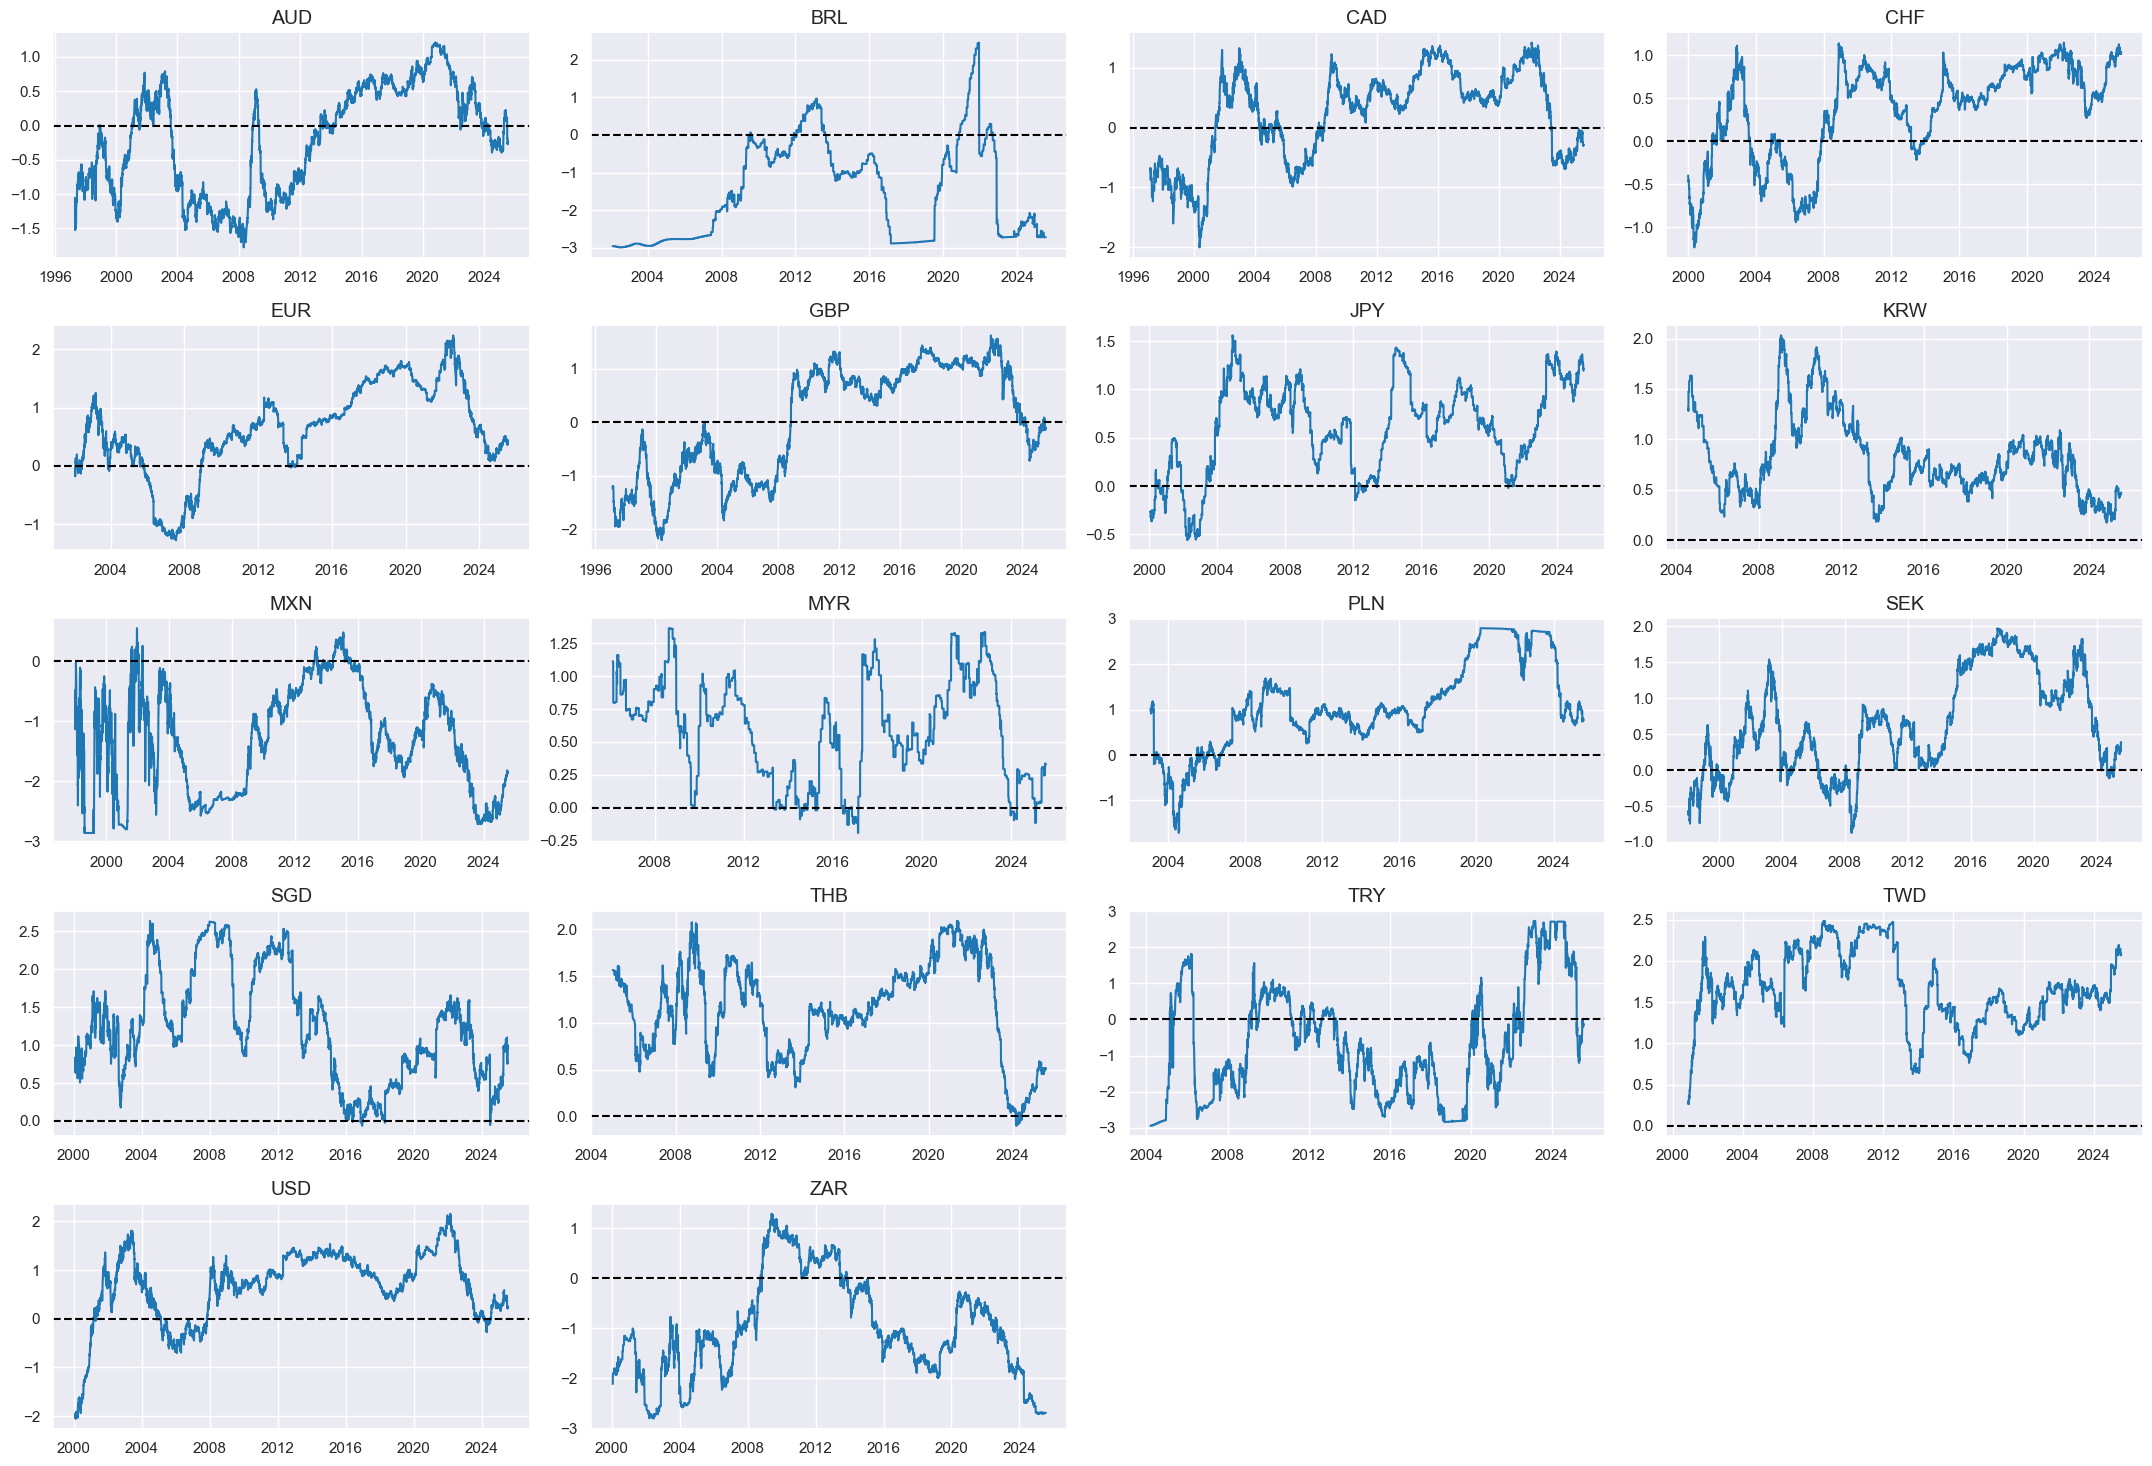
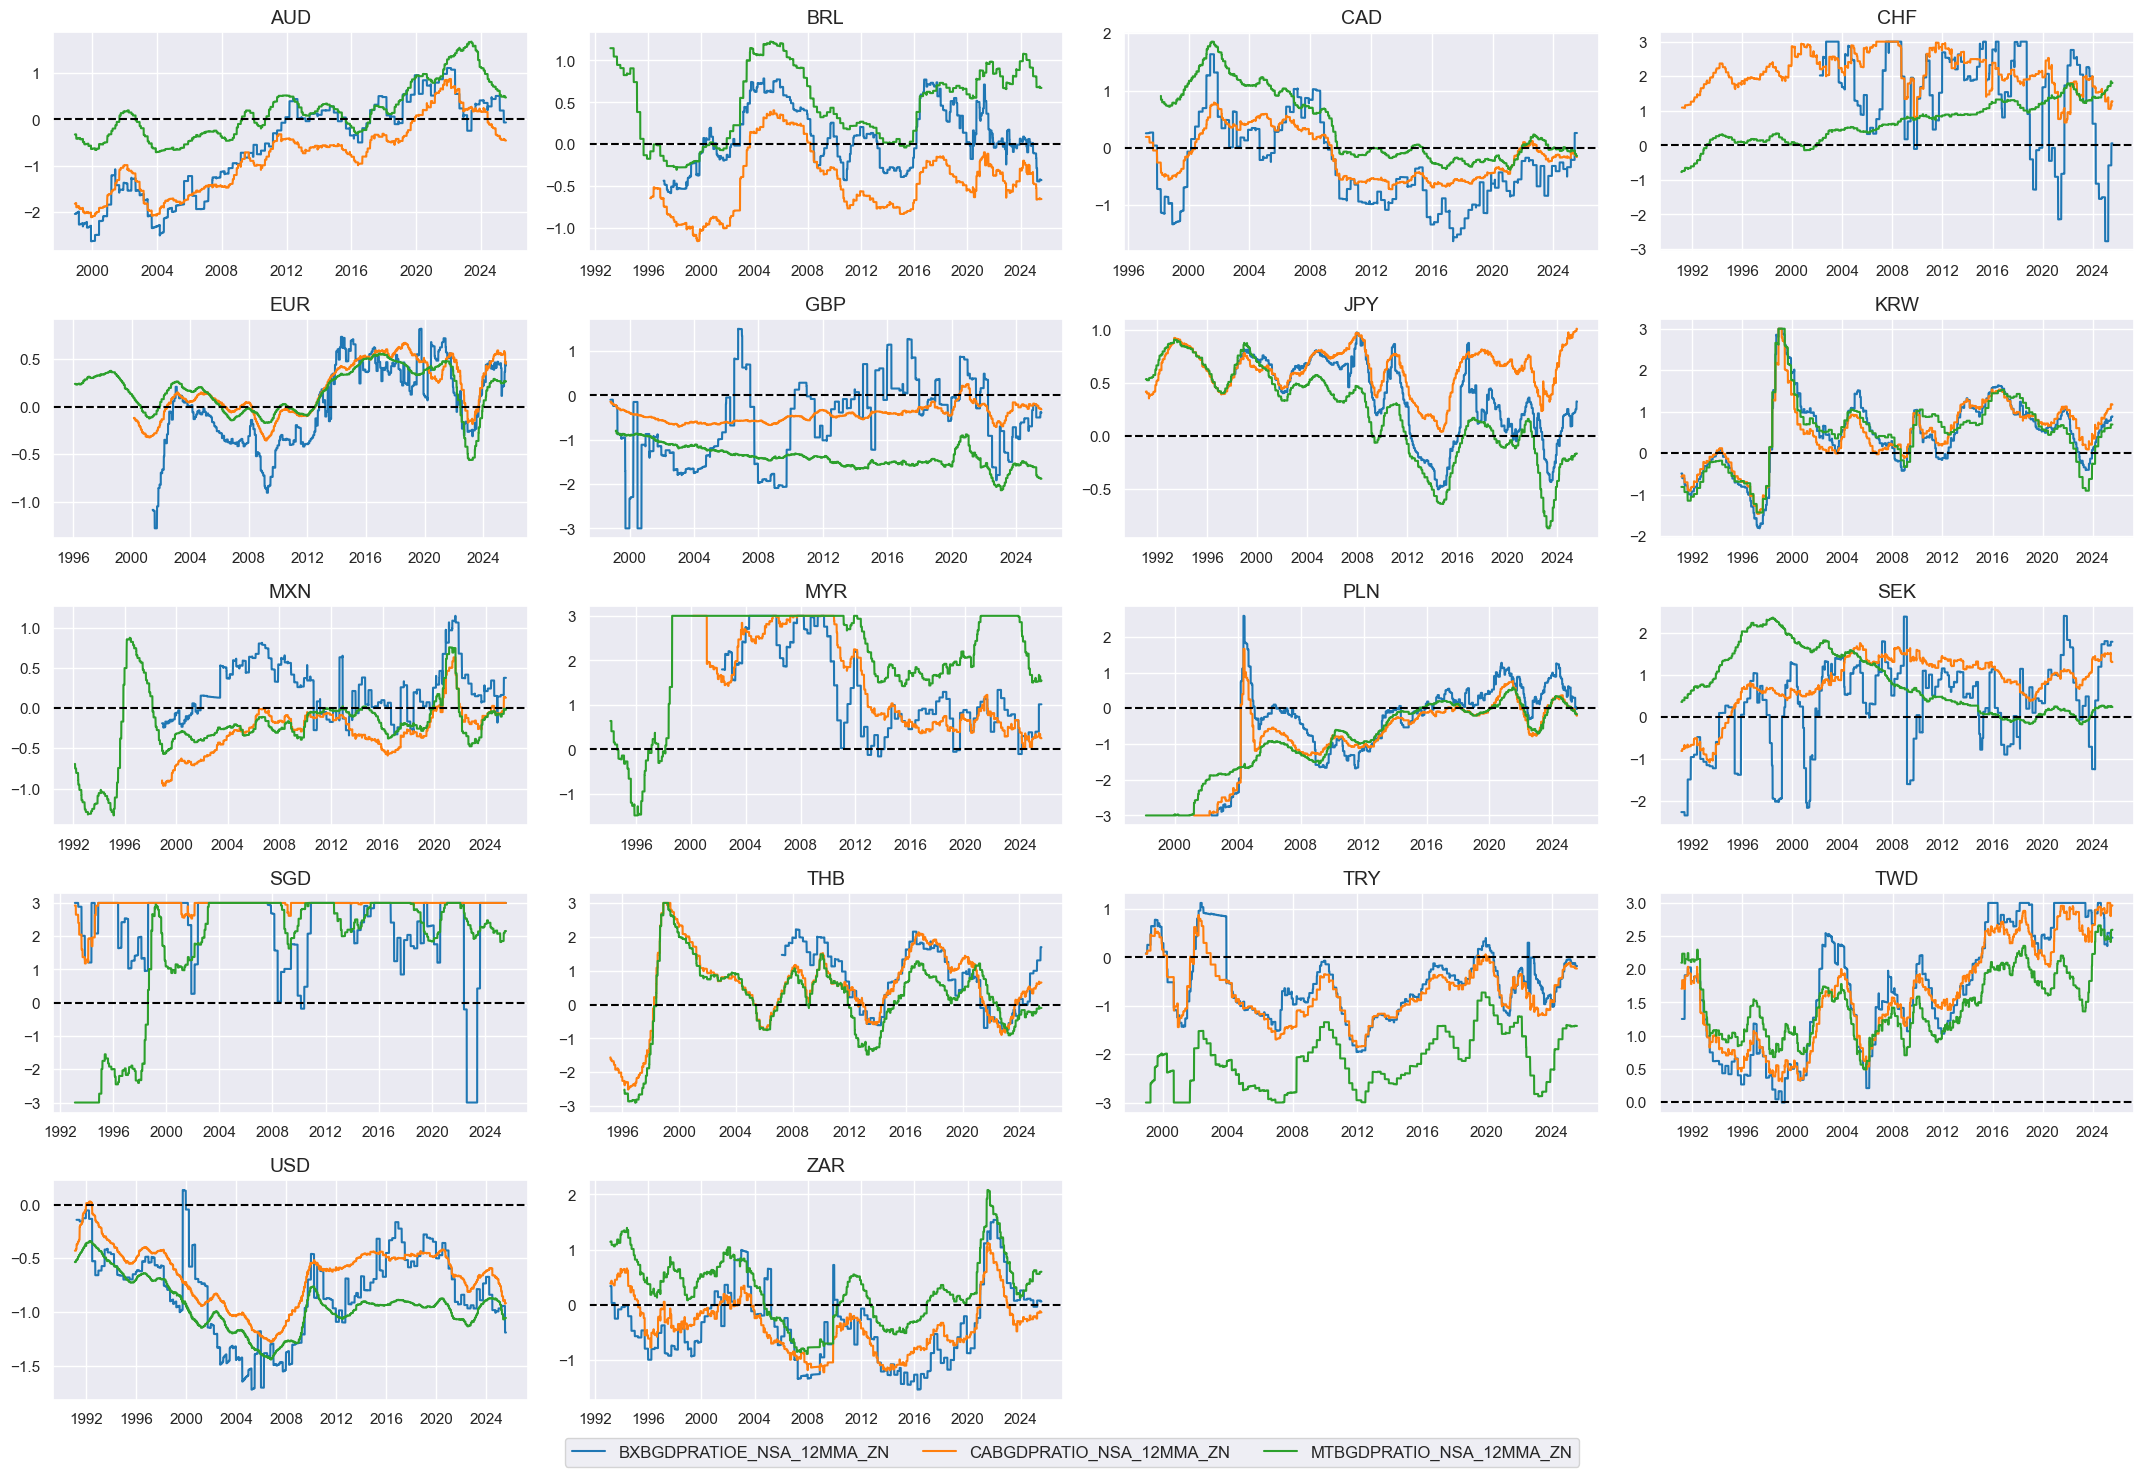
External balances #
Specs #
# Un-scored indicators and score weights and signs

dict_xbal = {
    "BXBGDPRATIOE_NSA_12MMA": (1/3, 1),
    "CABGDPRATIO_NSA_12MMA": (1/3, 1),
    "MTBGDPRATIO_NSA_12MMA": (1/3, 1),
}
Constituent scores #
# Panel-based normalization

cidx = cids_eq
xcatx = [xcat for xcat in list(dict_xbal.keys())]
sdate = "1990-01-01"

for xc in xcatx:
    dfaa = msp.make_zn_scores(
        dfx,
        xcat=xc,
        cids=cidx,
        sequential=True,
        min_obs=261 * 5,
        neutral="zero",
        pan_weight=1,
        thresh=3,
        postfix="_ZN",
        est_freq="m",
    )
    dfa = msm.update_df(dfa, dfaa)

dfx = msm.update_df(dfx, dfa)
xbalz = [xc + "_ZN" for xc in xcatx]
cidx = cids_eq
xcatx = xbalz

msp.view_timelines(
    dfx,
    xcats=xcatx,
    cids=cidx,
    ncol=4,
    same_y=False,
    all_xticks=True,
    aspect=1.8,
    height=2,
)
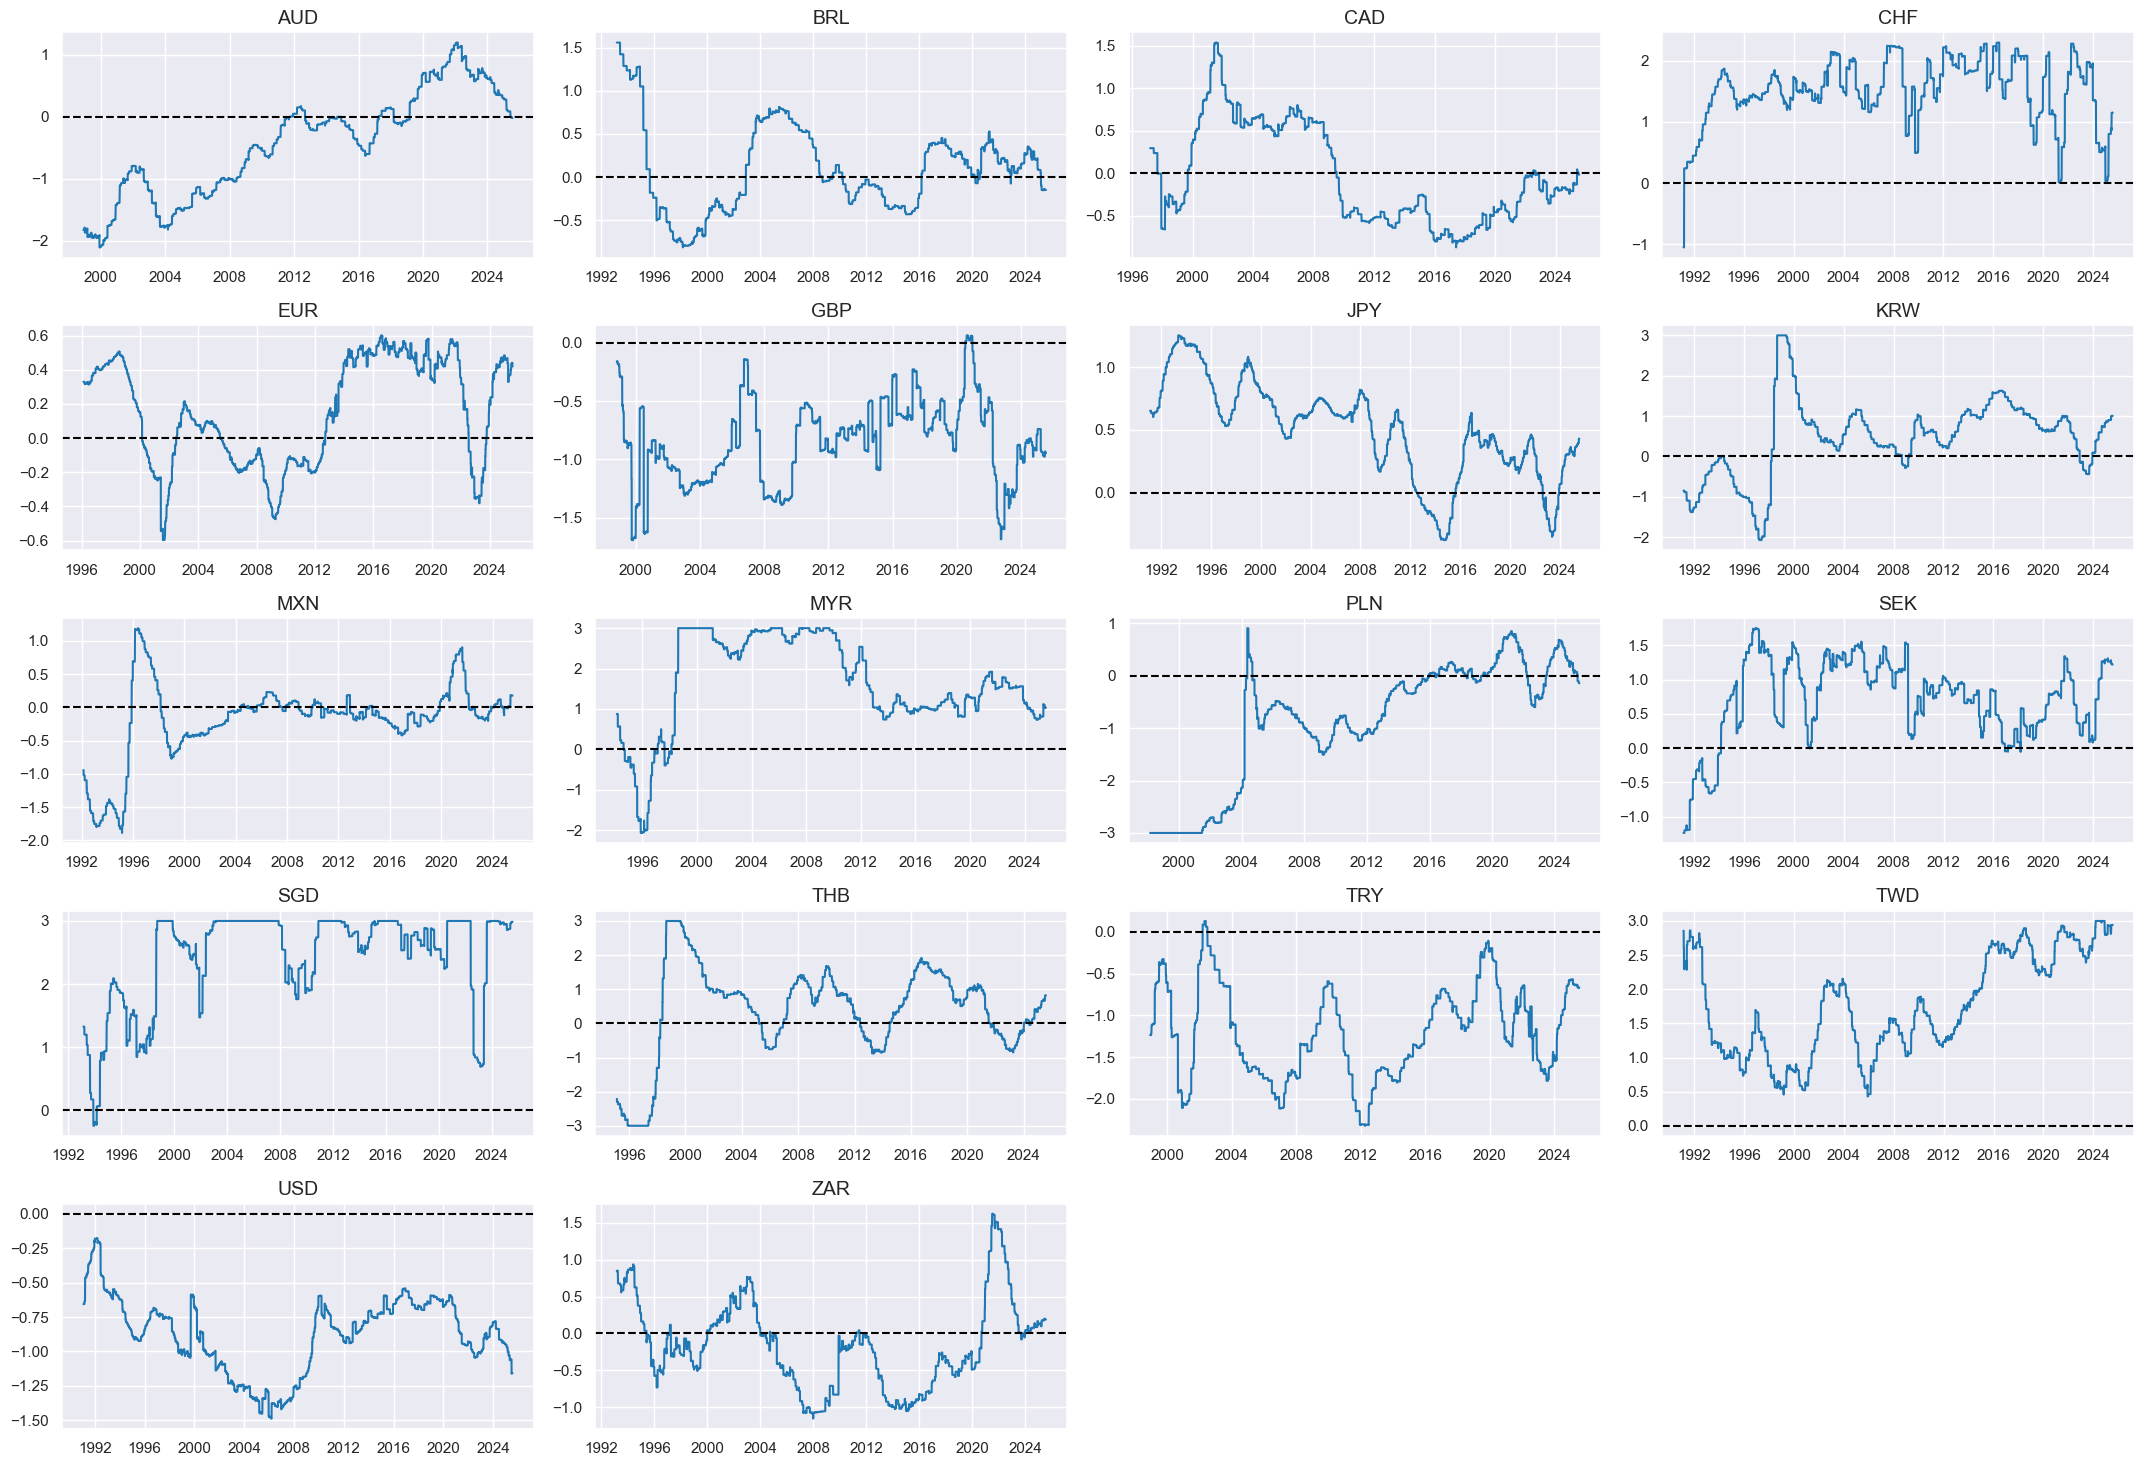
Composite scores #
# Weighted linear combination

cidx = cids_eq
dix = dict_xbal

xcatx = [k + "_ZN" for k in list(dix.keys())]
weights = [v[0] for v in list(dix.values())]
signs = [v[1] for v in list(dix.values())]
czs = "XBAL"

dfa = msp.linear_composite(
    dfx,
    xcats=xcatx,
    cids=cidx,
    weights=weights,
    signs=signs,
    normalize_weights=True,
    complete_xcats=False,  # score works with what is available
    new_xcat=czs,
)
dfx = msm.update_df(dfx, dfa)

# Re-scoring

dfa = msp.make_zn_scores(
    dfx,
    xcat=czs,
    cids=cidx,
    sequential=True,
    min_obs=261 * 3,
    neutral="zero",
    pan_weight=1,
    thresh=3,
    postfix="_ZN",
    est_freq="m",
)
dfx = msm.update_df(dfx, dfa)

dict_facts[czs + "_ZN"] = "External balance ratios"
xcatx = ["XBAL_ZN"]
cidx = cids_eq
sdate = "1990-01-01"

msp.view_timelines(
    dfx,
    xcats=xcatx,
    cids=cidx,
    ncol=4,
    same_y=False,
    all_xticks=True,
    aspect=1.8,
    height=2,
)
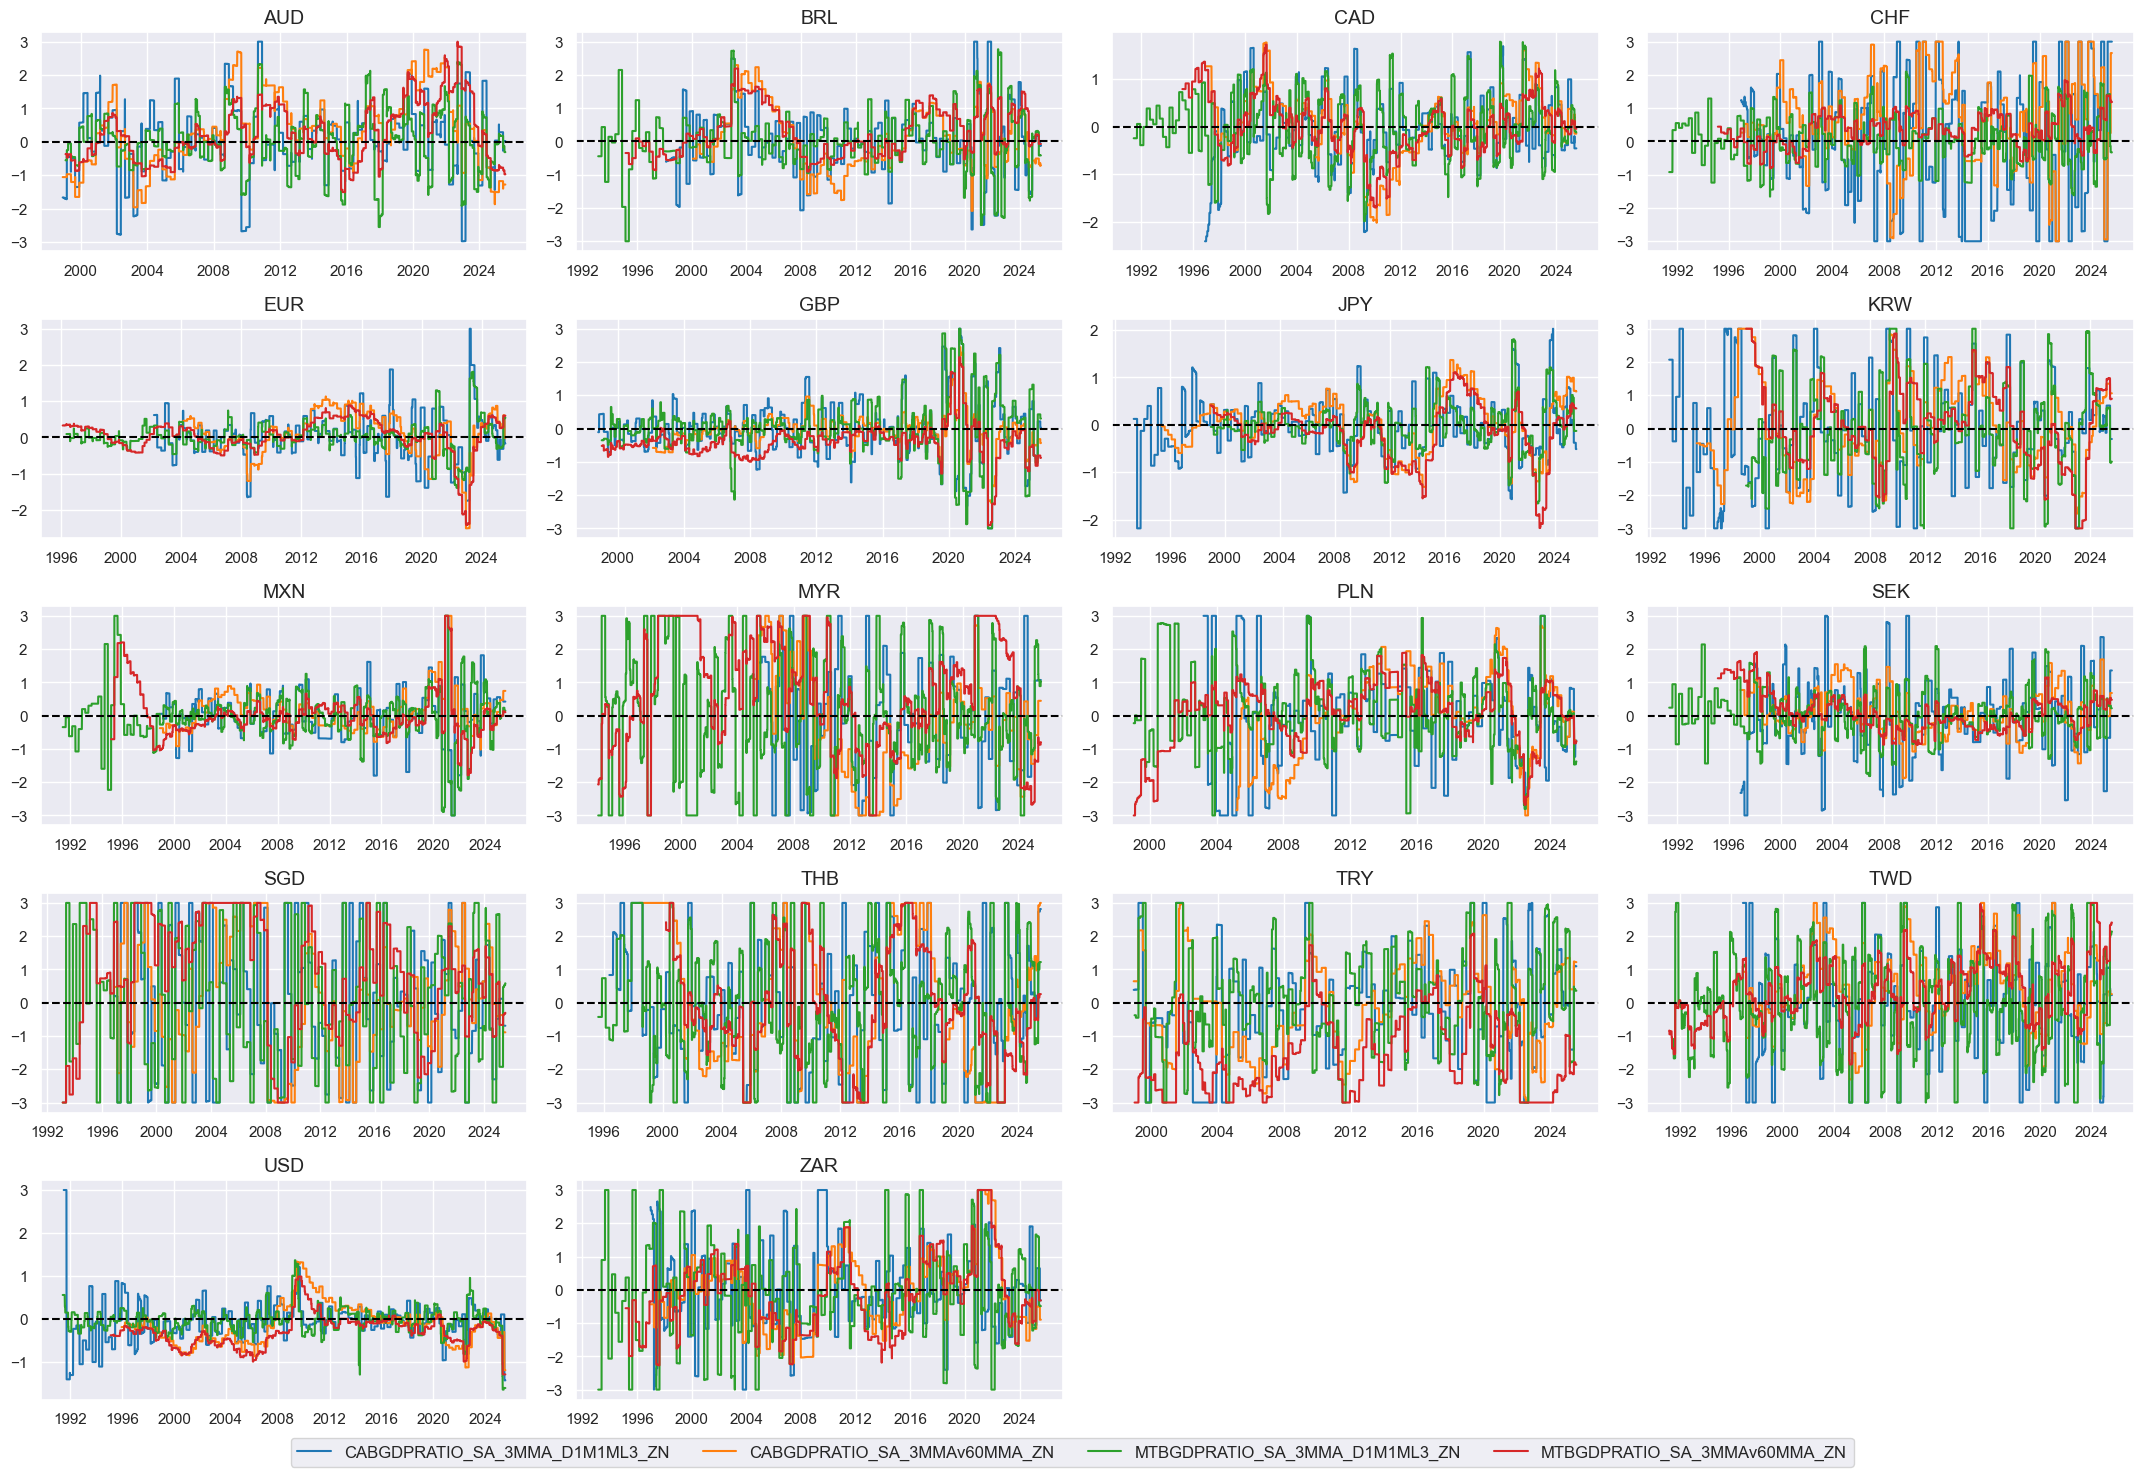
External balance changes #
Specs #
# Un-scored indicators and score weights and signs

dict_xbal_chg = {
    "CABGDPRATIO_SA_3MMA_D1M1ML3": (1/4, 1),
    "CABGDPRATIO_SA_3MMAv60MMA": (1/4, 1),
    "MTBGDPRATIO_SA_3MMA_D1M1ML3": (1/4, 1),
    "MTBGDPRATIO_SA_3MMAv60MMA": (1/4, 1),
}
Constituent scores #
# Panel-based normalization

cidx = cids_eq
xcatx = [xcat for xcat in list(dict_xbal_chg.keys())]
sdate = "1990-01-01"

for xc in xcatx:
    dfaa = msp.make_zn_scores(
        dfx,
        xcat=xc,
        cids=cidx,
        sequential=True,
        min_obs=261 * 5,
        neutral="zero",
        pan_weight=1,
        thresh=3,
        postfix="_ZN",
        est_freq="m",
    )
    dfa = msm.update_df(dfa, dfaa)

dfx = msm.update_df(dfx, dfa)
xbalchgz = [xc + "_ZN" for xc in xcatx]
cidx = cids_eq
xcatx = xbalchgz

msp.view_timelines(
    dfx,
    xcats=xcatx,
    cids=cidx,
    ncol=4,
    same_y=False,
    all_xticks=True,
    aspect=1.8,
    height=2,
)
Composite scores #
# Weighted linear combination

cidx = cids_eq
dix = dict_xbal_chg

xcatx = [k + "_ZN" for k in list(dix.keys())]
weights = [v[0] for v in list(dix.values())]
signs = [v[1] for v in list(dix.values())]
czs = "XBAL_CHG"

dfa = msp.linear_composite(
    dfx,
    xcats=xcatx,
    cids=cidx,
    weights=weights,
    signs=signs,
    normalize_weights=True,
    complete_xcats=False,  # score works with what is available
    new_xcat=czs,
)
dfx = msm.update_df(dfx, dfa)

# Re-scoring

dfa = msp.make_zn_scores(
    dfx,
    xcat=czs,
    cids=cidx,
    sequential=True,
    min_obs=261 * 3,
    neutral="zero",
    pan_weight=1,
    thresh=3,
    postfix="_ZN",
    est_freq="m",
)
dfx = msm.update_df(dfx, dfa)

dict_facts[czs + "_ZN"] = "External balance changes"
cidx = cids_eq
xcatx = ["XBAL_CHG_ZN"]

msp.view_timelines(
    dfx,
    xcats=xcatx,
    cids=cidx,
    ncol=4,
    same_y=False,
    all_xticks=True,
    aspect=1.8,
    height=2,
)
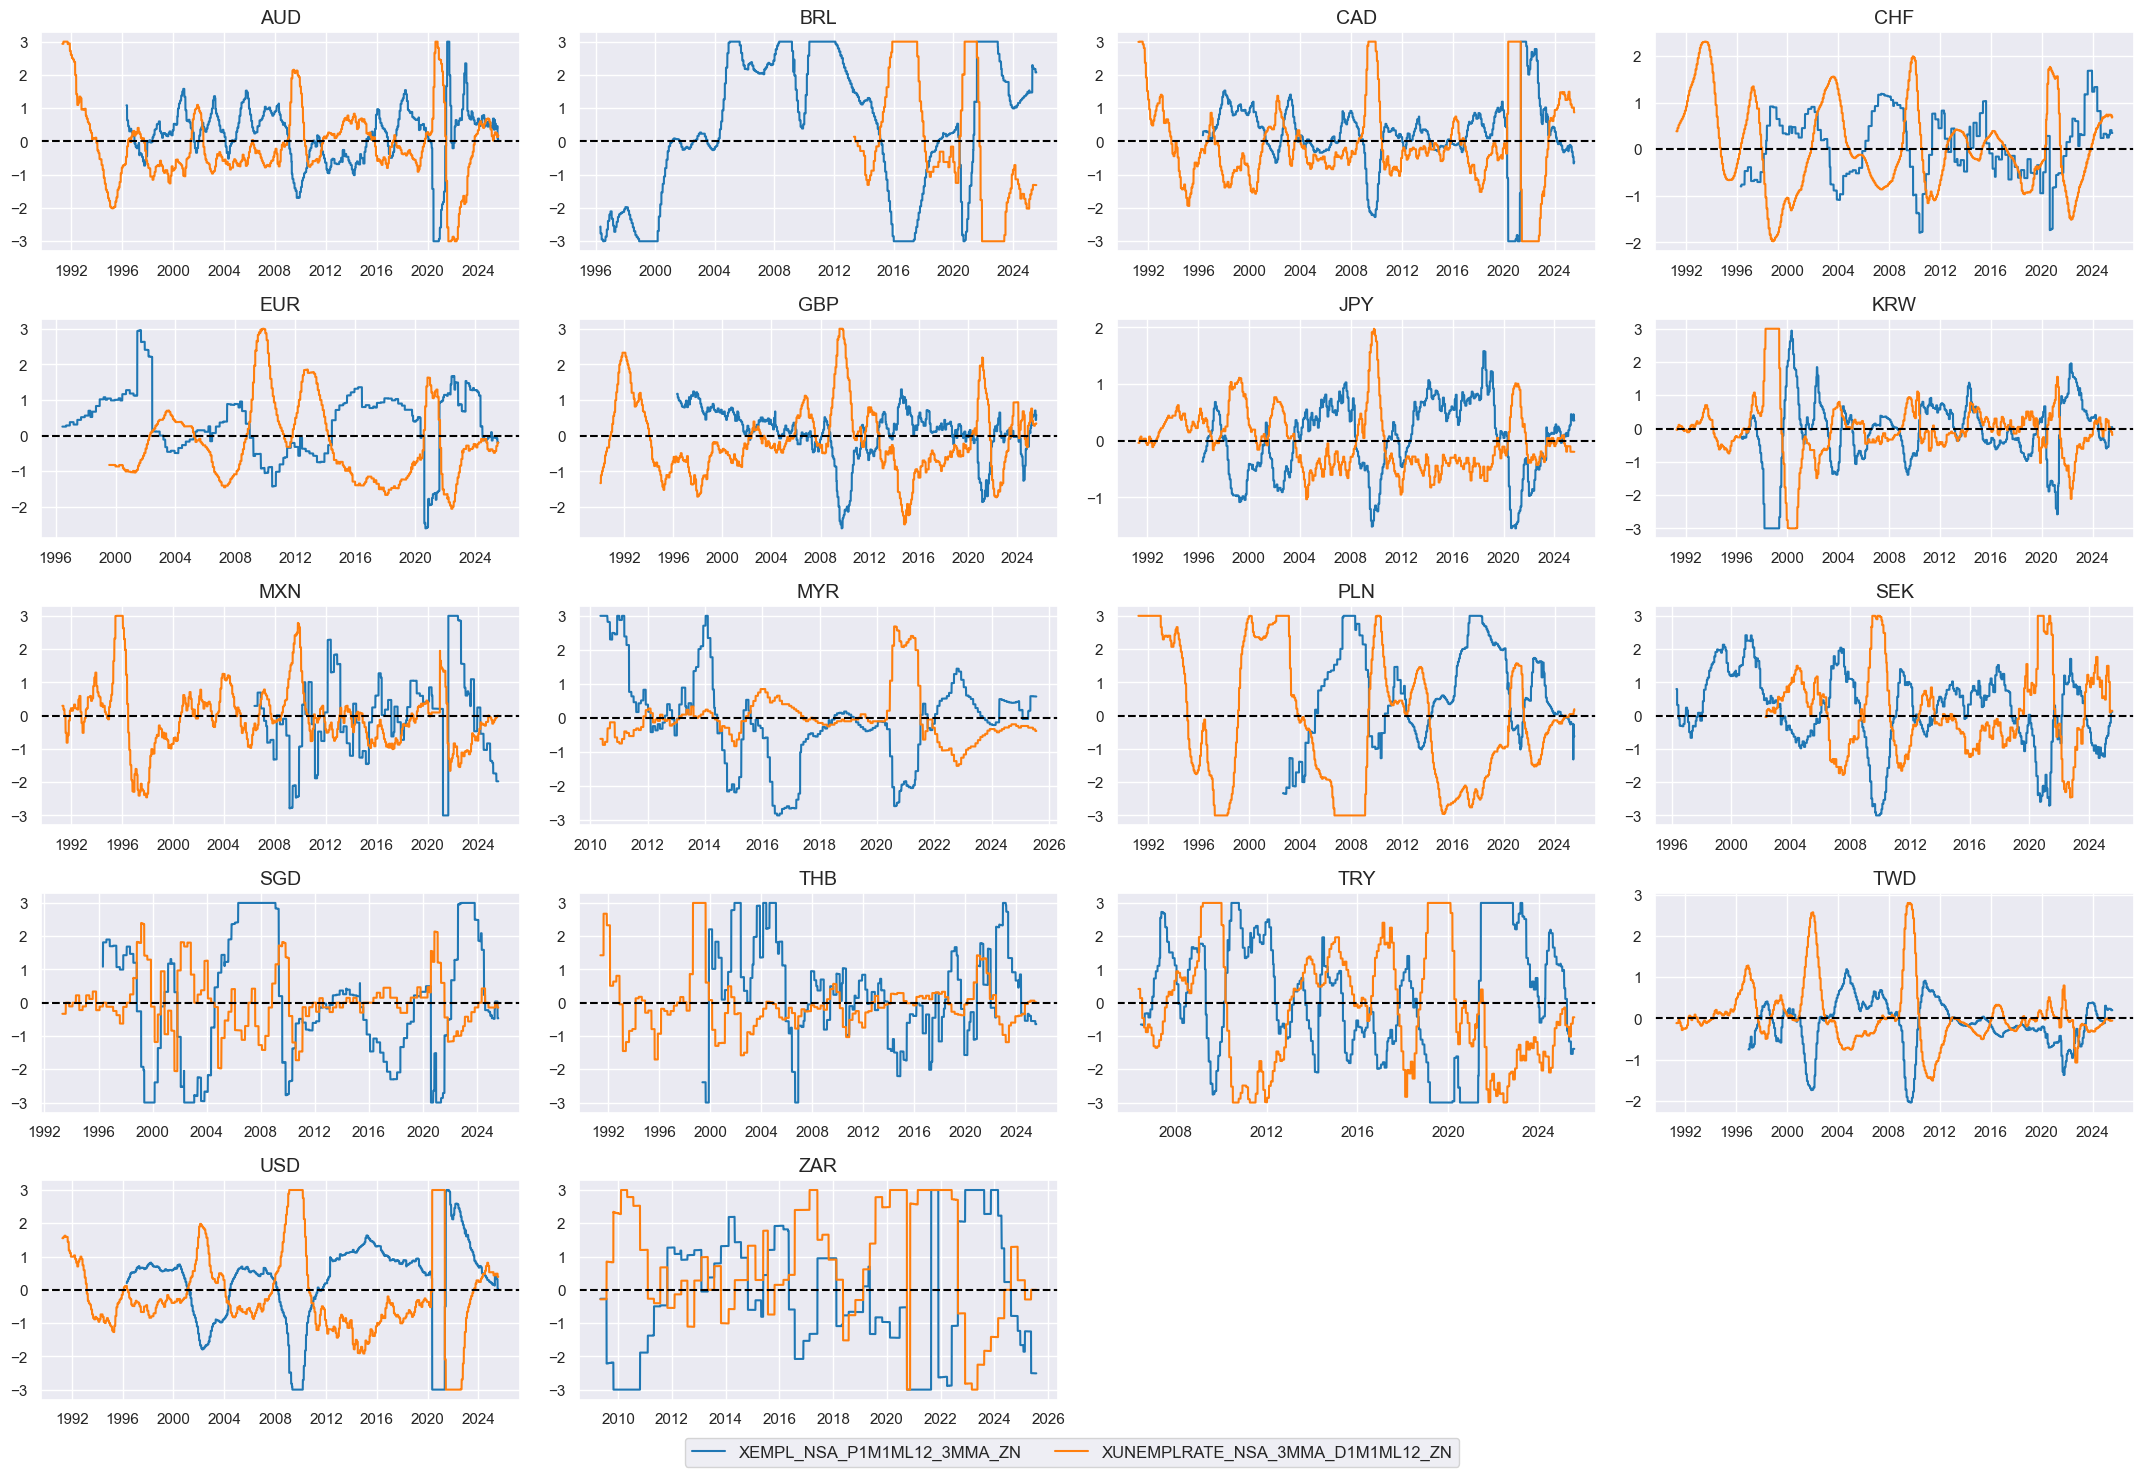
Labor market slackening #
Specs #
# Un-scored indicators and score weights and signs

dict_labor = {
    "EMPL_NSA_P1M1ML12_3MMA": (1/2, -1),
    "UNEMPLRATE_NSA_3MMA_D1M1ML12": (1/2, 1),
}
Constituent scores #
# Excess employment

calcs = [
    "XEMPL_NSA_P1M1ML12_3MMA = EMPL_NSA_P1M1ML12_3MMA - WFORCE_NSA_P1Y1YL1_5YMM",
    "XUNEMPLRATE_NSA_3MMA_D1M1ML12 = UNEMPLRATE_NSA_3MMA_D1M1ML12",
]

dfa = msp.panel_calculator(
    dfx,
    calcs=calcs,
    cids=cids_eq,
)
dfx = msm.update_df(dfx, dfa)
# Panel-based normalization

cidx = cids_eq
xcatx = ["X" + xcat for xcat in dict_labor.keys()]
sdate = "1990-01-01"

for xc in xcatx:
    dfaa = msp.make_zn_scores(
        dfx,
        xcat=xc,
        cids=cidx,
        sequential=True,
        min_obs=261 * 5,
        neutral="zero",
        pan_weight=1,
        thresh=3,
        postfix="_ZN",
        est_freq="m",
    )
    dfa = msm.update_df(dfa, dfaa)

dfx = msm.update_df(dfx, dfa)
xlabz = [xcat + "_ZN" for xcat in xcatx]
cidx = cids_eq
xcatx = xlabz

msp.view_timelines(
    dfx,
    xcats=xcatx,
    cids=cidx,
    ncol=4,
    same_y=False,
    all_xticks=True,
    aspect=1.8,
    height=2,
)
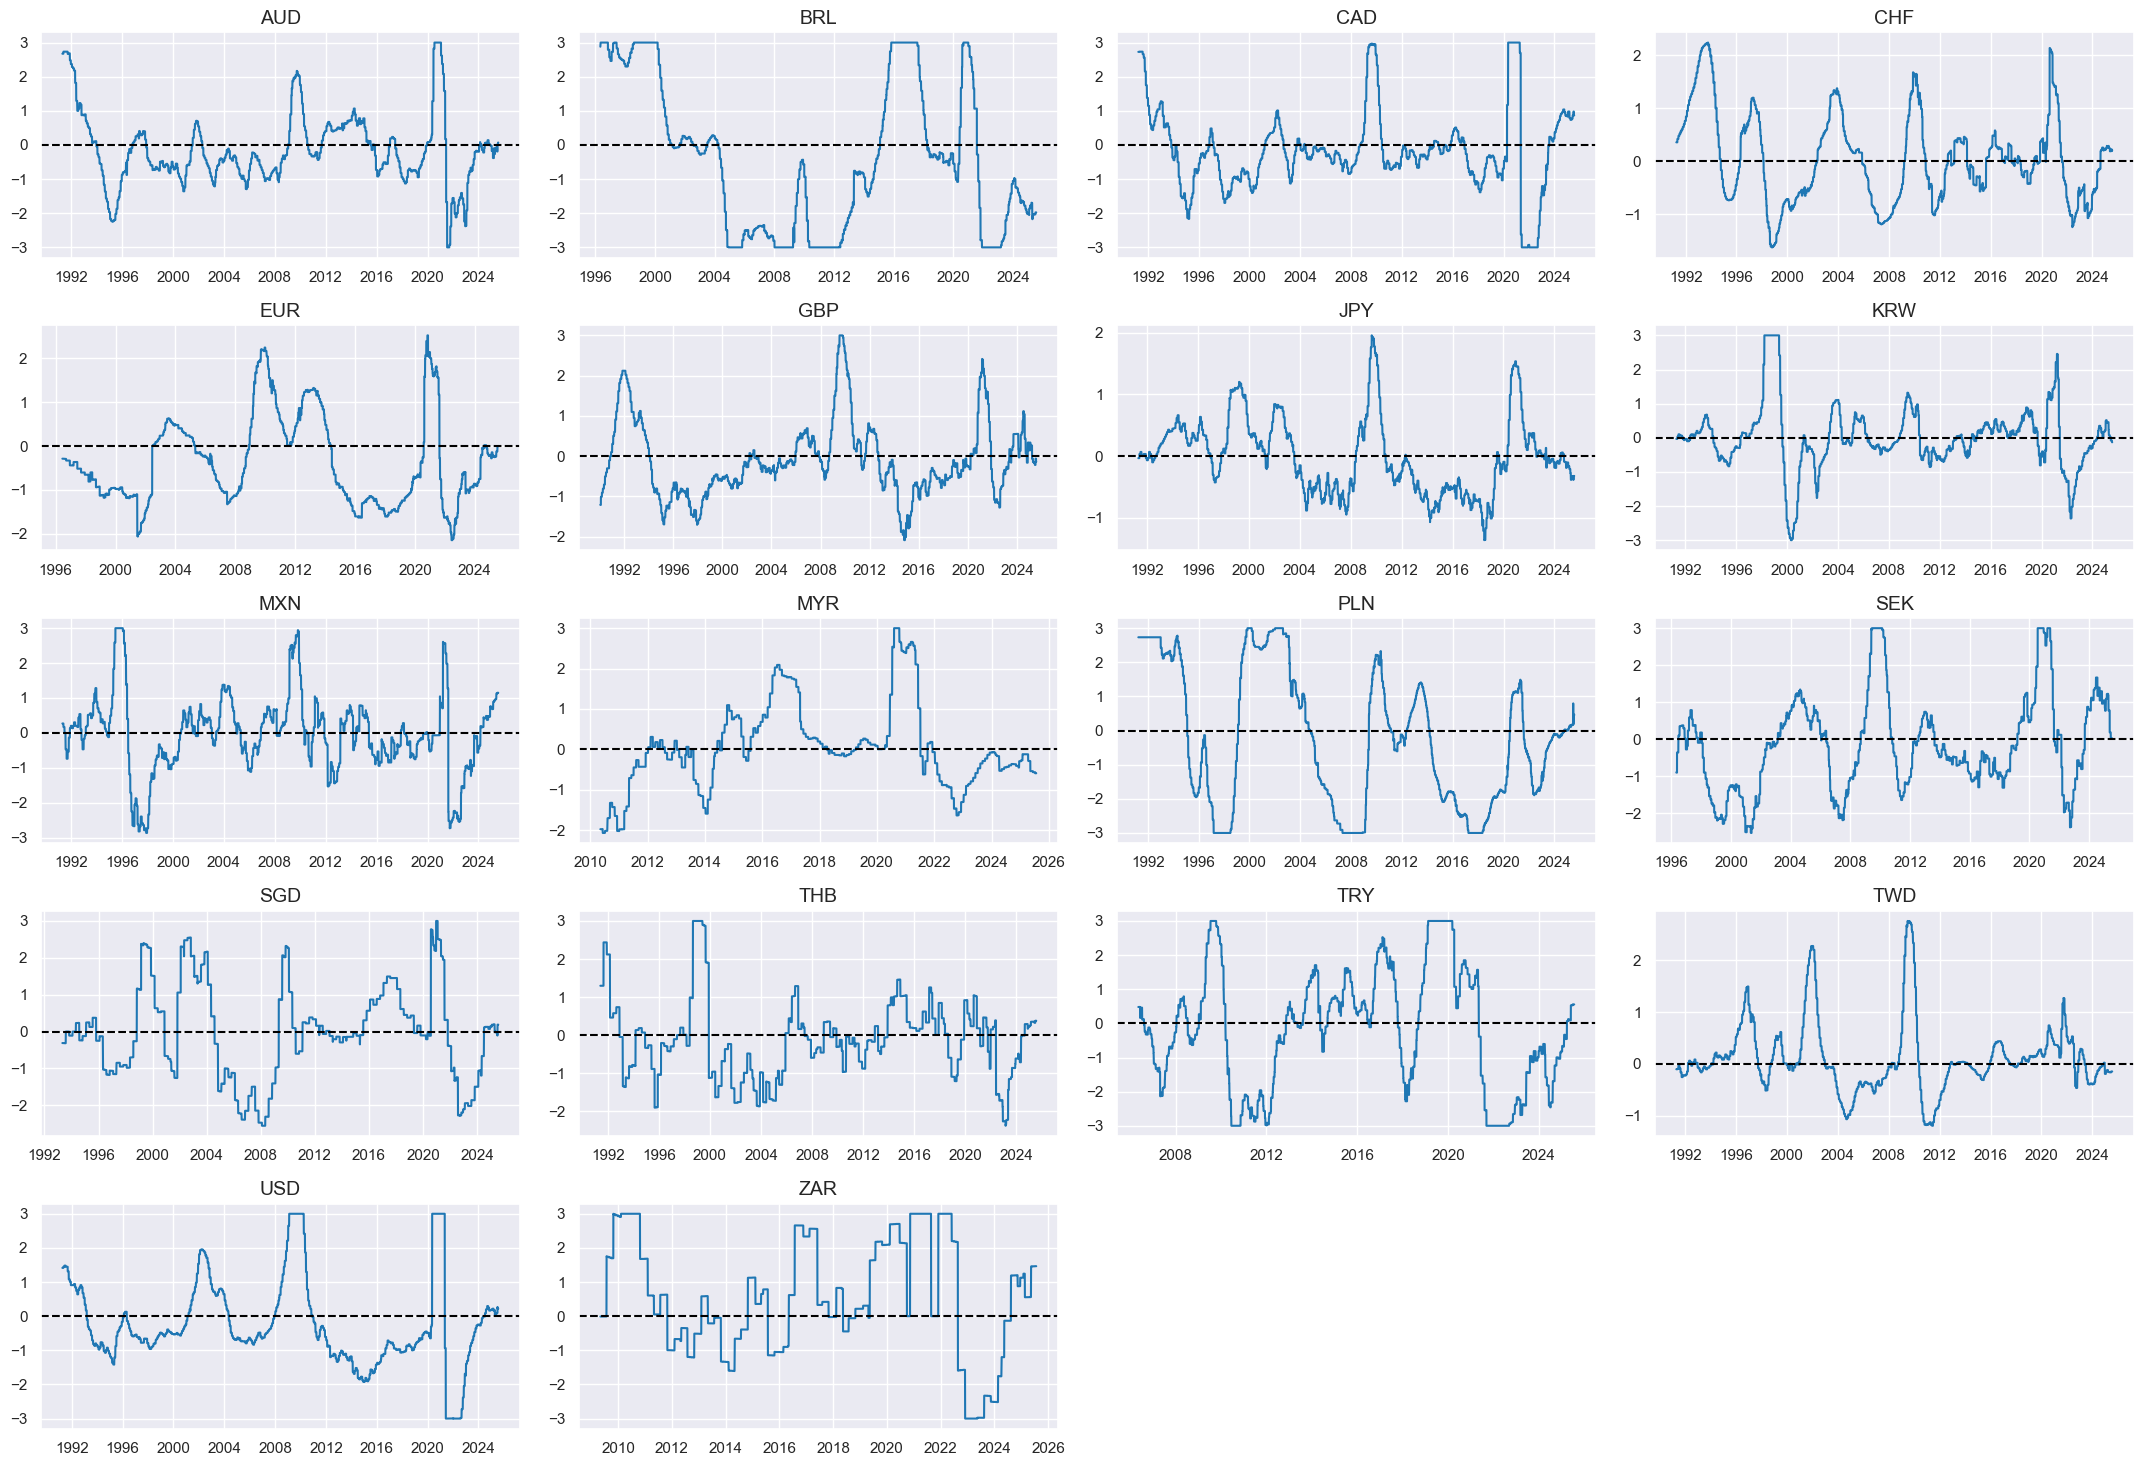
Composite scores #
# Weighted linear combination

cidx = cids_eq
dix = dict_labor

xcatx = ["X" + k + "_ZN" for k in list(dix.keys())]
weights = [v[0] for v in list(dix.values())]
signs = [v[1] for v in list(dix.values())]
czs = "XLAB"

dfa = msp.linear_composite(
    dfx,
    xcats=xcatx,
    cids=cidx,
    weights=weights,
    signs=signs,
    normalize_weights=True,
    complete_xcats=False,  # score works with what is available
    new_xcat=czs,
)
dfx = msm.update_df(dfx, dfa)

# Re-scoring

dfa = msp.make_zn_scores(
    dfx,
    xcat=czs,
    cids=cidx,
    sequential=True,
    min_obs=261 * 3,
    neutral="zero",
    pan_weight=1,
    thresh=3,
    postfix="_ZN",
    est_freq="m",
)
dfx = msm.update_df(dfx, dfa)

dict_facts[czs + "_ZN"] = "Labor market slackening"
cidx = cids_eq
xcatx = ["XLAB_ZN"]

msp.view_timelines(
    dfx,
    xcats=xcatx,
    cids=cidx,
    ncol=4,
    same_y=False,
    all_xticks=True,
    aspect=1.8,
    height=2,
)
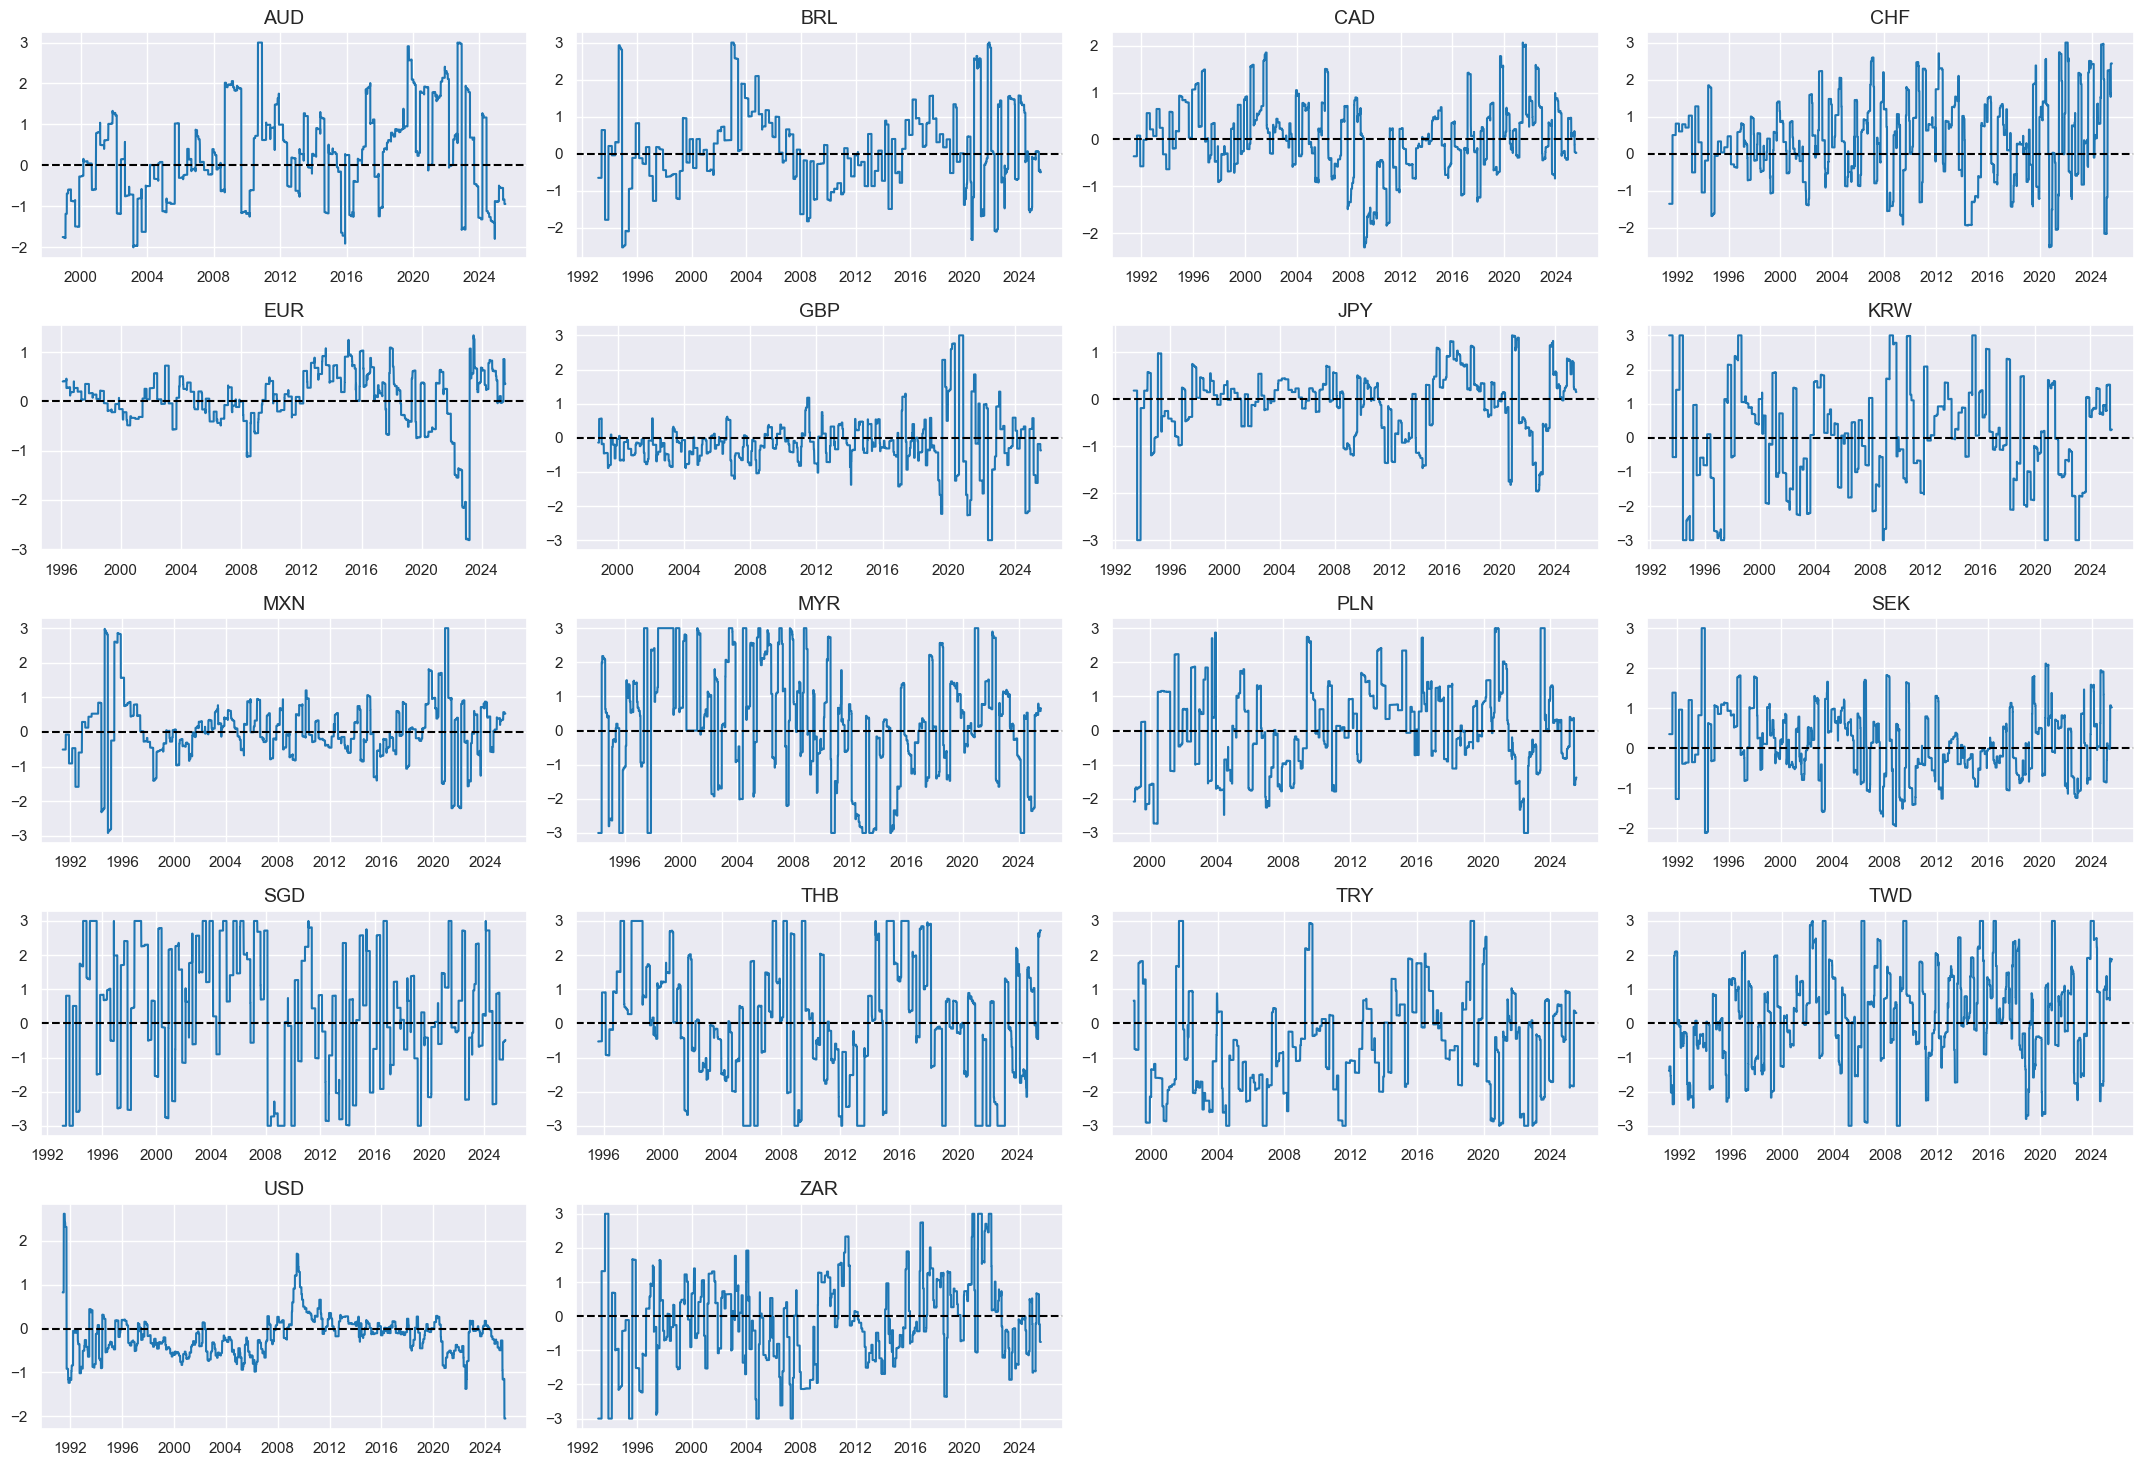
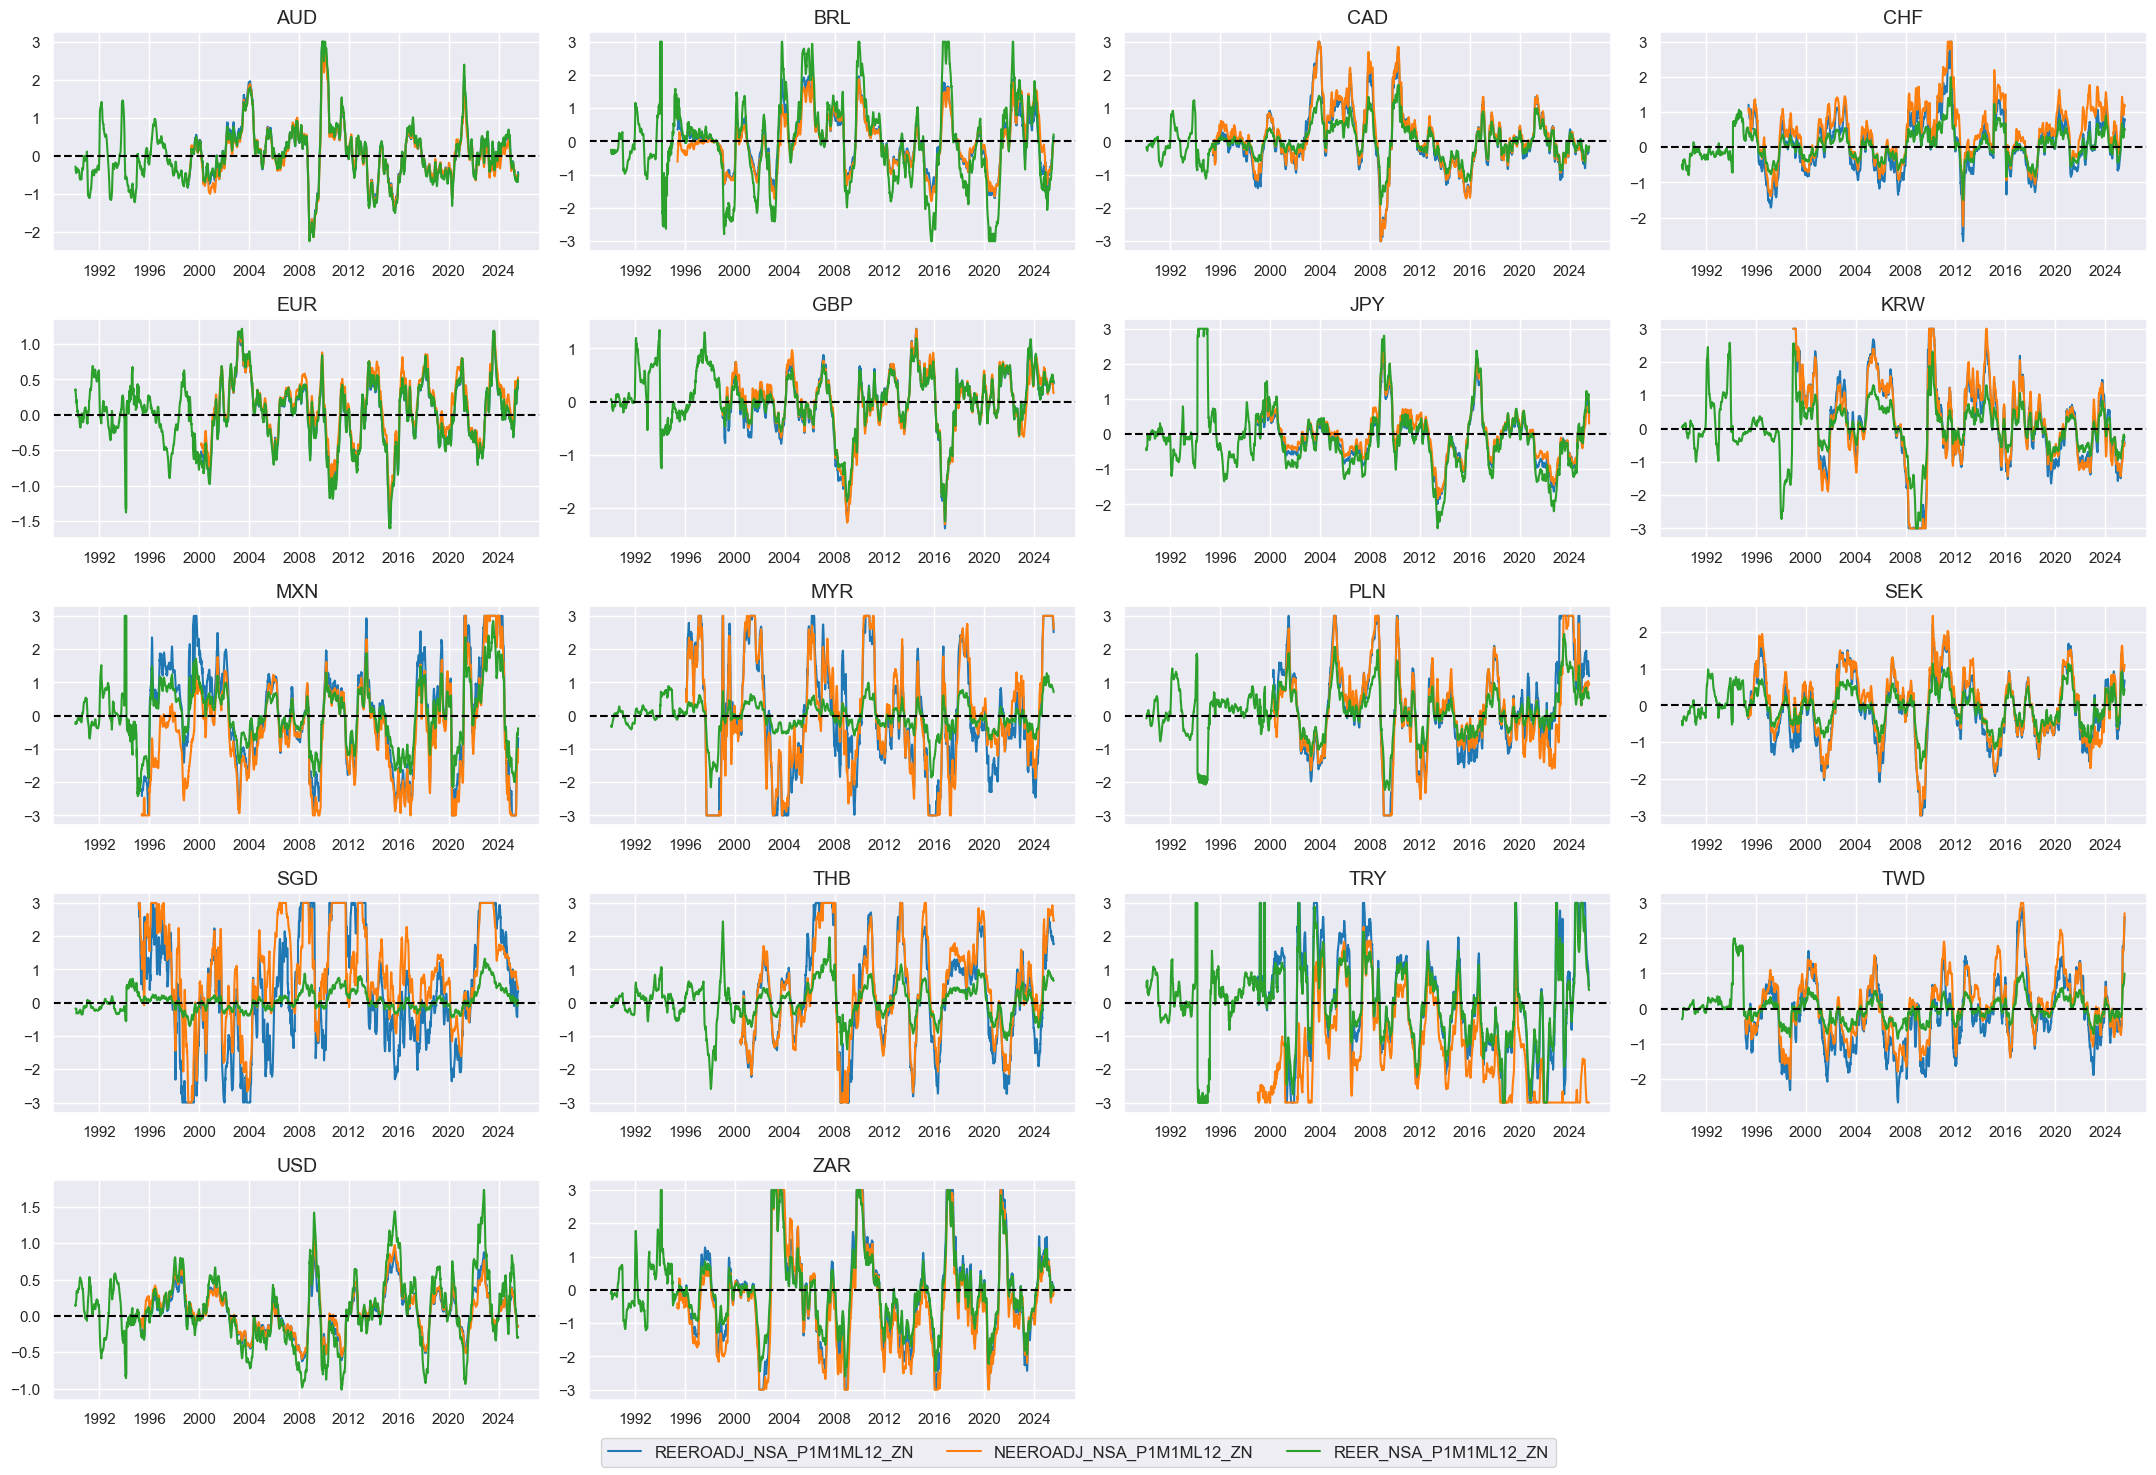
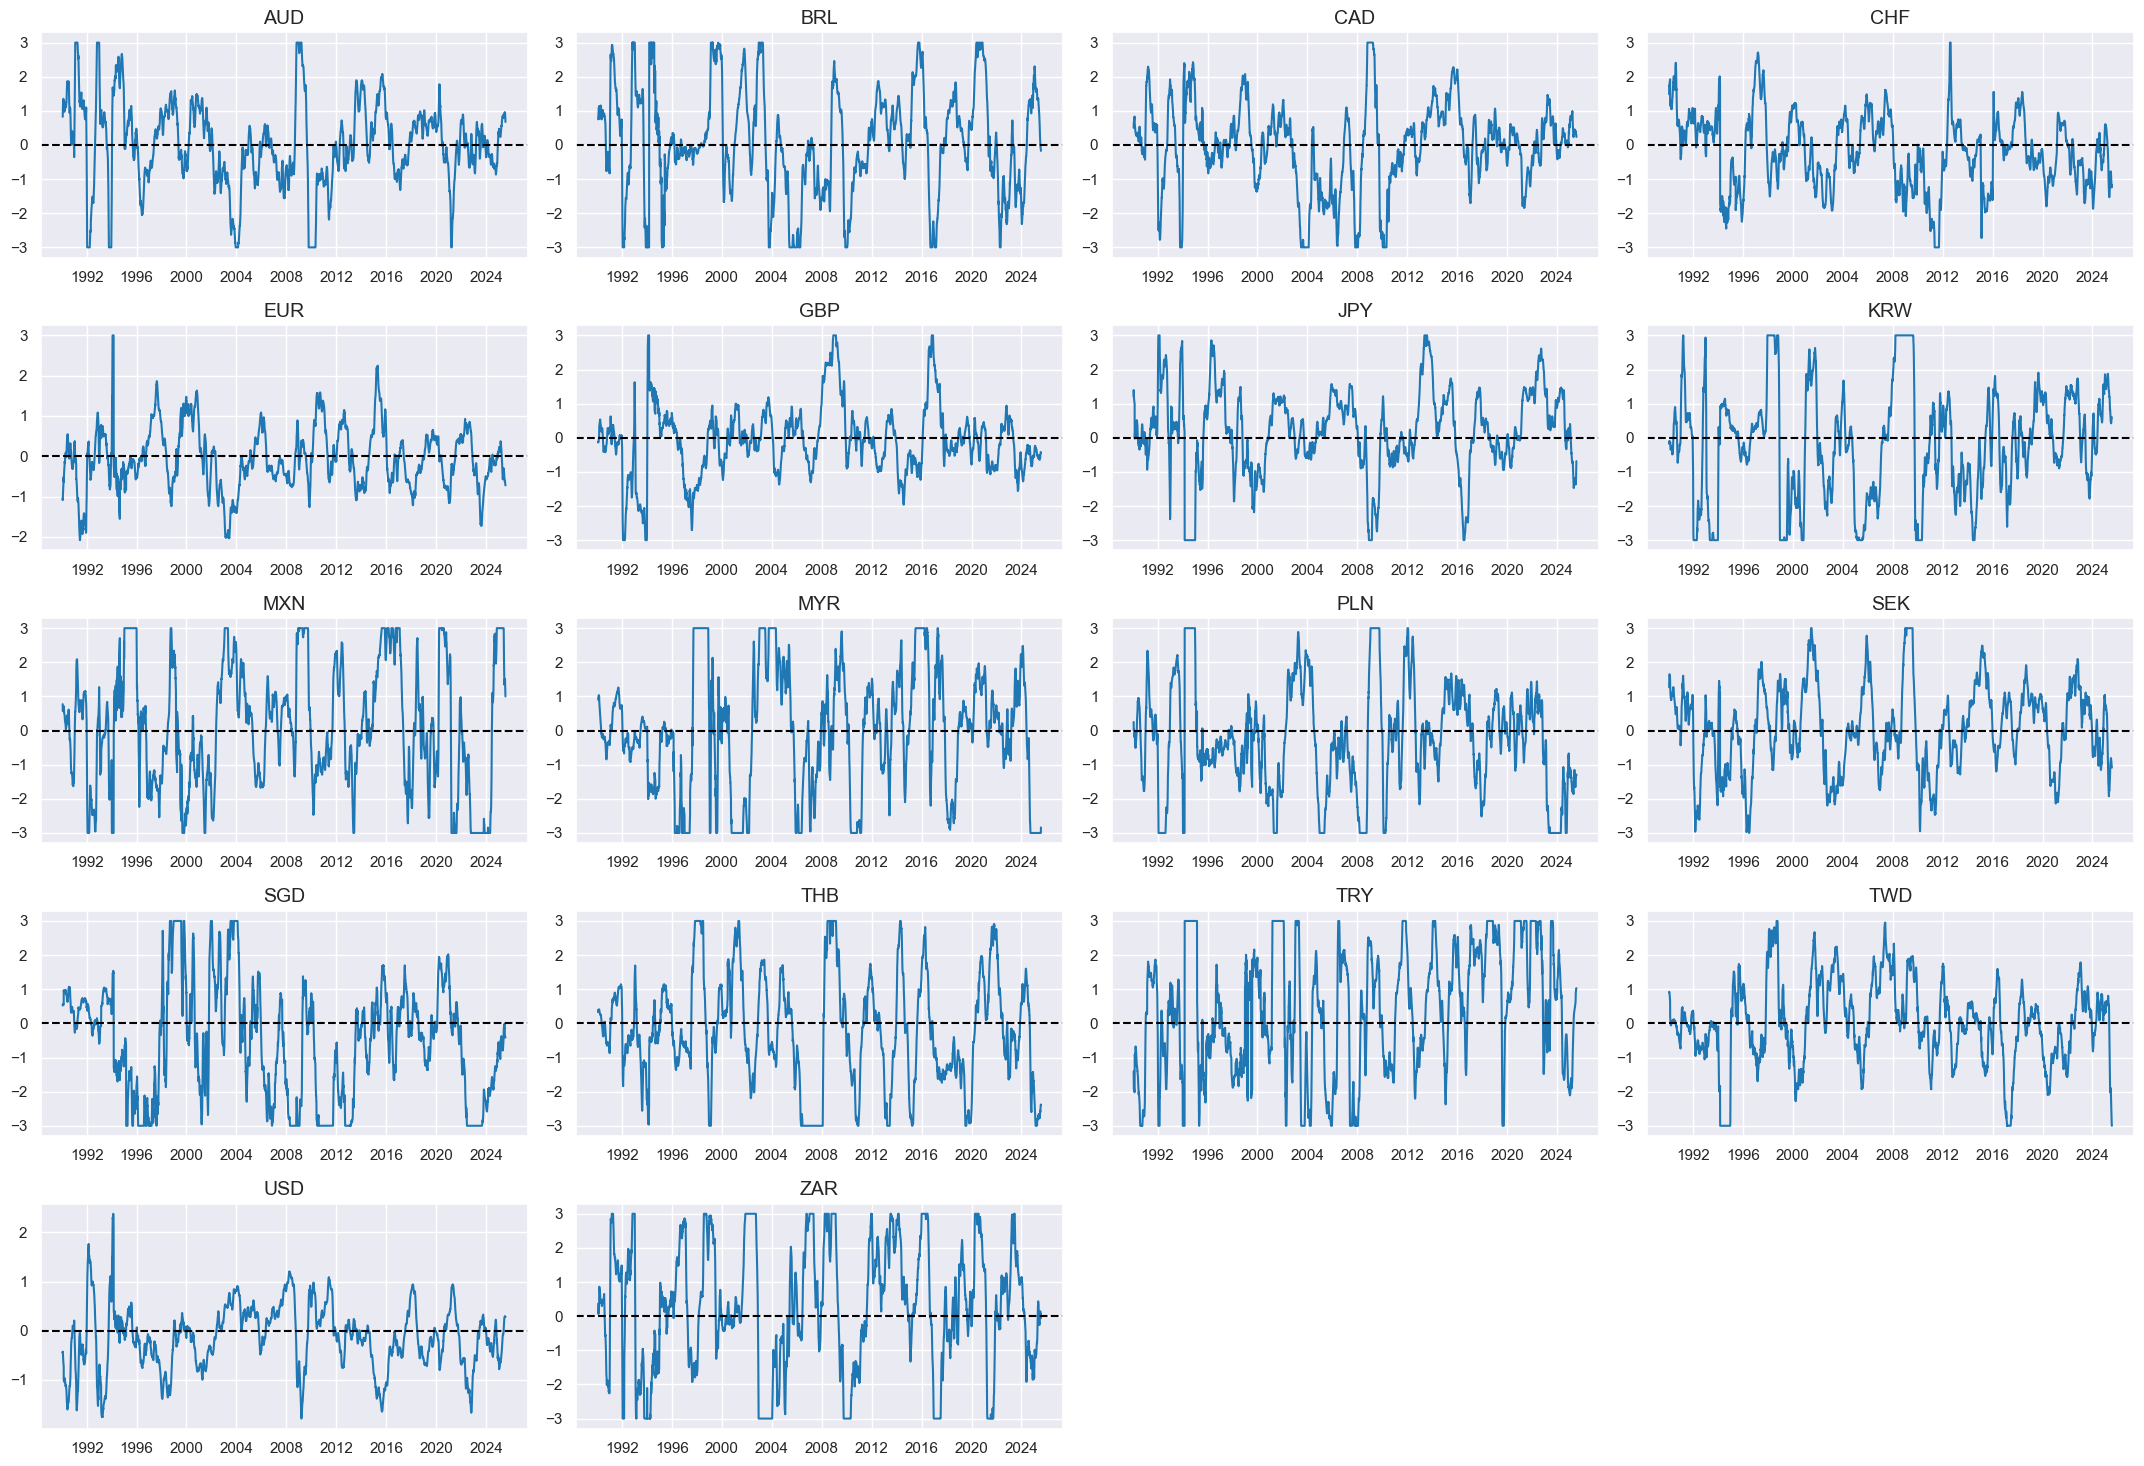
Effective currency depreciation #
Specs #
# Un-scored indicators and weights

dict_fx = {
    "REEROADJ_NSA_P1M1ML12": (1/3, -1),
    "NEEROADJ_NSA_P1M1ML12": (1/3, -1),
    "REER_NSA_P1M1ML12": (1/3, -1),
}
Constituent scores #
# Panel-based normalization

cidx = cids_eq
xcatx = [xcat for xcat in list(dict_fx.keys())]
sdate = "1990-01-01"

for xc in xcatx:
    dfaa = msp.make_zn_scores(
        dfx,
        xcat=xc,
        cids=cidx,
        sequential=True,
        min_obs=261 * 5,
        neutral="zero",
        pan_weight=1,
        thresh=3,
        postfix="_ZN",
        est_freq="m",
    )
    dfa = msm.update_df(dfa, dfaa)

dfx = msm.update_df(dfx, dfa)
fxz = [xcat + "_ZN" for xcat in xcatx]
cidx = cids_eq
xcatx = fxz

msp.view_timelines(
    dfx,
    xcats=xcatx,
    cids=cidx,
    ncol=4,
    same_y=False,
    all_xticks=True,
    aspect=1.8,
    height=2,
)
Composite scores #
# Weighted linear combination

cidx = cids_eq
dix = dict_fx

xcatx = [k + "_ZN" for k in list(dix.keys())]
weights = [v[0] for v in list(dix.values())]
signs = [v[1] for v in list(dix.values())]
czs = "EFFX_NEG"

dfa = msp.linear_composite(
    dfx,
    xcats=xcatx,
    cids=cidx,
    weights=weights,
    signs=signs,
    normalize_weights=True,
    complete_xcats=False,  # score works with what is available
    new_xcat=czs,
)
dfx = msm.update_df(dfx, dfa)

# Re-scoring

dfa = msp.make_zn_scores(
    dfx,
    xcat=czs,
    cids=cidx,
    sequential=True,
    min_obs=261 * 3,
    neutral="zero",
    pan_weight=1,
    thresh=3,
    postfix="_ZN",
    est_freq="m",
)
dfx = msm.update_df(dfx, dfa)

dict_facts[czs + "_ZN"] = "Effective FX depreciation"
cidx = cids_eq
xcatx = ["EFFX_NEG_ZN"]

msp.view_timelines(
    dfx,
    xcats=xcatx,
    cids=cidx,
    ncol=4,
    same_y=False,
    all_xticks=True,
    aspect=1.8,
    height=2,
)
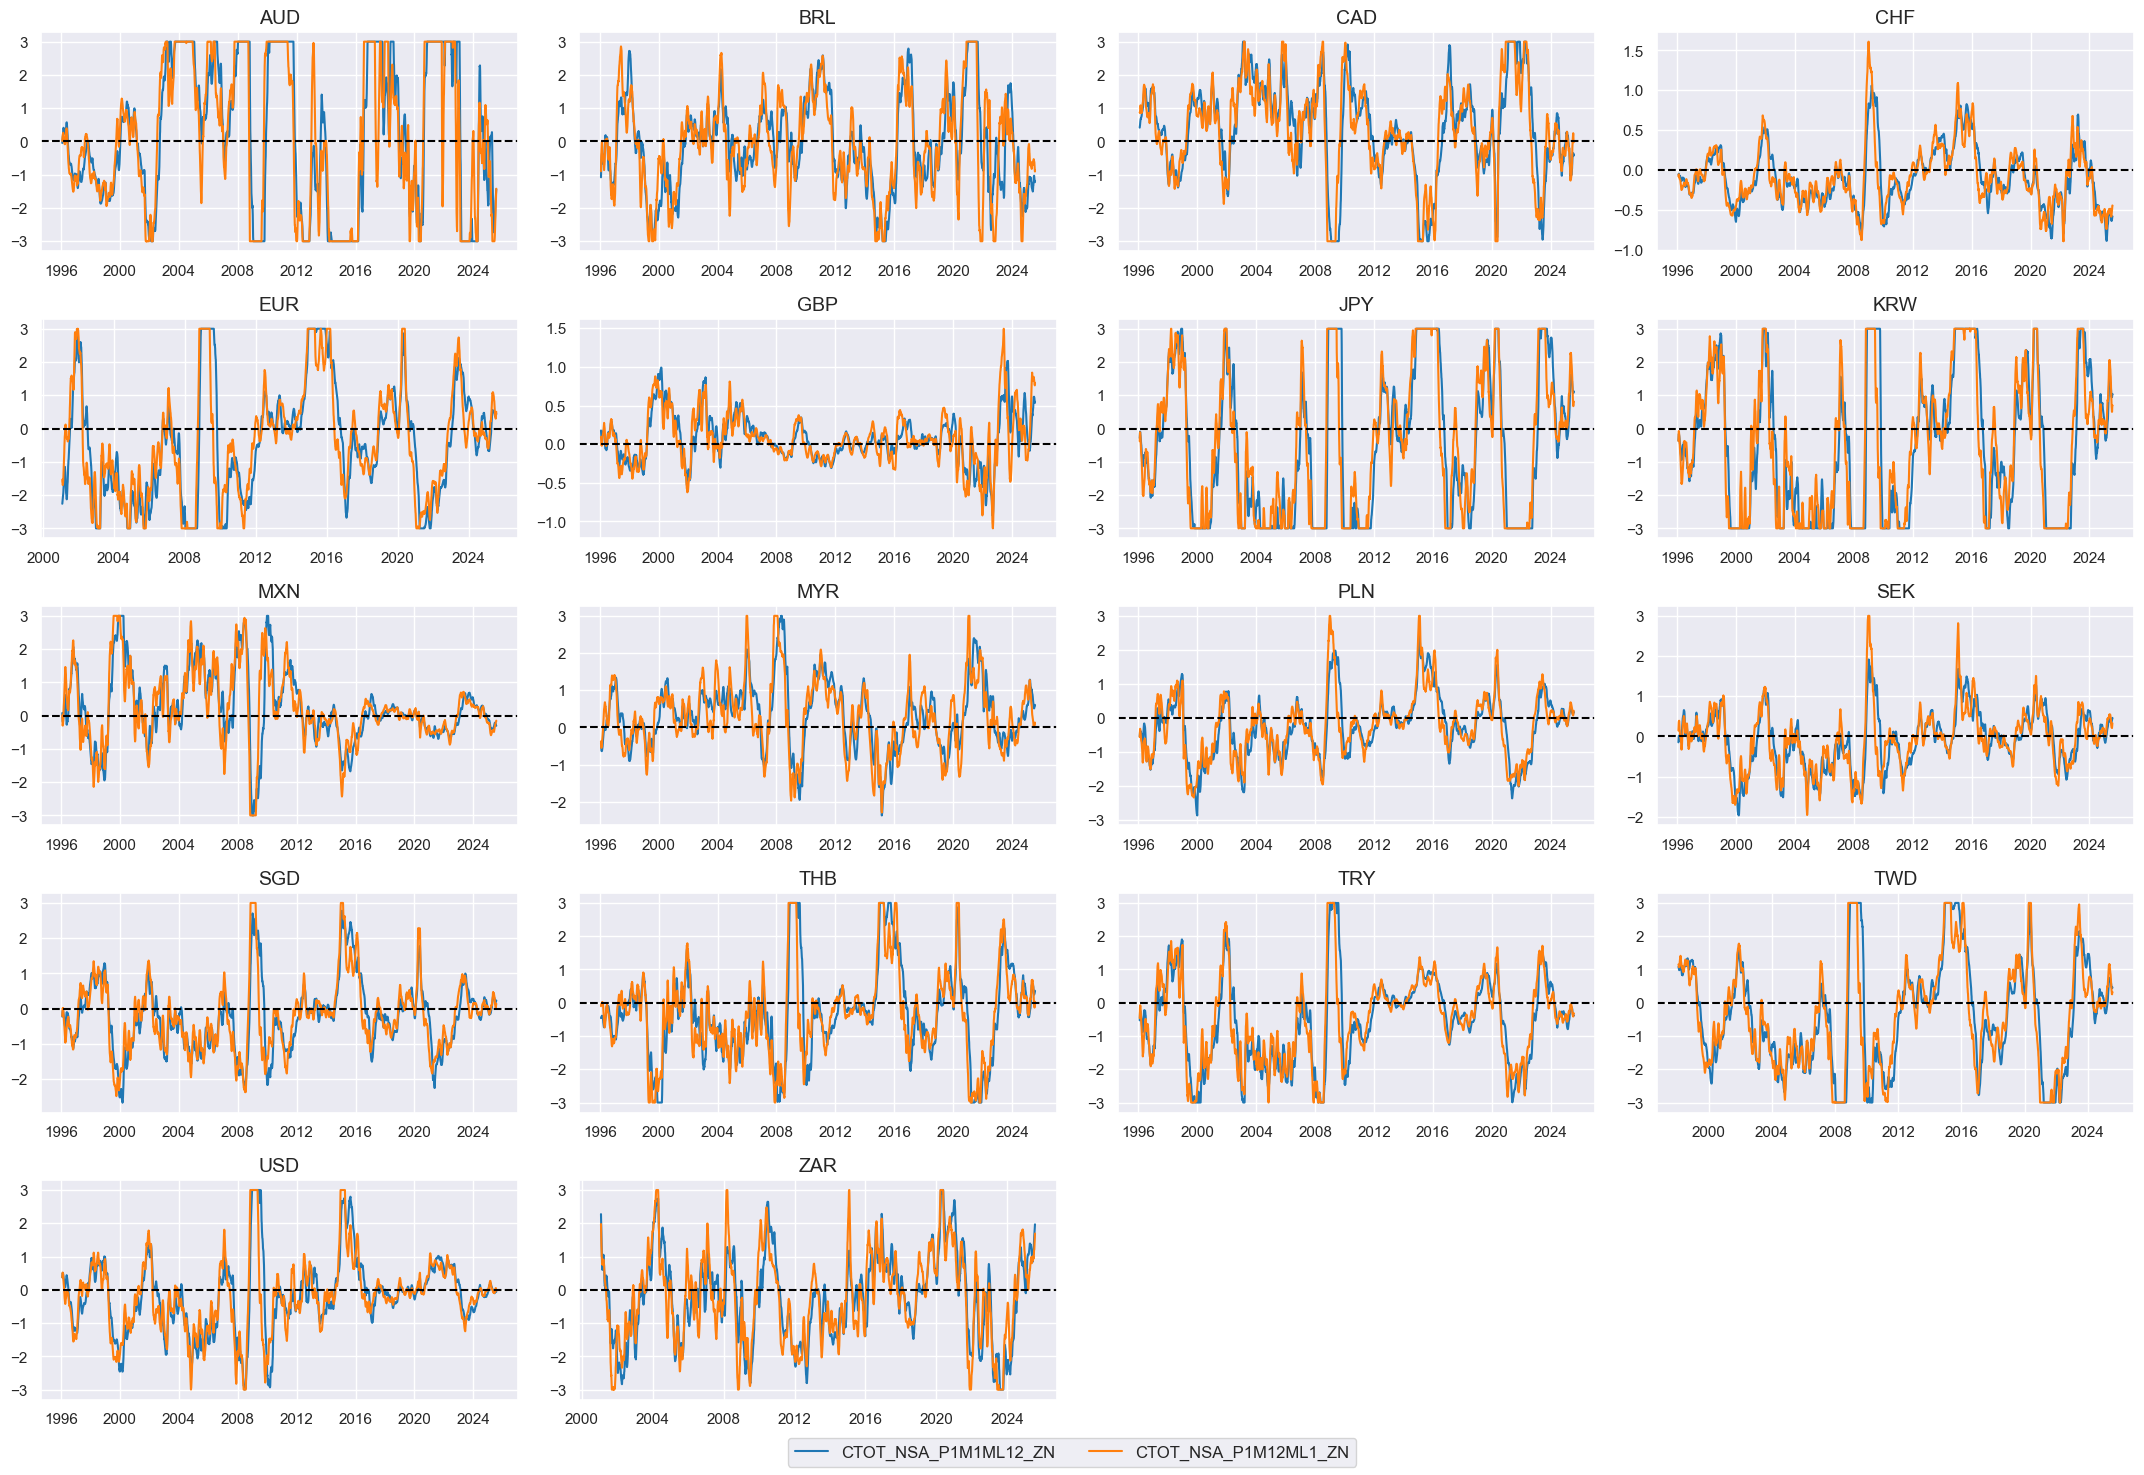
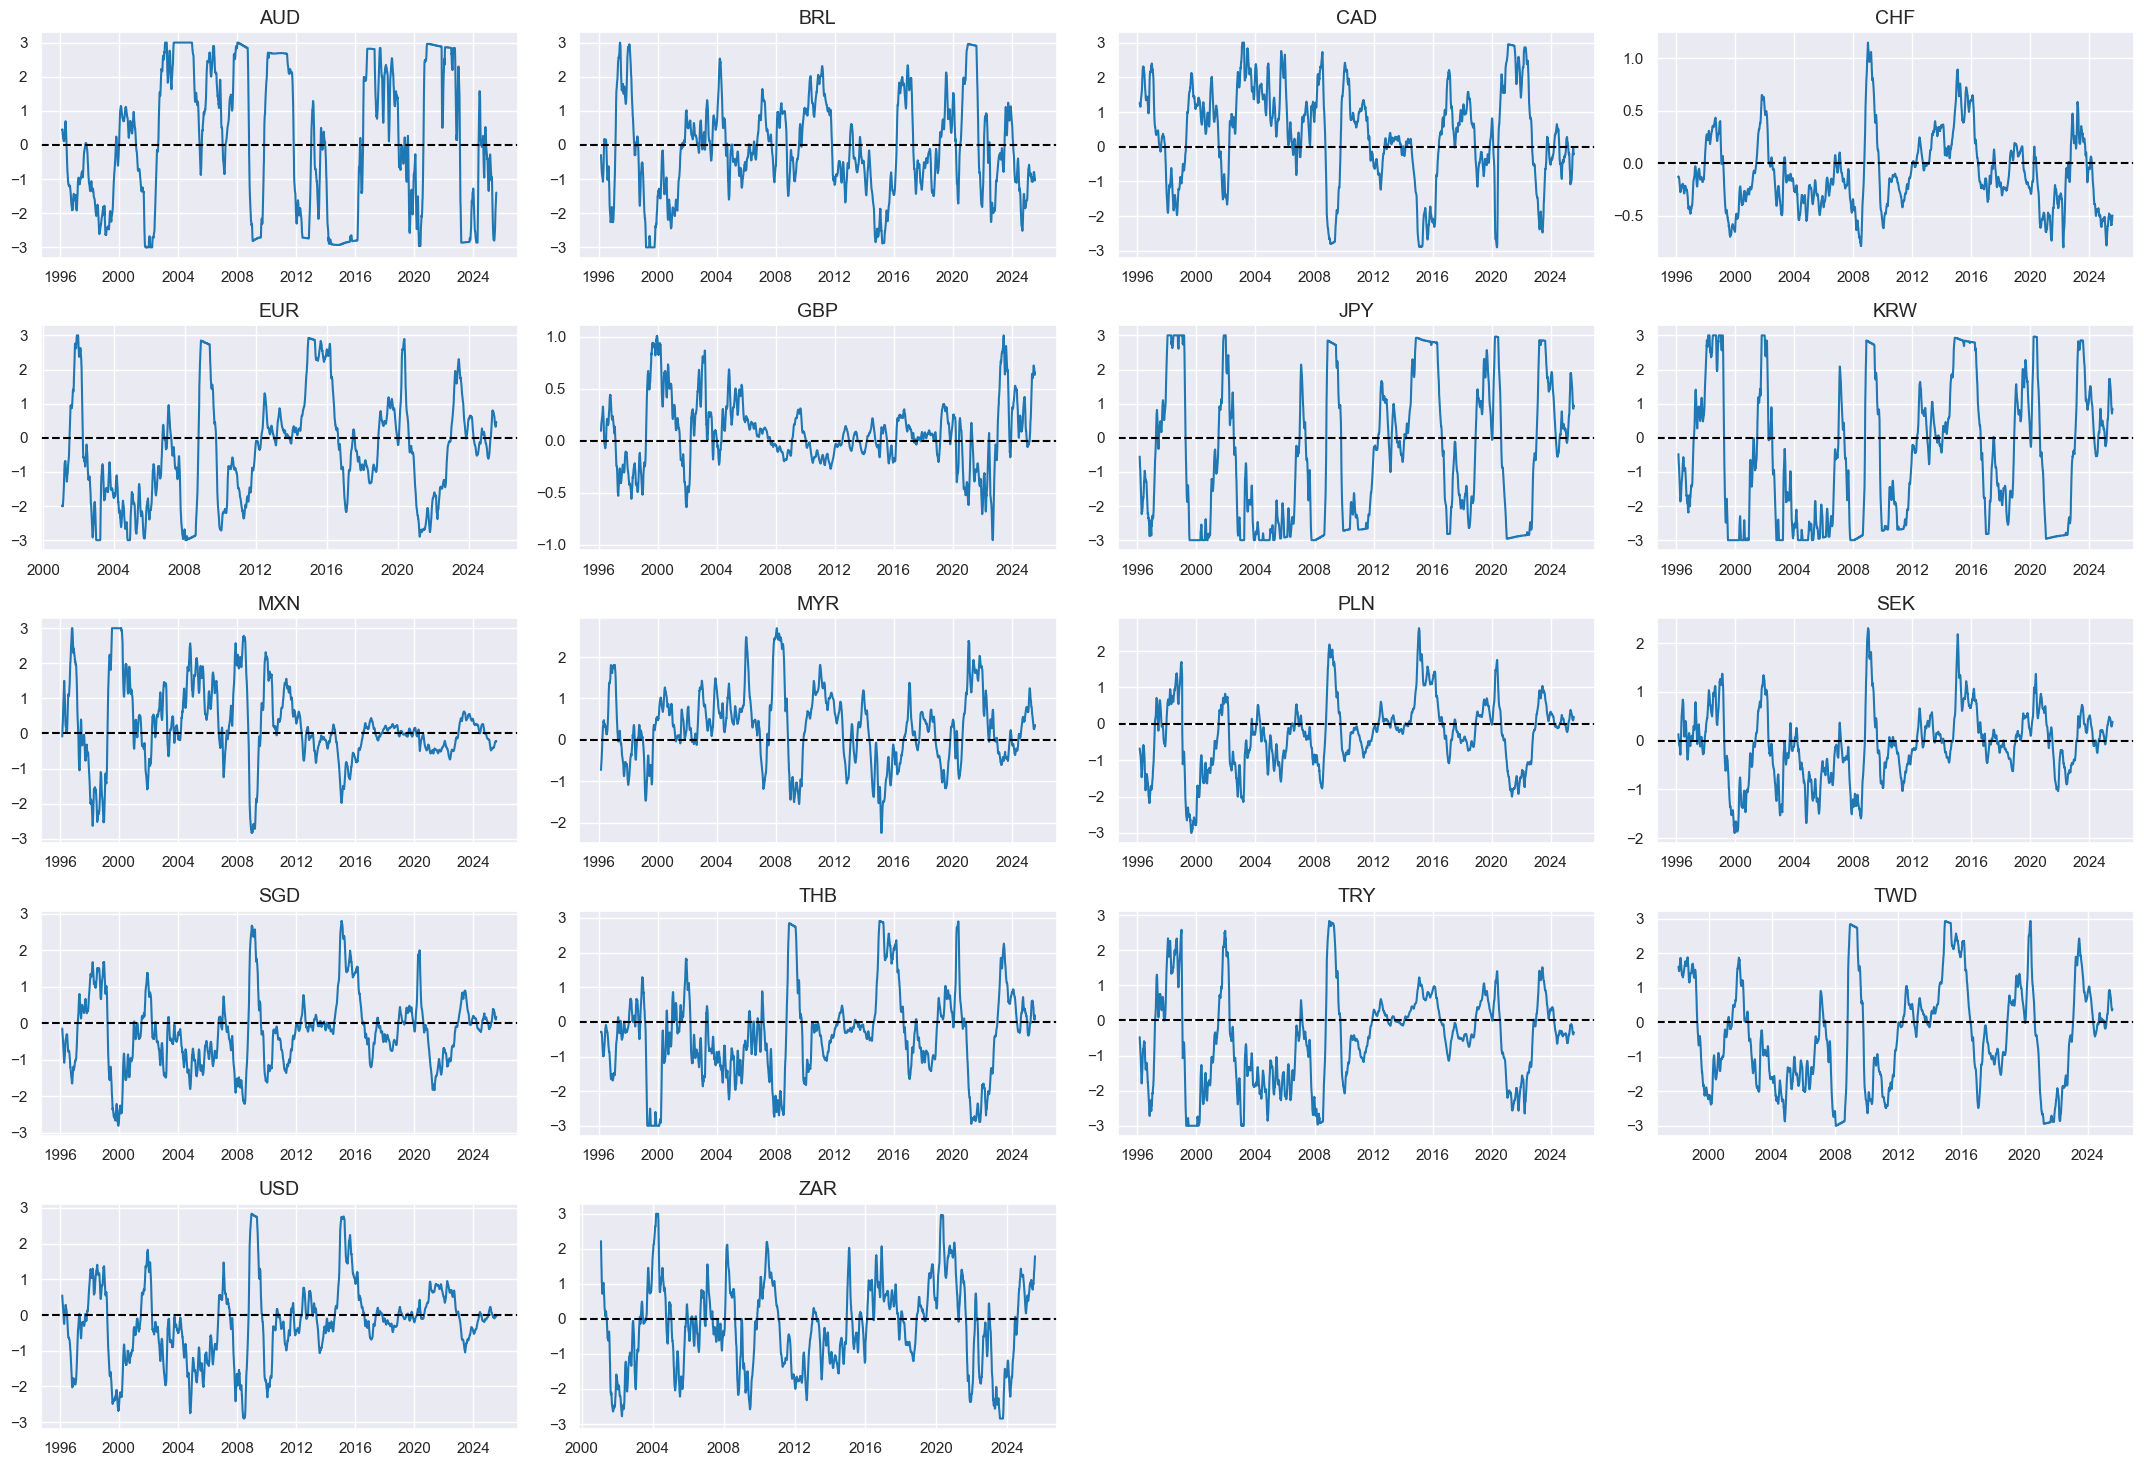
Terms of trade improvement #
Specs #
# Un-scored indicators and weights

dict_tot = {
    "CTOT_NSA_P1M1ML12": (1/2, 1),
    "CTOT_NSA_P1M12ML1": (1/2, 1),
}
Constituent scores #
# Panel-based normalization

cidx = cids_eq
xcatx = [xcat for xcat in list(dict_tot.keys())]
sdate = "1990-01-01"

for xc in xcatx:
    dfaa = msp.make_zn_scores(
        dfx,
        xcat=xc,
        cids=cidx,
        sequential=True,
        min_obs=261 * 5,
        neutral="zero",
        pan_weight=1,
        thresh=3,
        postfix="_ZN",
        est_freq="m",
    )
    dfa = msm.update_df(dfa, dfaa)

dfx = msm.update_df(dfx, dfa)
totz = [xcat + "_ZN" for xcat in xcatx]
cidx = cids_eq
xcatx = totz

msp.view_timelines(
    dfx,
    xcats=xcatx,
    cids=cidx,
    ncol=4,
    same_y=False,
    all_xticks=True,
    aspect=1.8,
    height=2,
)
Composite scores #
# Weighted linear combination

cidx = cids_eq
dix = dict_tot

xcatx = [k + "_ZN" for k in list(dix.keys())]
weights = [v[0] for v in list(dix.values())]
signs = [v[1] for v in list(dix.values())]
czs = "TOT"

dfa = msp.linear_composite(
    dfx,
    xcats=xcatx,
    cids=cidx,
    weights=weights,
    signs=signs,
    normalize_weights=True,
    complete_xcats=False,  # score works with what is available
    new_xcat=czs,
)
dfx = msm.update_df(dfx, dfa)

# Re-scoring

dfa = msp.make_zn_scores(
    dfx,
    xcat=czs,
    cids=cidx,
    sequential=True,
    min_obs=261 * 3,
    neutral="zero",
    pan_weight=1,
    thresh=3,
    postfix="_ZN",
    est_freq="m",
)
dfx = msm.update_df(dfx, dfa)

dict_facts[czs + "_ZN"] = "Terms-of-trade improvement"
cidx = cids_eq
xcatx = ["TOT_ZN"]

msp.view_timelines(
    dfx,
    xcats=xcatx,
    cids=cidx,
    ncol=4,
    same_y=False,
    all_xticks=True,
    aspect=1.8,
    height=2,
)
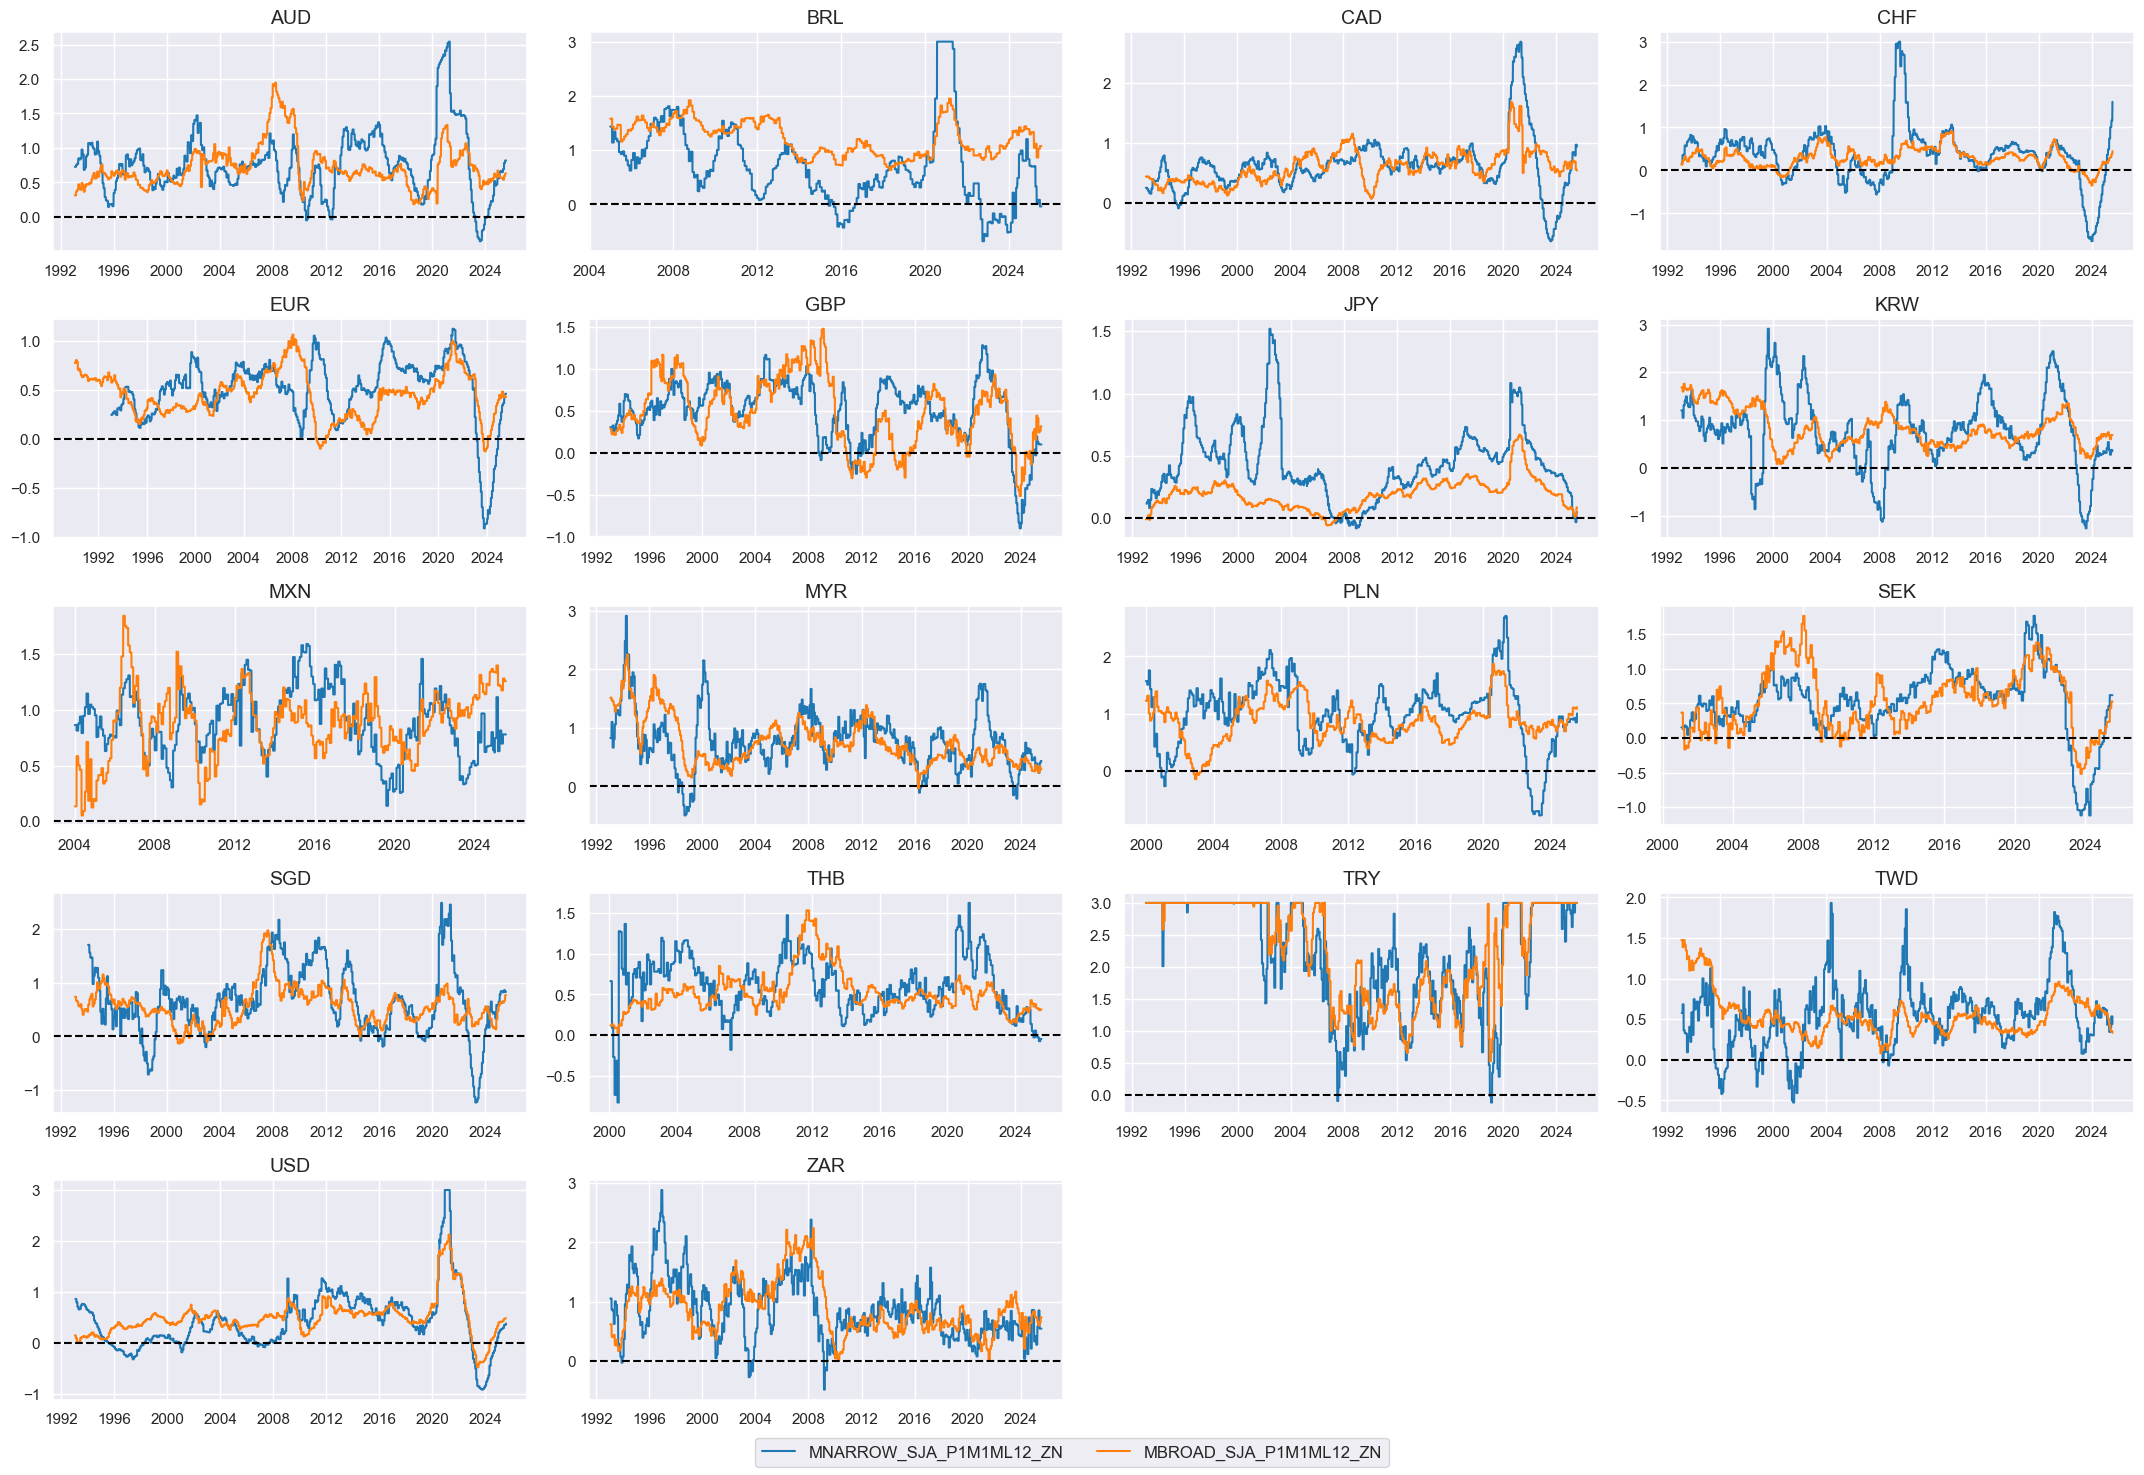
Excess money growth #
Specs #
# Un-scored indicators and weights

dict_mon = {
    "MNARROW_SJA_P1M1ML12": (1/2, 1),
    "MBROAD_SJA_P1M1ML12": (1/2, 1),
}
Constituent scores #
# Excess money growth

xcatx = list(dict_mon.keys())
cidx = cids_eq

calcs = [
    f"X{xcat} = {xcat} - ( RGDP_SA_P1Q1QL4_20QMM + INFTEFF_NSA )"
    for xcat in xcatx
]

dfa = msp.panel_calculator(
    df=dfx,
    calcs=calcs,
    cids=cidx,
)
dfx = msm.update_df(dfx, dfa)
# Panel-based normalization

cidx = cids_eq
xcatx = [xcat for xcat in list(dict_mon.keys())]
sdate = "1990-01-01"

for xc in xcatx:
    dfaa = msp.make_zn_scores(
        dfx,
        xcat=xc,
        cids=cidx,
        sequential=True,
        min_obs=261 * 5,
        neutral="zero",
        pan_weight=1,
        thresh=3,
        postfix="_ZN",
        est_freq="m",
    )
    dfa = msm.update_df(dfa, dfaa)

dfx = msm.update_df(dfx, dfa)
monz = [xcat + "_ZN" for xcat in xcatx]
cidx = cids_eq
xcatx = monz

msp.view_timelines(
    dfx,
    xcats=xcatx,
    cids=cidx,
    ncol=4,
    same_y=False,
    all_xticks=True,
    aspect=1.8,
    height=2,
)
Composite scores #
# Weighted linear combination

cidx = cids_eq
dix = dict_mon

xcatx = [k + "_ZN" for k in list(dix.keys())]
weights = [v[0] for v in list(dix.values())]
signs = [v[1] for v in list(dix.values())]
czs = "MONEY"

dfa = msp.linear_composite(
    dfx,
    xcats=xcatx,
    cids=cidx,
    weights=weights,
    signs=signs,
    normalize_weights=True,
    complete_xcats=False,  # score works with what is available
    new_xcat=czs,
)
dfx = msm.update_df(dfx, dfa)

# Re-scoring

dfa = msp.make_zn_scores(
    dfx,
    xcat=czs,
    cids=cidx,
    sequential=True,
    min_obs=261 * 3,
    neutral="zero",
    pan_weight=1,
    thresh=3,
    postfix="_ZN",
    est_freq="m",
)
dfx = msm.update_df(dfx, dfa)

dict_facts[czs + "_ZN"] = "Excess money growth"
cidx = cids_eq
xcatx = ["MONEY_ZN"]

msp.view_timelines(
    dfx,
    xcats=xcatx,
    cids=cidx,
    ncol=4,
    same_y=False,
    all_xticks=True,
    aspect=1.8,
    height=2,
)
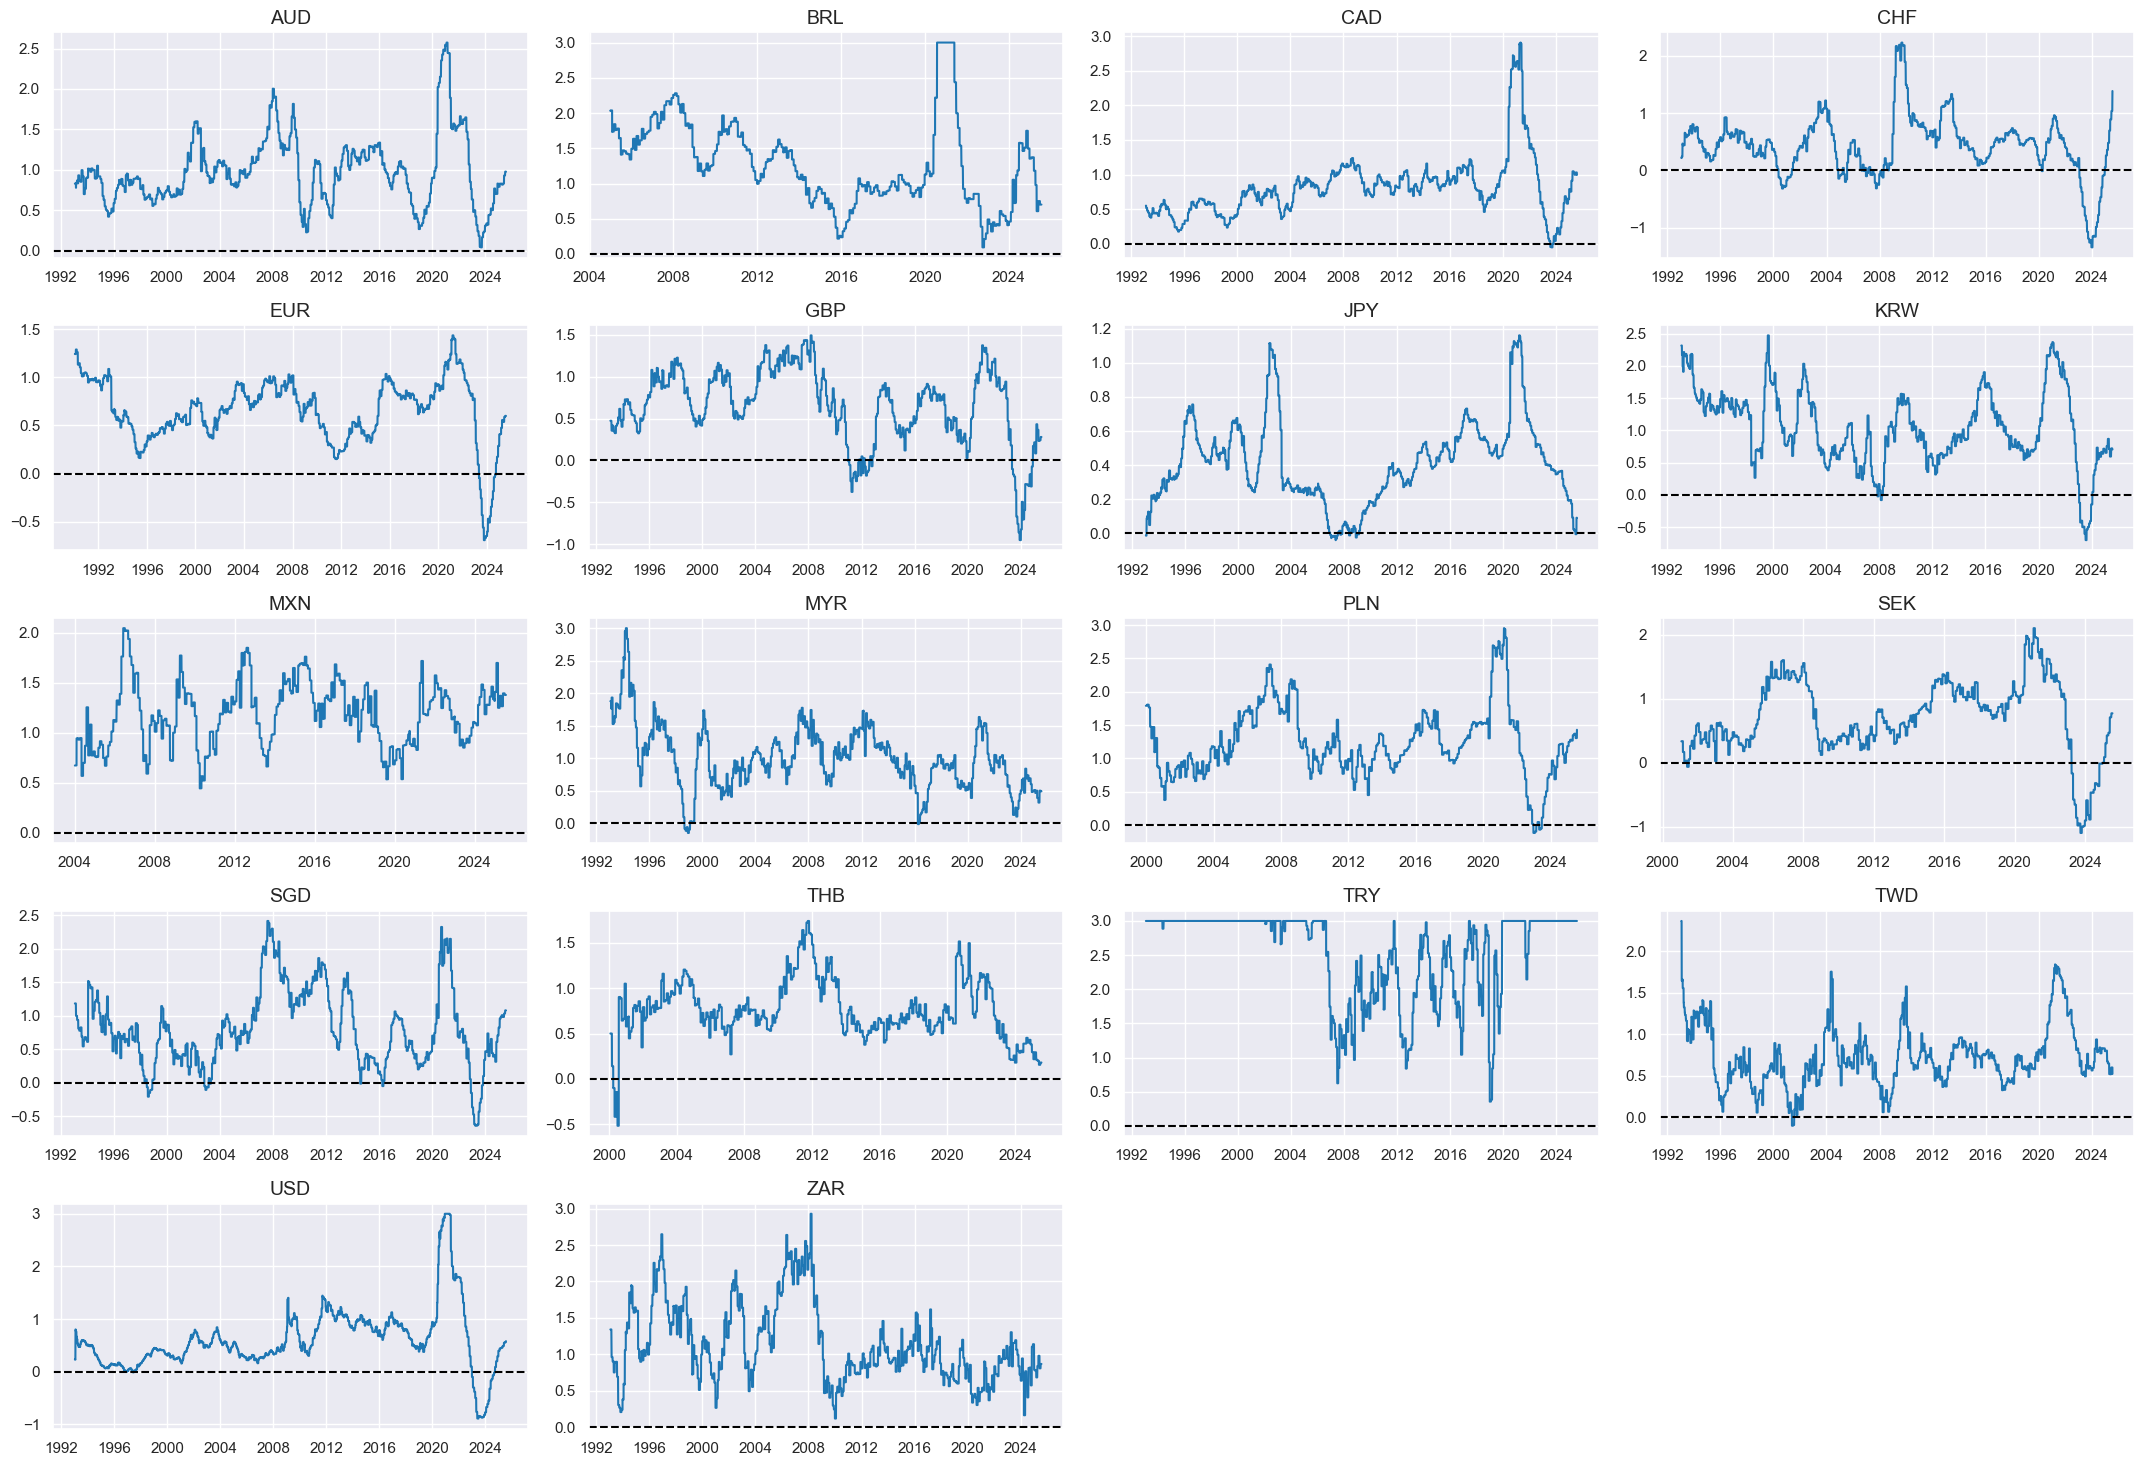
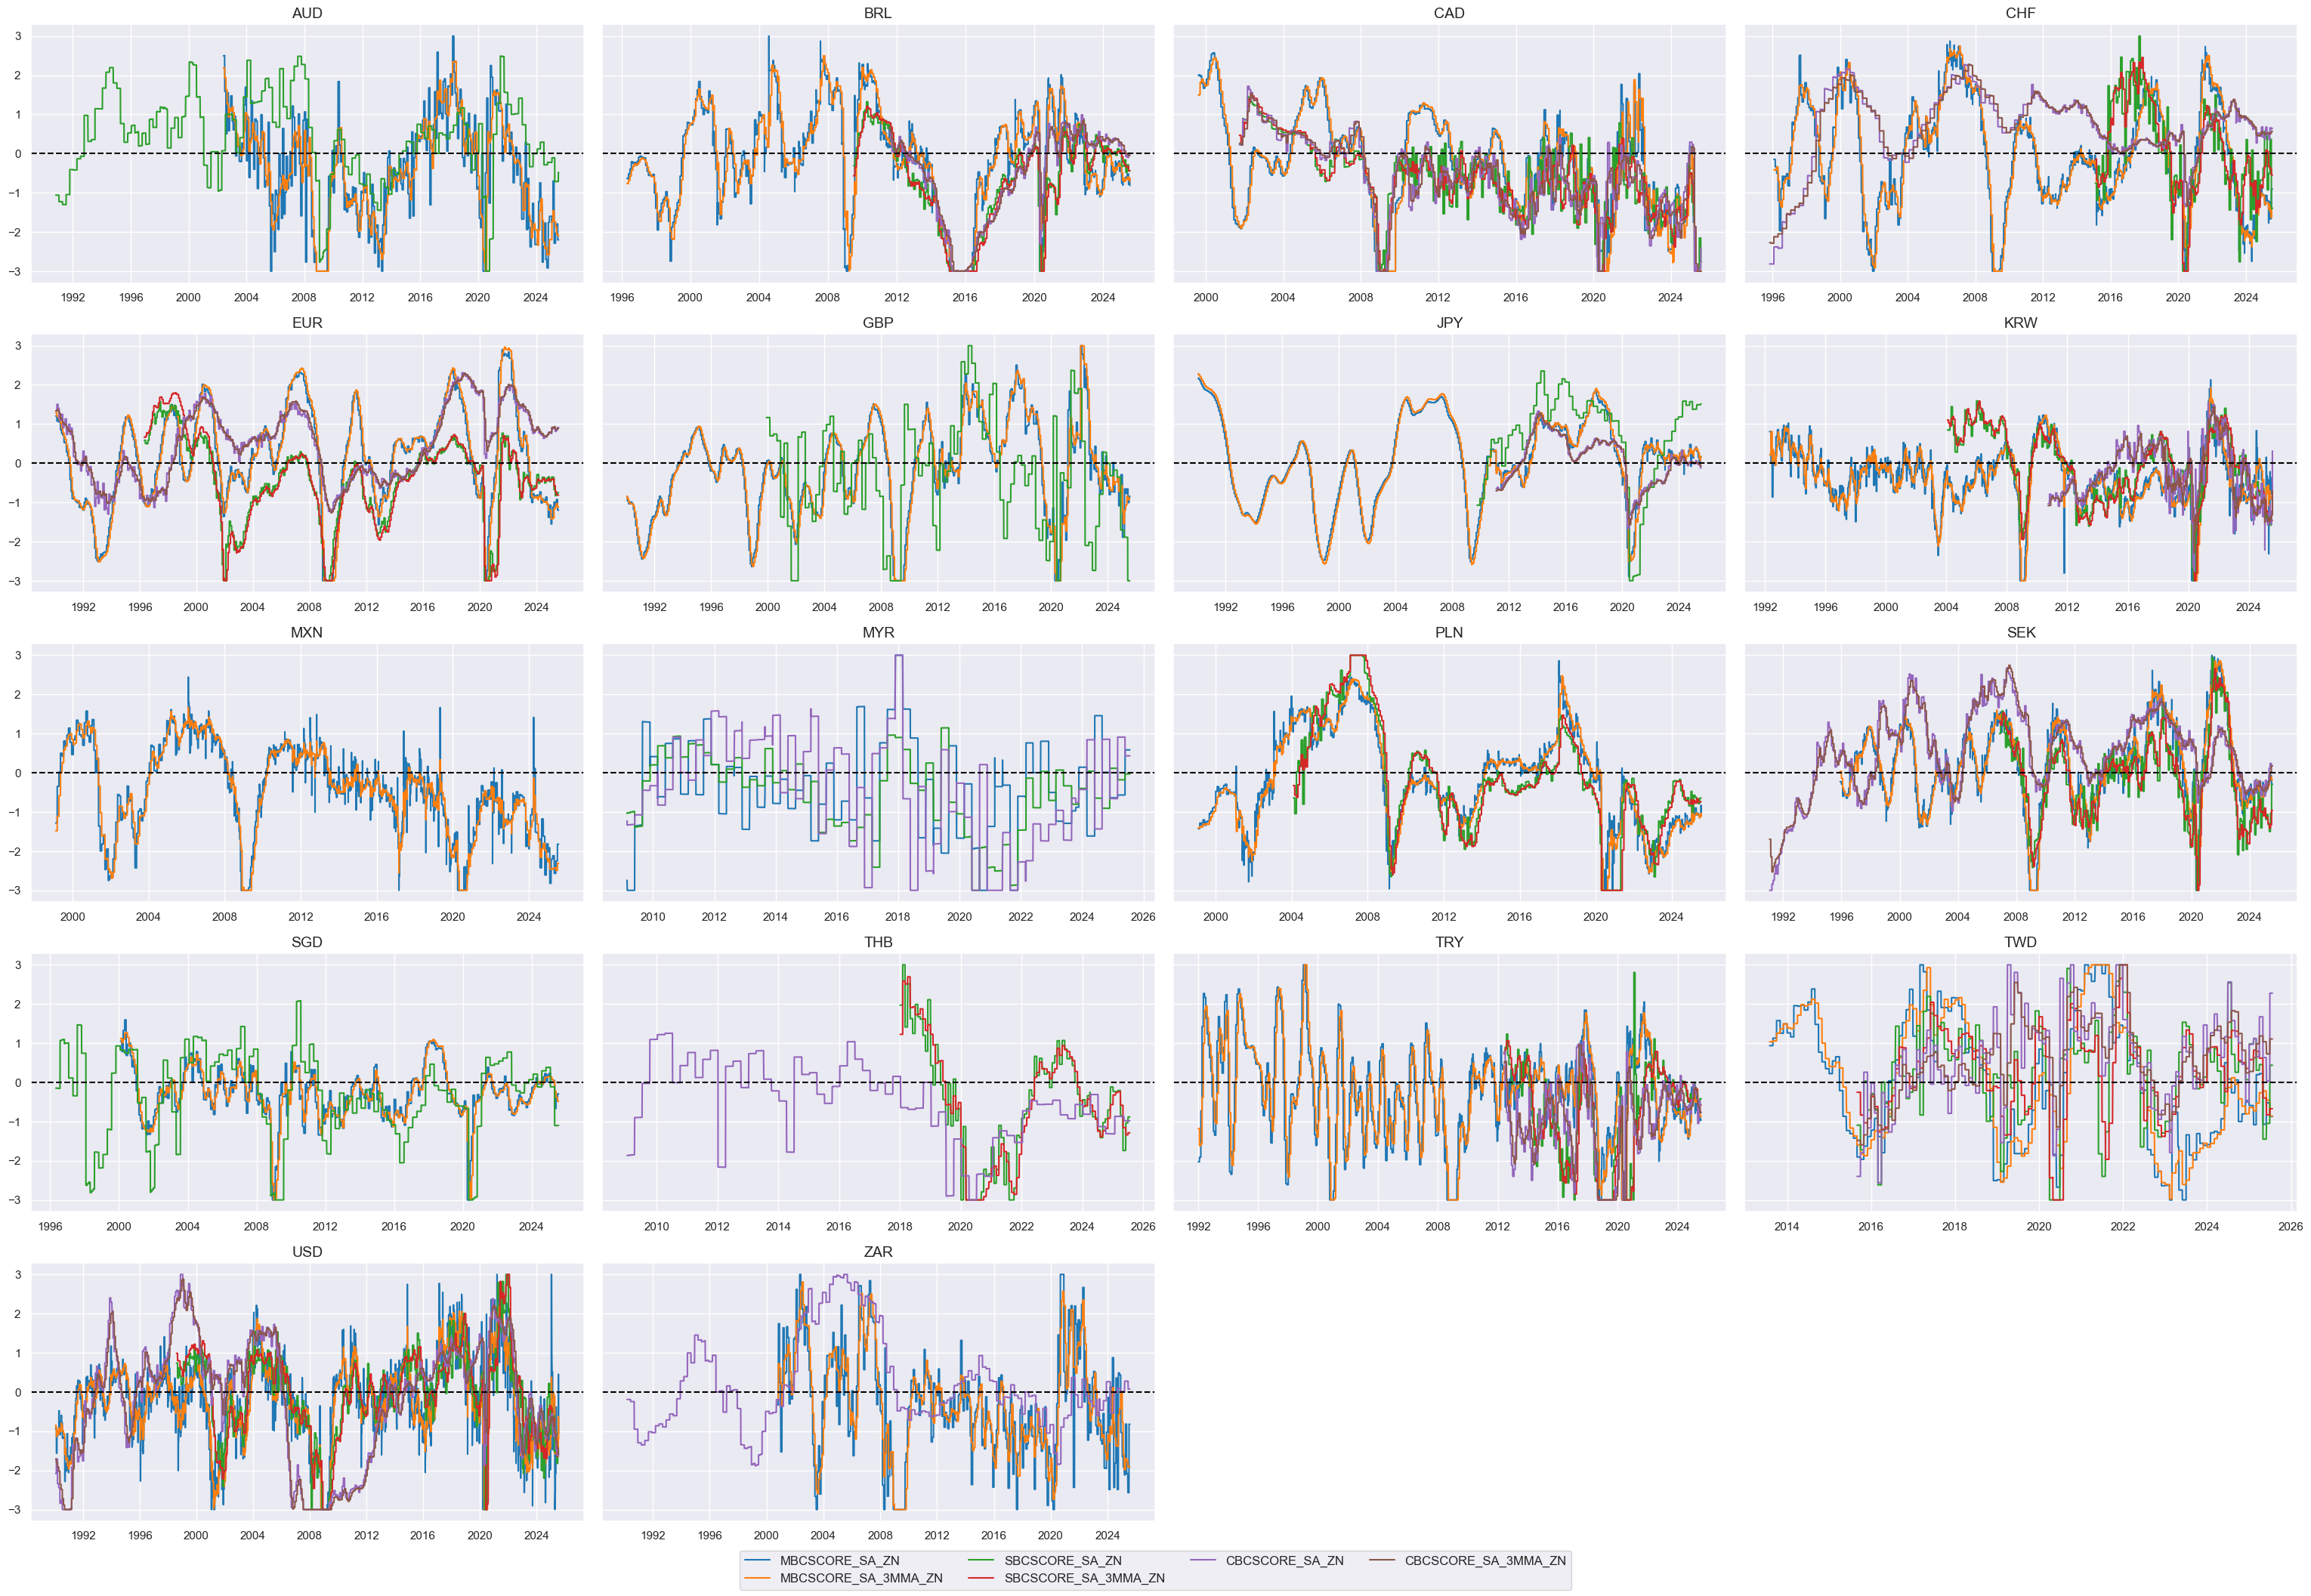
Business gloom #
Specs #
# Un-scored indicators and weights

dict_bsurv = {
    "MBCSCORE_SA": (4/18, -1),
    "MBCSCORE_SA_3MMA": (4/18, -1),
    "SBCSCORE_SA": (4/18, -1),
    "SBCSCORE_SA_3MMA": (4/18, -1),
    "CBCSCORE_SA": (1/18, -1),
    "CBCSCORE_SA_3MMA": (1/18, -1),
}
Constituent scores #
# Panel-based normalization

cidx = cids_eq
xcatx = [xcat for xcat in list(dict_bsurv.keys())]
sdate = "1990-01-01"

for xc in xcatx:
    dfaa = msp.make_zn_scores(
        dfx,
        xcat=xc,
        cids=cidx,
        sequential=True,
        min_obs=261 * 5,
        neutral="zero",
        pan_weight=1,
        thresh=3,
        postfix="_ZN",
        est_freq="m",
    )
    dfa = msm.update_df(dfa, dfaa)

dfx = msm.update_df(dfx, dfa)
busz = [xcat + "_ZN" for xcat in xcatx]
cidx = cids_eq
xcatx = busz

msp.view_timelines(
    dfx,
    xcats=xcatx,
    cids=cidx,
    ncol=4,
    same_y=True,
    all_xticks=True,
    size=(12, 7),
    aspect=1.8
)
Composite scores #
# Weighted linear combination

cidx = cids_eq
dix = dict_bsurv

xcatx = [k + "_ZN" for k in list(dix.keys())]
weights = [v[0] for v in list(dix.values())]
signs = [v[1] for v in list(dix.values())]
czs = "BSURV_NEG"

dfa = msp.linear_composite(
    dfx,
    xcats=xcatx,
    cids=cidx,
    weights=weights,
    signs=signs,
    normalize_weights=True,
    complete_xcats=False,  # score works with what is available
    new_xcat=czs,
)
dfx = msm.update_df(dfx, dfa)

# Re-scoring

dfa = msp.make_zn_scores(
    dfx,
    xcat=czs,
    cids=cidx,
    sequential=True,
    min_obs=261 * 3,
    neutral="zero",
    pan_weight=1,
    thresh=3,
    postfix="_ZN",
    est_freq="m",
)
dfx = msm.update_df(dfx, dfa)

dict_facts[czs + "_ZN"] = "Business gloom"
cidx = cids_eq
xcatx = ["BSURV_NEG_ZN"]

msp.view_timelines(
    dfx,
    xcats=xcatx,
    cids=cidx,
    ncol=4,
    same_y=False,
    all_xticks=True,
    aspect=1.8,
    height=2,
)
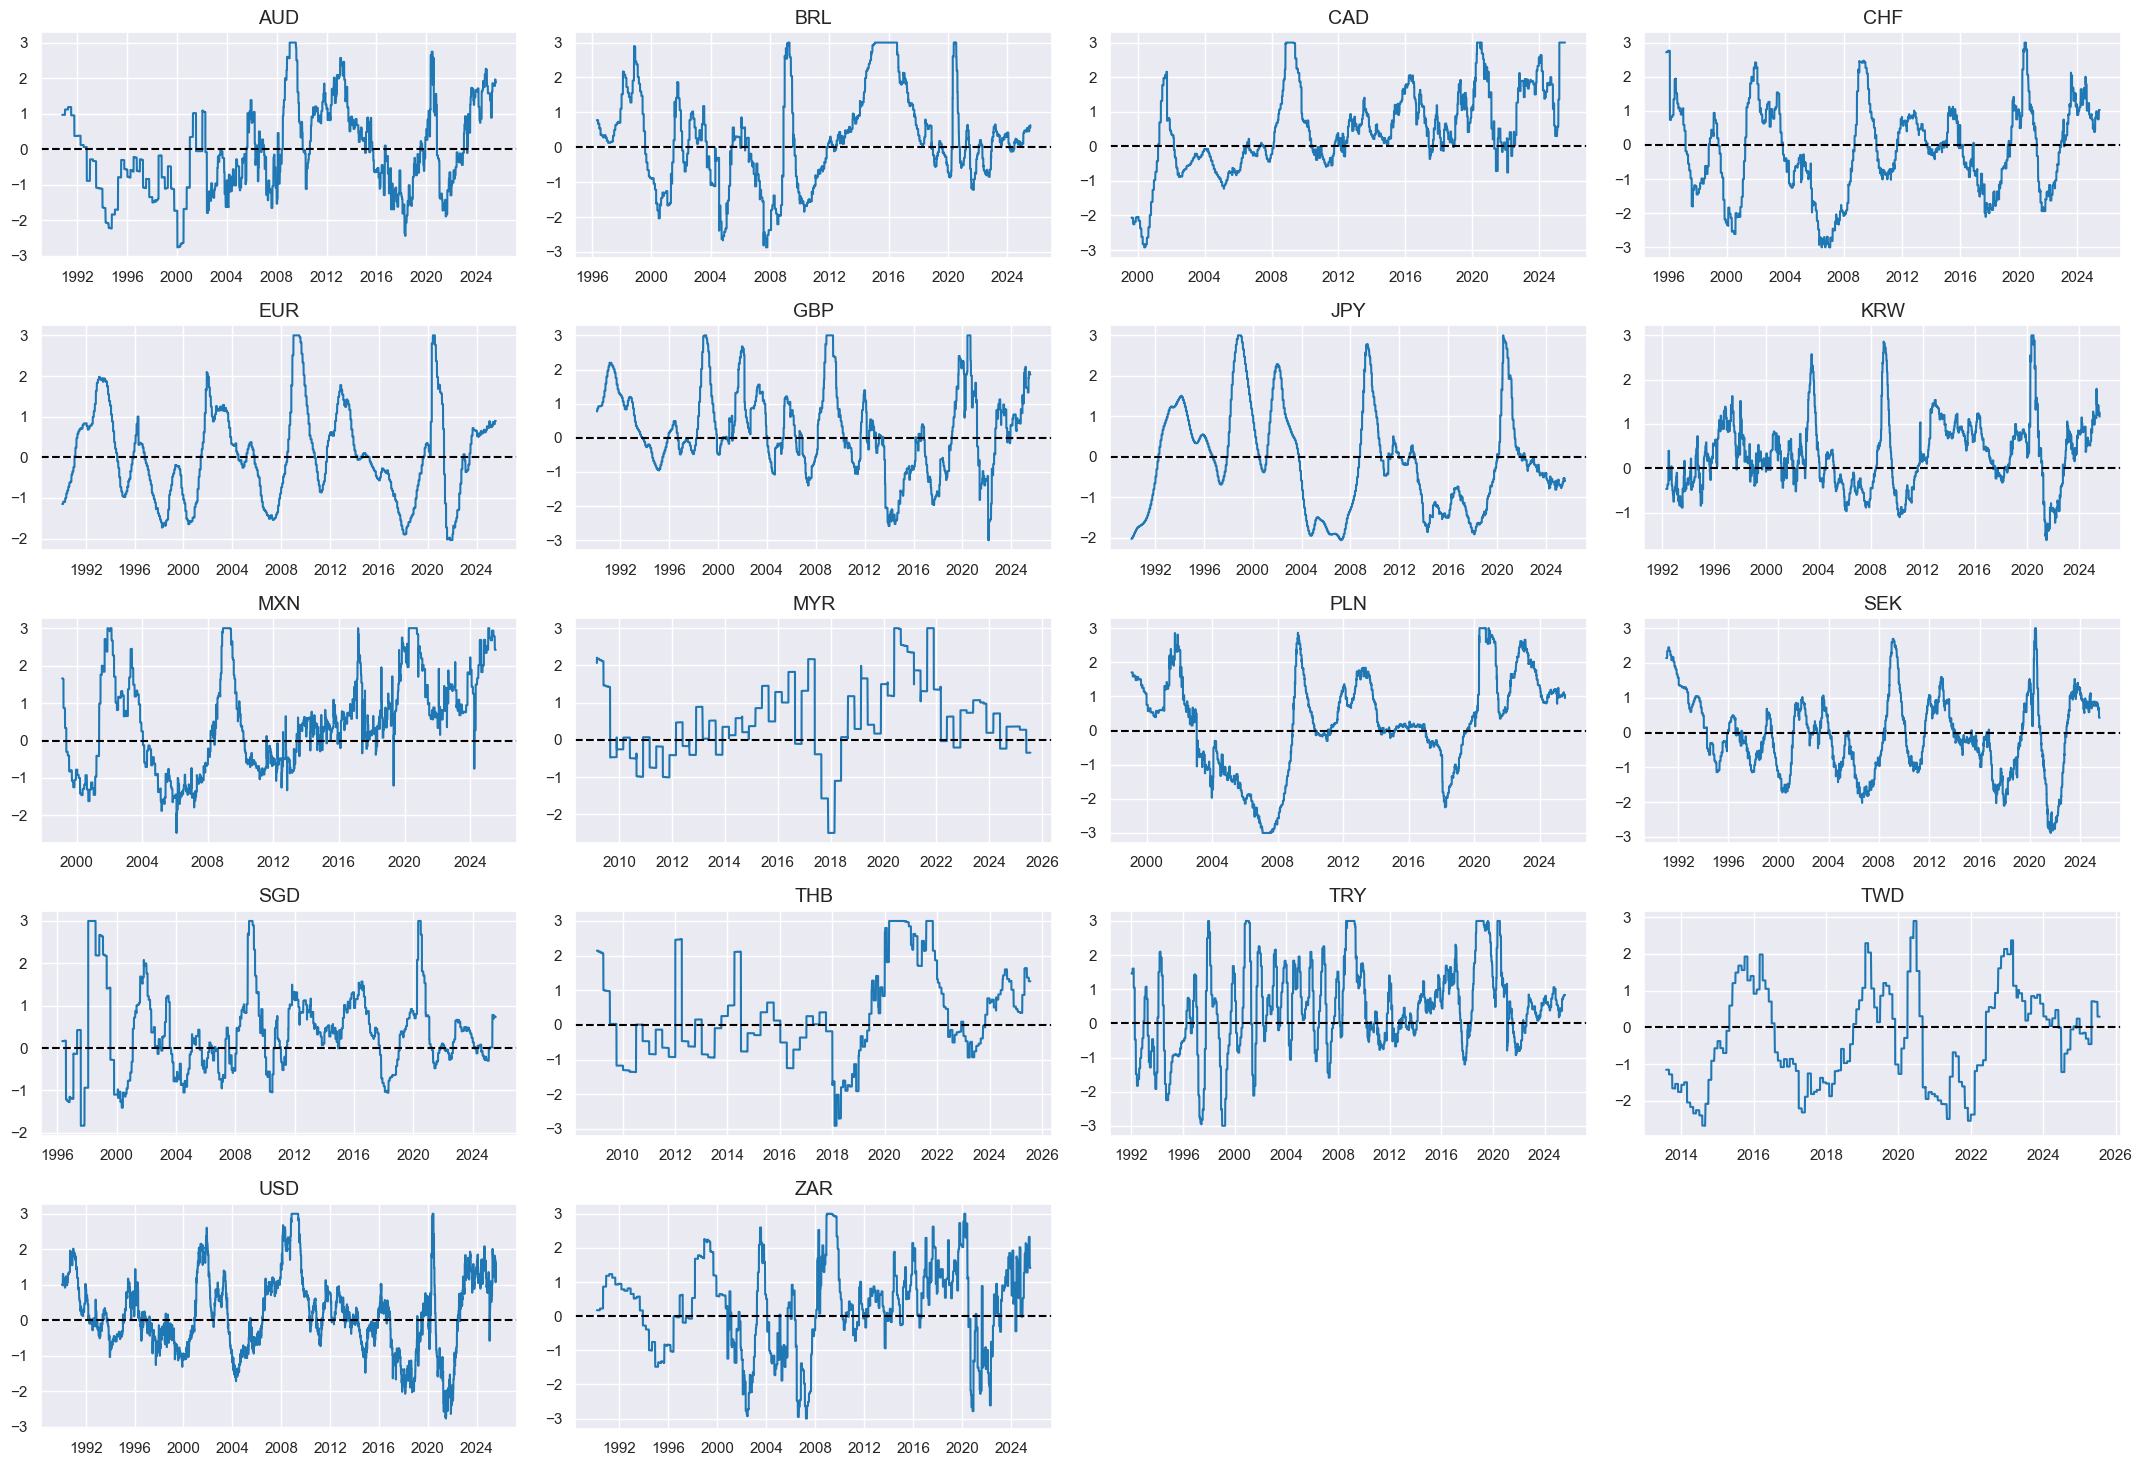
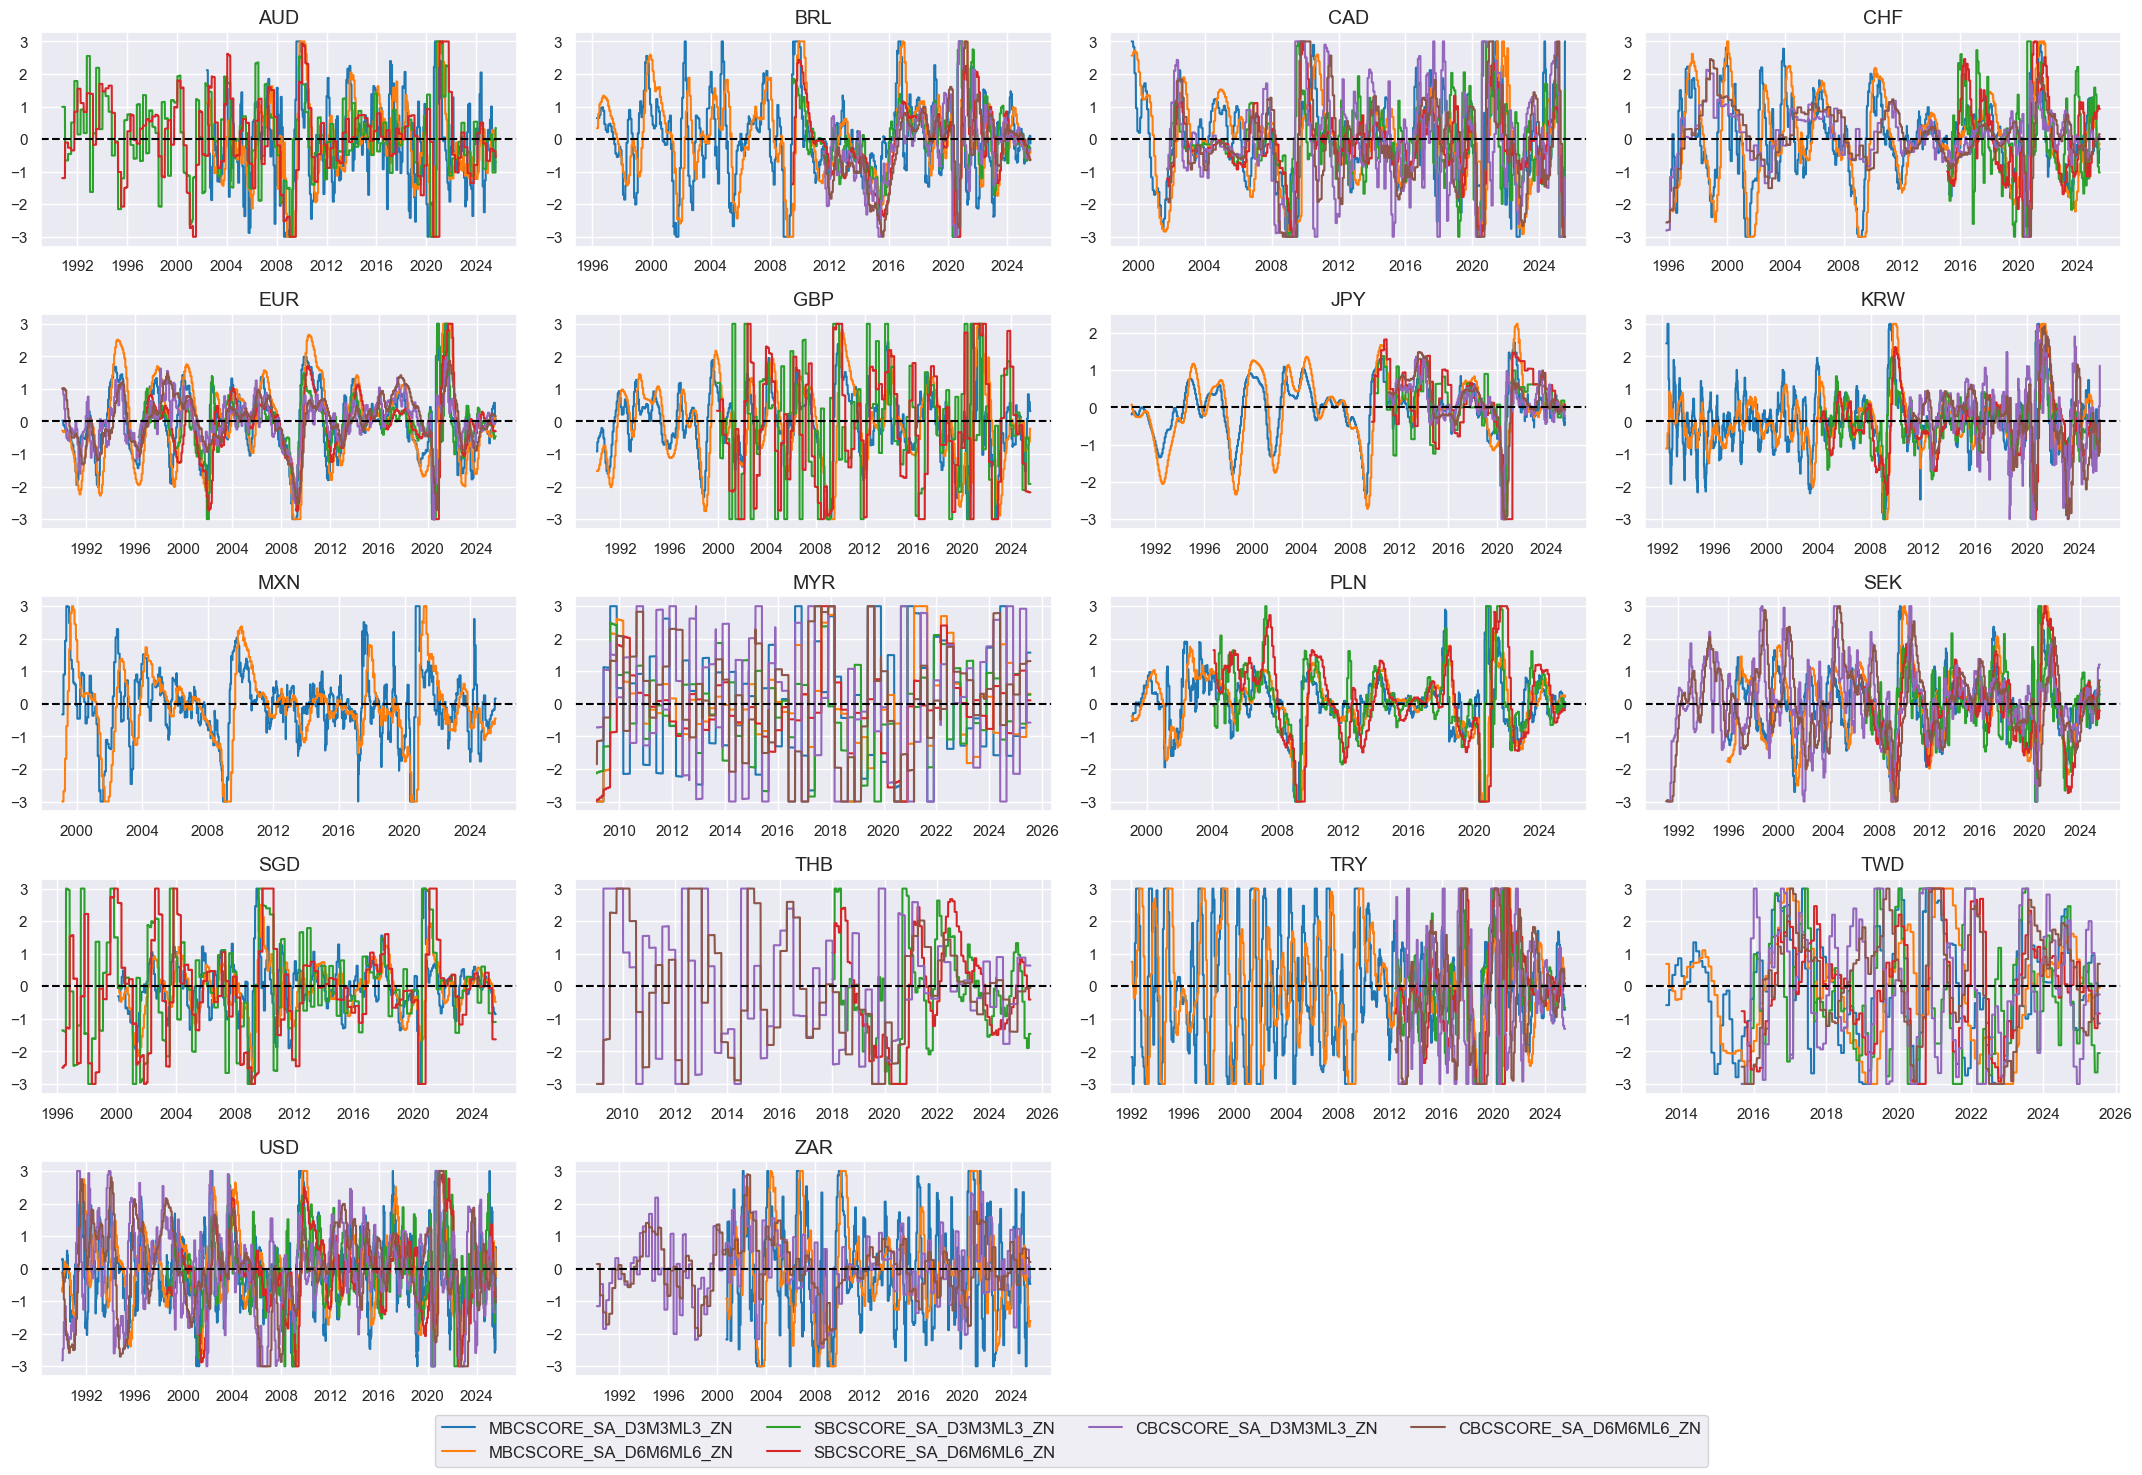
Business sentiment change #
Specs #
# Un-scored indicators and weights

dict_bsurv_chg = {
    "MBCSCORE_SA_D3M3ML3": (4/18, 1),
    "MBCSCORE_SA_D6M6ML6": (4/18, 1),
    "SBCSCORE_SA_D3M3ML3": (4/18, 1),
    "SBCSCORE_SA_D6M6ML6": (4/18, 1),
    "CBCSCORE_SA_D3M3ML3": (1/18, 1),
    "CBCSCORE_SA_D6M6ML6": (1/18, 1),
}
Constituent scores #
# Panel-based normalization

cidx = cids_eq
xcatx = [xcat for xcat in list(dict_bsurv_chg.keys())]
sdate = "1990-01-01"

for xc in xcatx:
    dfaa = msp.make_zn_scores(
        dfx,
        xcat=xc,
        cids=cidx,
        sequential=True,
        min_obs=261 * 5,
        neutral="zero",
        pan_weight=1,
        thresh=3,
        postfix="_ZN",
        est_freq="m",
    )
    dfa = msm.update_df(dfa, dfaa)

dfx = msm.update_df(dfx, dfa)
buschgz = [xcat + "_ZN" for xcat in xcatx]
cidx = cids_eq
xcatx = buschgz

msp.view_timelines(
    dfx,
    xcats=xcatx,
    cids=cidx,
    ncol=4,
    same_y=False,
    all_xticks=True,
    aspect=1.8,
    height=2,
)
Composite scores #
# Weighted linear combination
cidx = cids_eq
dix = dict_bsurv_chg
xcatx = [k + "_ZN" for k in list(dix.keys())]
weights = [v[0] for v in list(dix.values())]
signs = [v[1] for v in list(dix.values())]
czs = "BSURV_CHG"
dfa = msp.linear_composite(
dfx,
xcats=xcatx,
cids=cidx,
weights=weights,
signs=signs,
normalize_weights=True,
complete_xcats=False, # score works with what is available
new_xcat=czs,
)
dfx = msm.update_df(dfx, dfa)
# Re-scoring
dfa = msp.make_zn_scores(
dfx,
xcat=czs,
cids=cidx,
sequential=True,
min_obs=261 * 3,
neutral="zero",
pan_weight=1,
thresh=3,
postfix="_ZN",
est_freq="m",
)
dfx = msm.update_df(dfx, dfa)
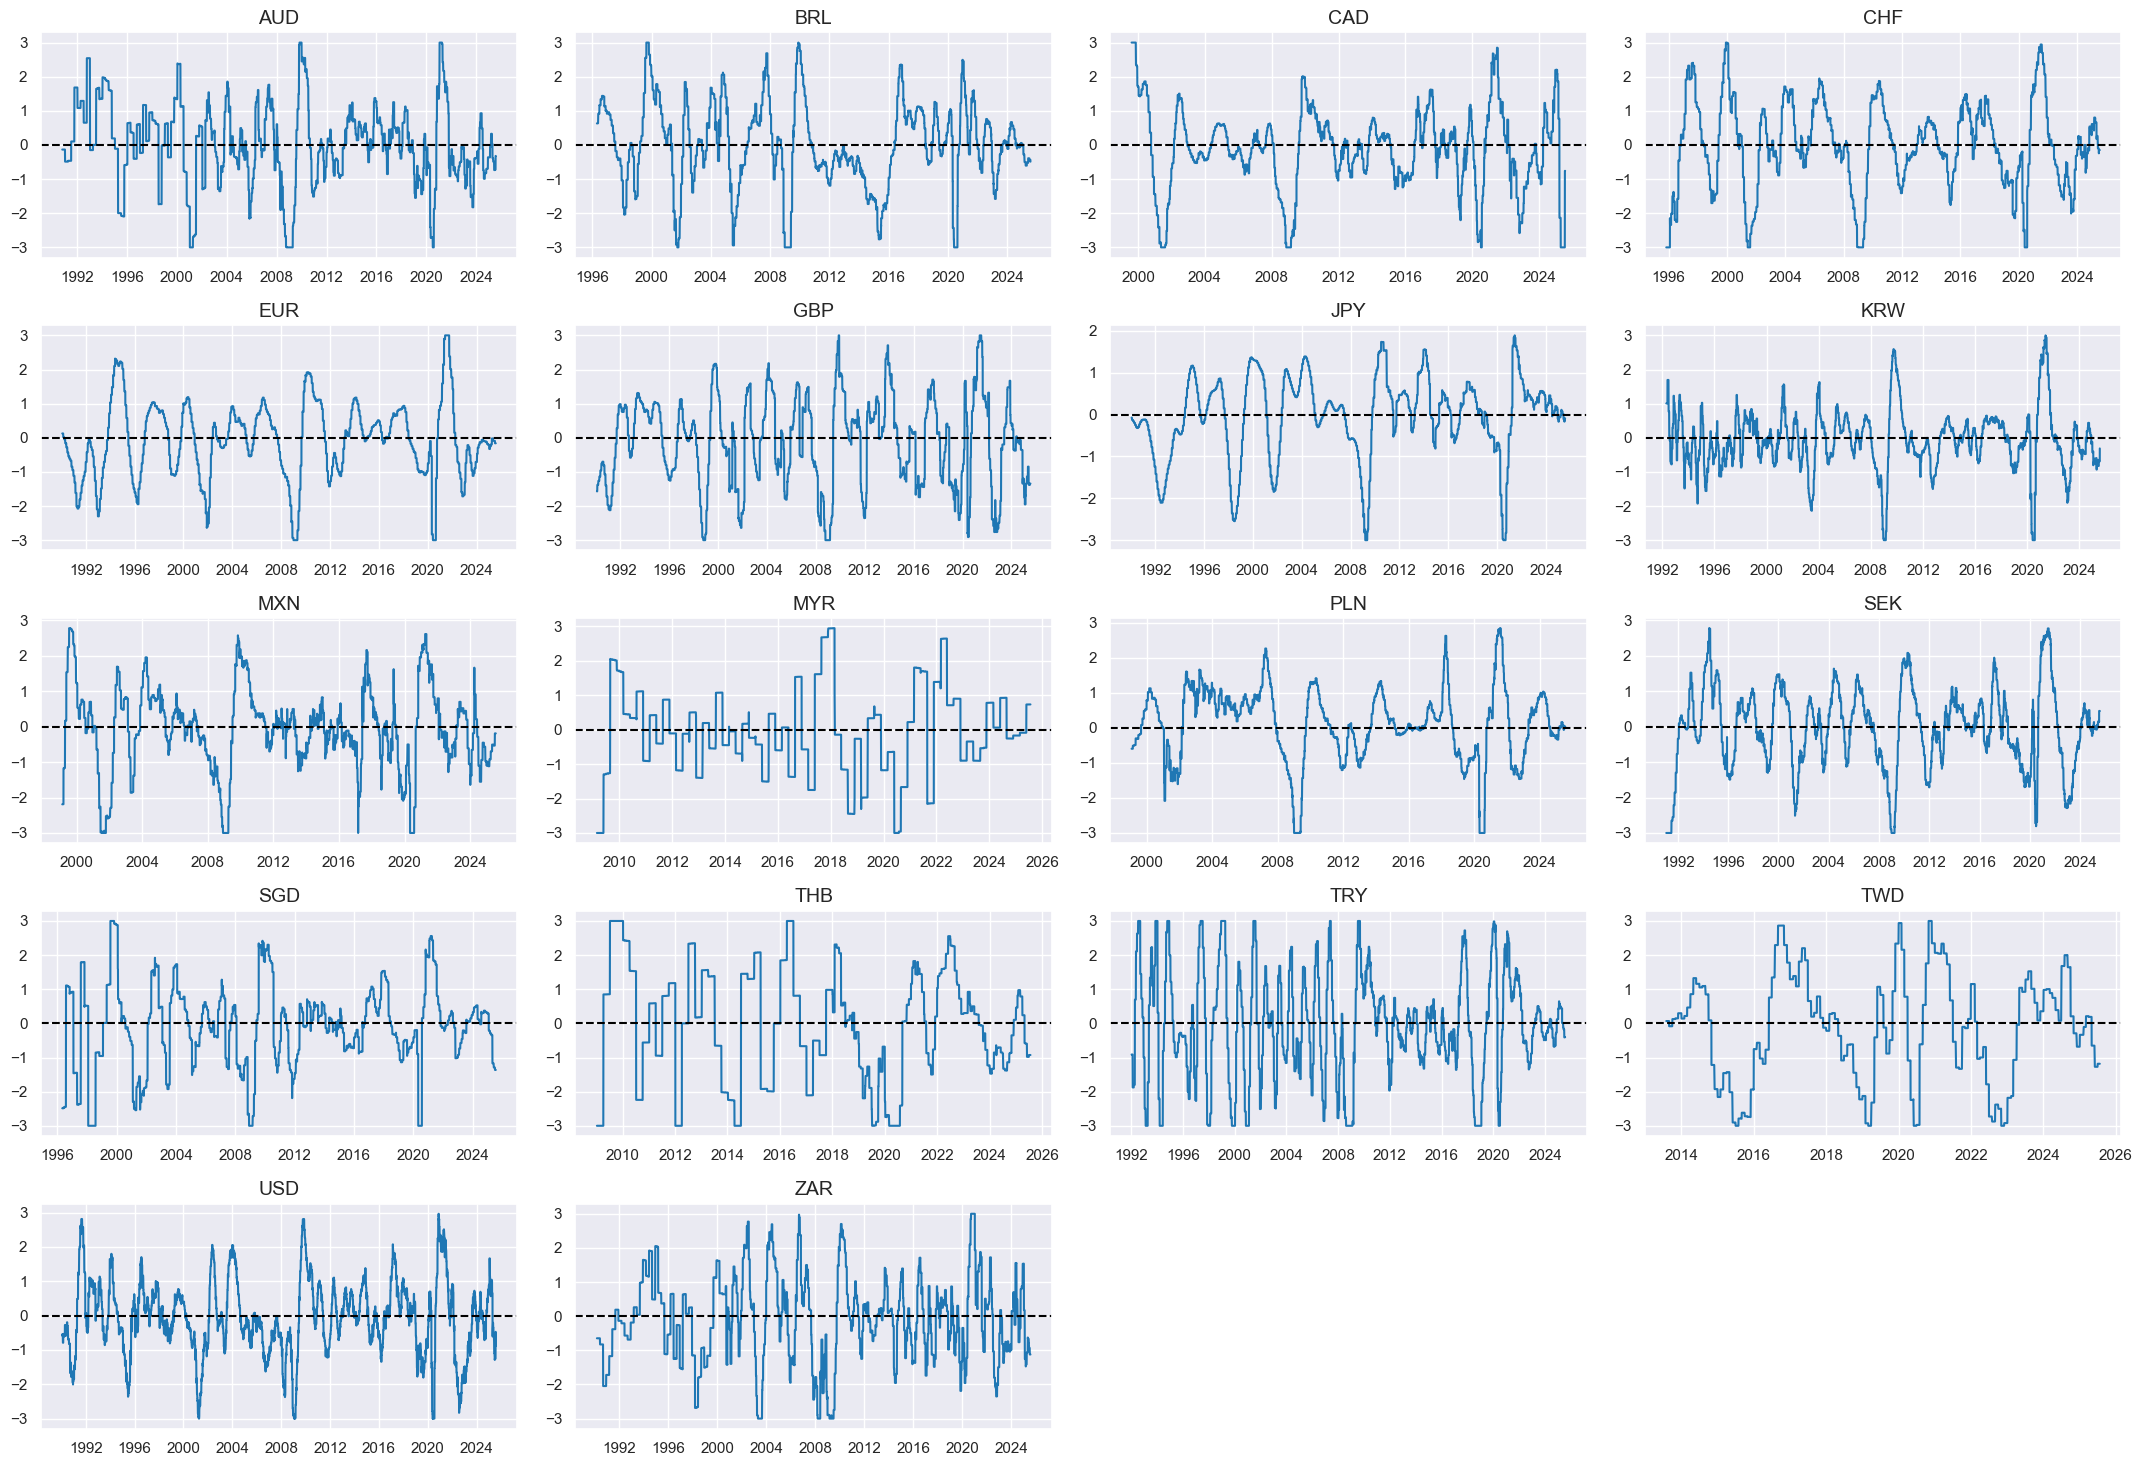
dict_facts[czs + "_ZN"] = "Business sentiment changes"
cidx = cids_eq
xcatx = ["BSURV_CHG_ZN"]

msp.view_timelines(
    dfx,
    xcats=xcatx,
    cids=cidx,
    ncol=4,
    same_y=False,
    all_xticks=True,
    aspect=1.8,
    height=2,
)
Checks #
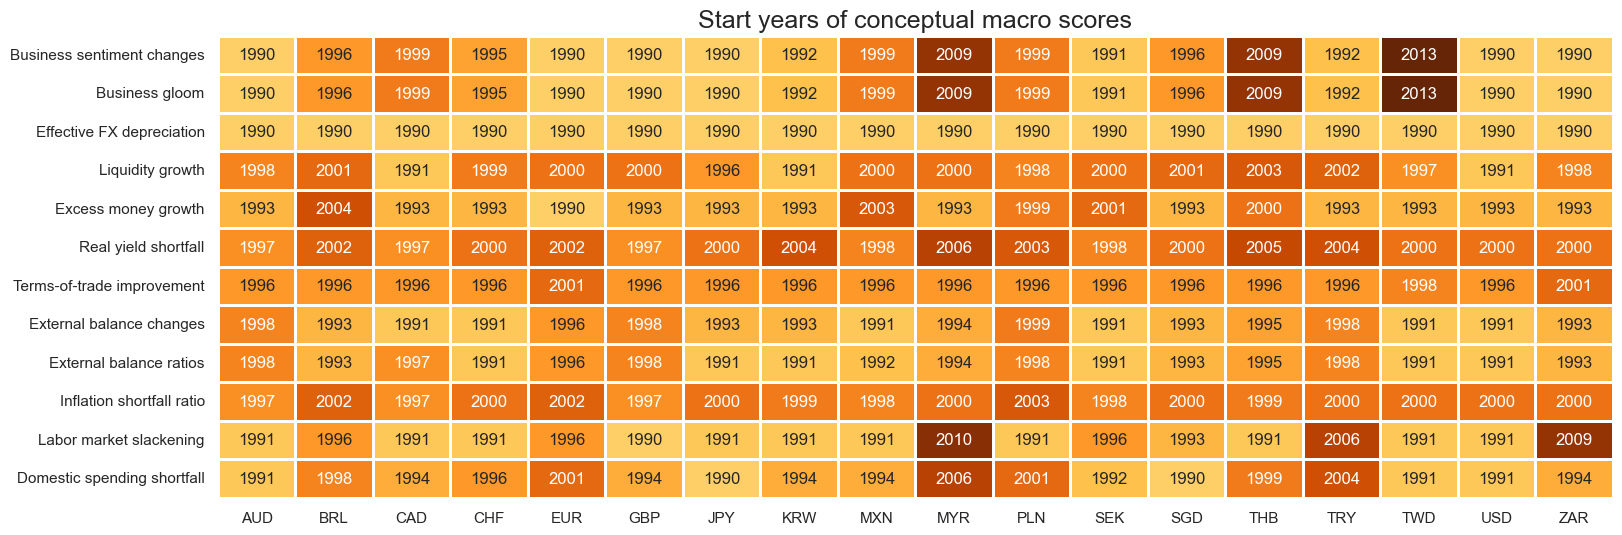
# Availability of scores

sorted_facts = sorted(dict_facts.items(), key=lambda item: item[1])
factorz = [k for k, v in sorted_facts]  # sort factors by labels for graph
xcatx = factorz

msm.check_availability(
    df=dfx,
    xcats=xcatx,
    cids=cids_eq,
    missing_recent=False,
    title="Start years of conceptual macro scores",
    xcat_labels=dict_facts,
)
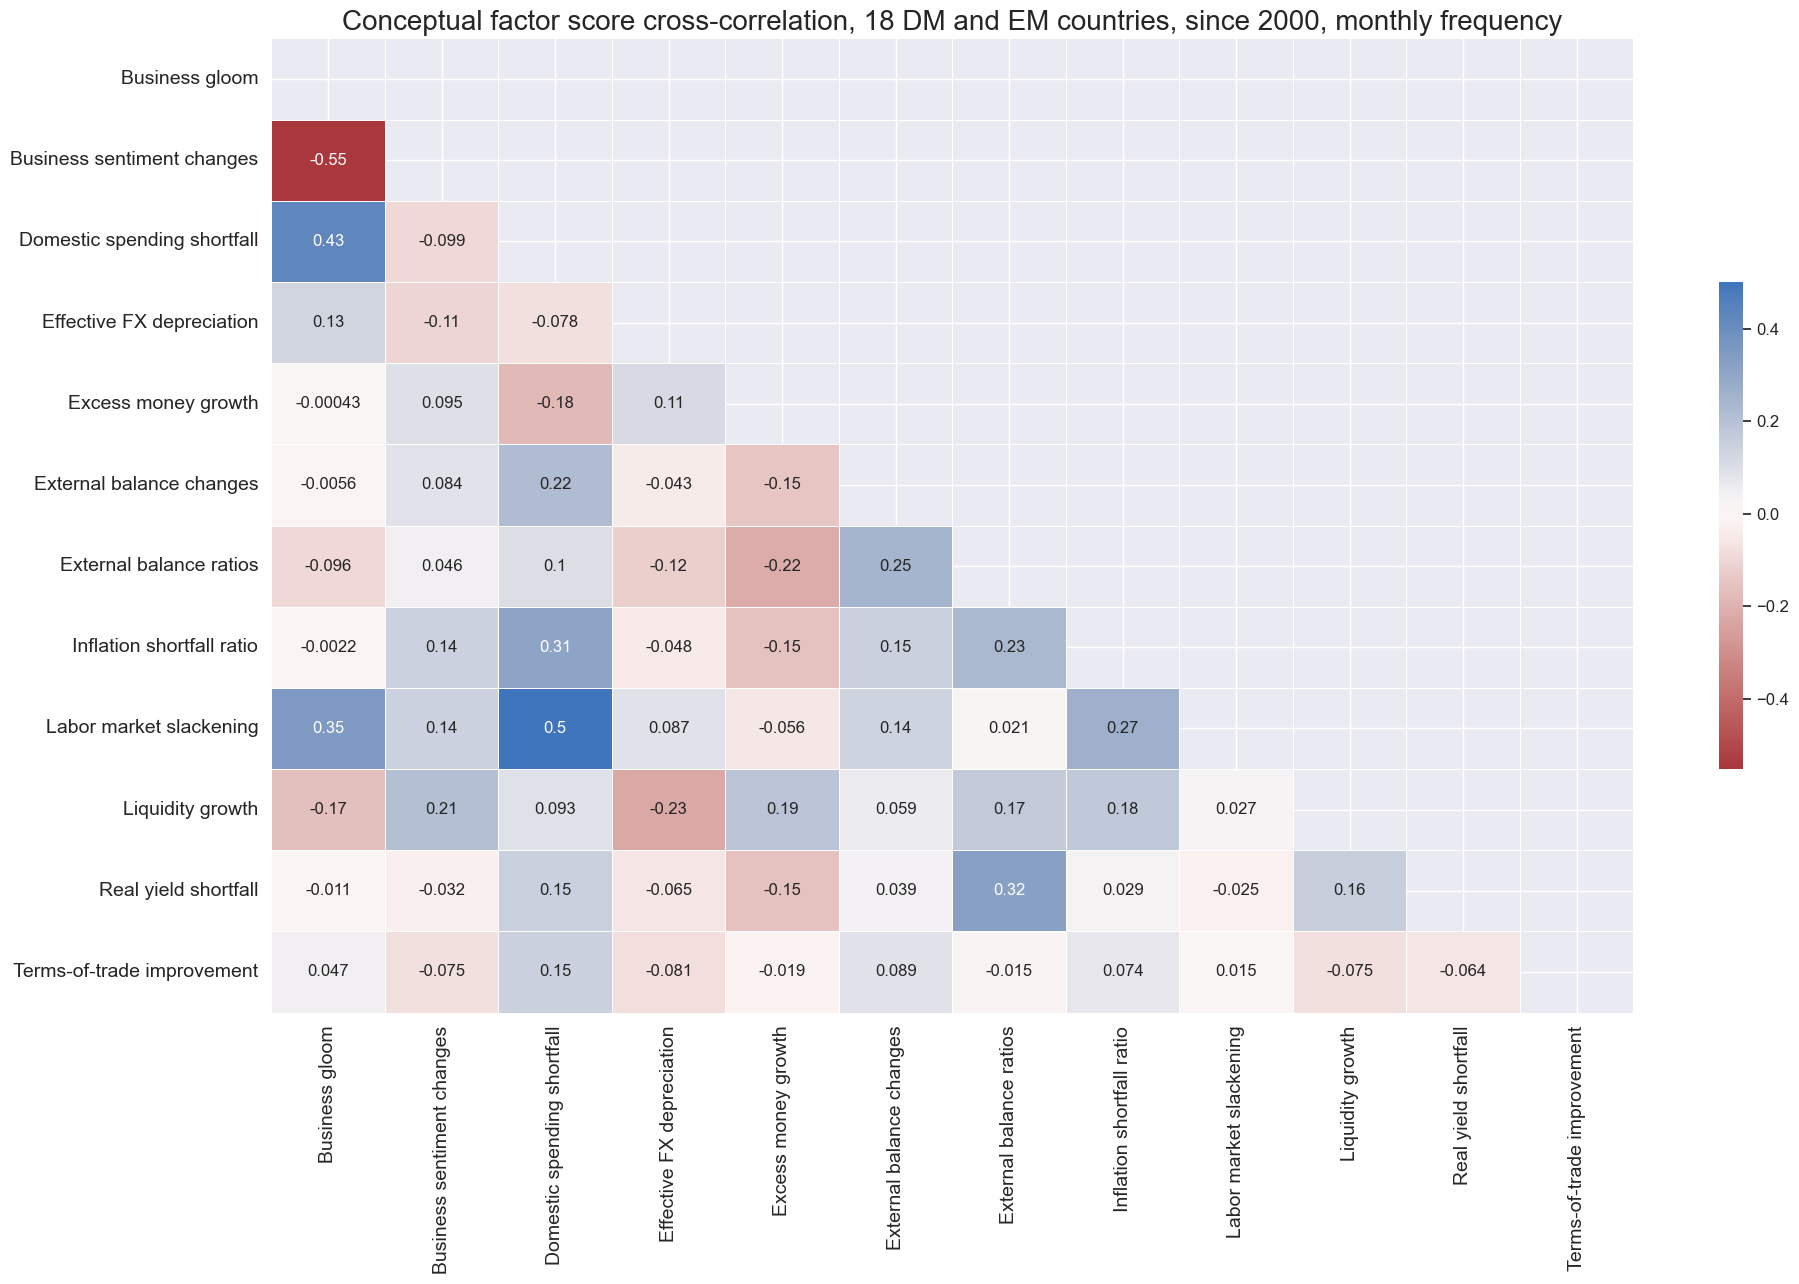
# Conceptual factor cross-correlation

xcatx = factorz

msp.correl_matrix(
    df=dfx,
    xcats=xcatx,
    cids=cids_eq,
    freq="m",
    title="Conceptual factor score cross-correlation, 18 DM and EM countries, since 2000, monthly frequency",
    size=(20, 13),
    annot=True,
    xcat_labels=dict_facts,
    start="2000-01-01",
    # cluster=True,
)
dict_rets = {
"EQXR_NSA": "Equity index futures returns",
"EQXR_VT10": "Vol-targeted futures returns",
}
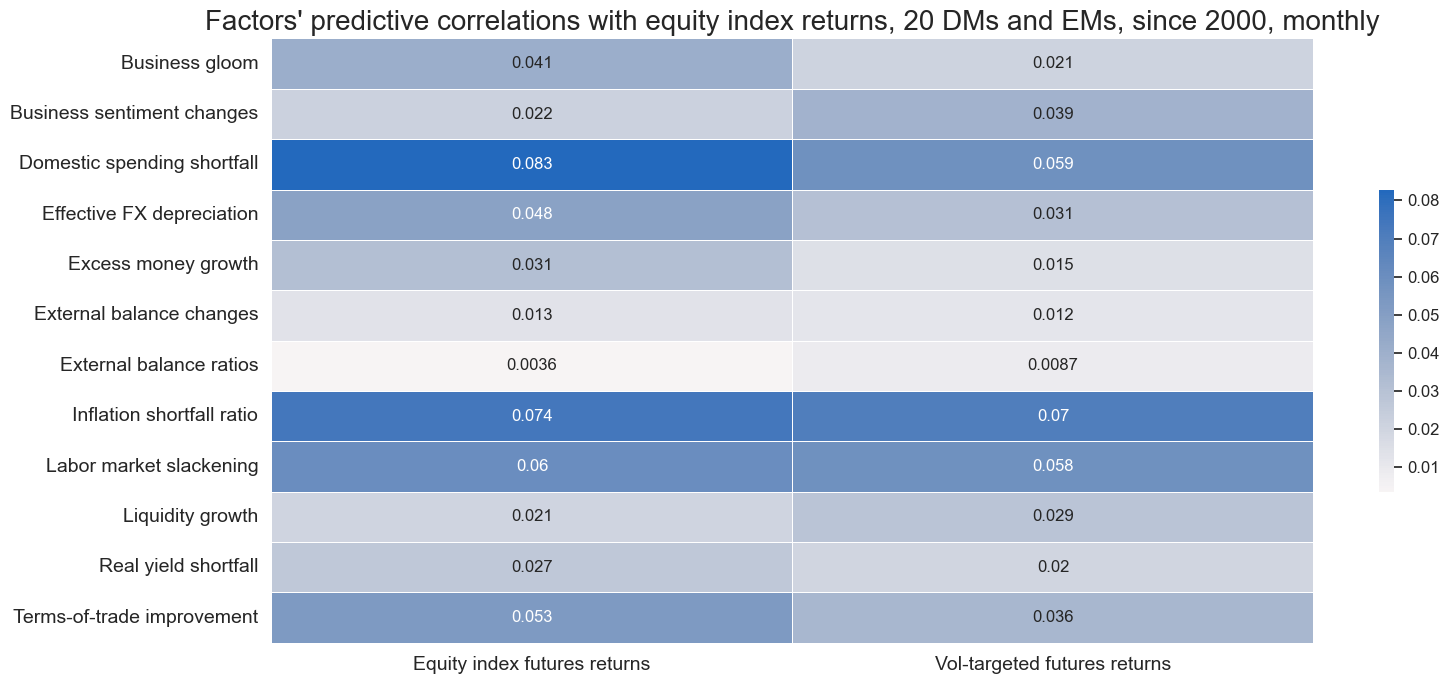
rets = [k for k in list(dict_rets.keys())]
dict_lags = {f: 1 for f in factorz}
msp.correl_matrix(
dfx,
xcats=rets,
xcats_secondary=factorz,
cids=cids_eq,
freq="M",
title="Factors' predictive correlations with equity index returns, 20 DMs and EMs, since 2000, monthly",
start="2000-01-01",
annot=True,
xcat_labels=dict_rets,
lags_secondary=dict_lags,
xcat_secondary_labels=dict_facts,
size=(16, 7),
)
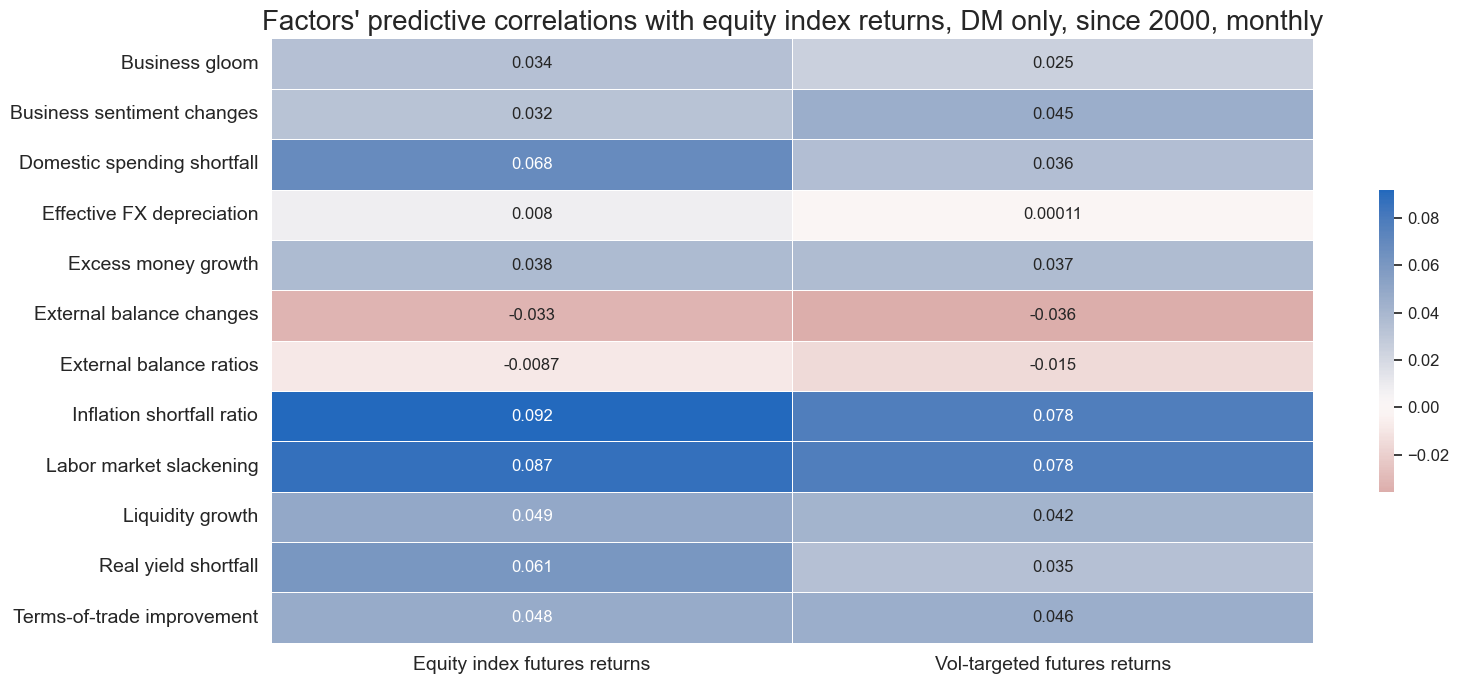
rets = [k for k in list(dict_rets.keys())]
dict_lags = {f: 1 for f in factorz}

msp.correl_matrix(
    dfx,
    xcats=rets,
    xcats_secondary=factorz,
    cids=cids_dmeq,
    freq="M",
    title="Factors' predictive correlations with equity index returns, DM only, since 2000, monthly",
    start="2000-01-01",
    annot=True,
    xcat_labels=dict_rets,
    lags_secondary=dict_lags,
    xcat_secondary_labels=dict_facts,
    size=(16, 7),
)
Target returns #
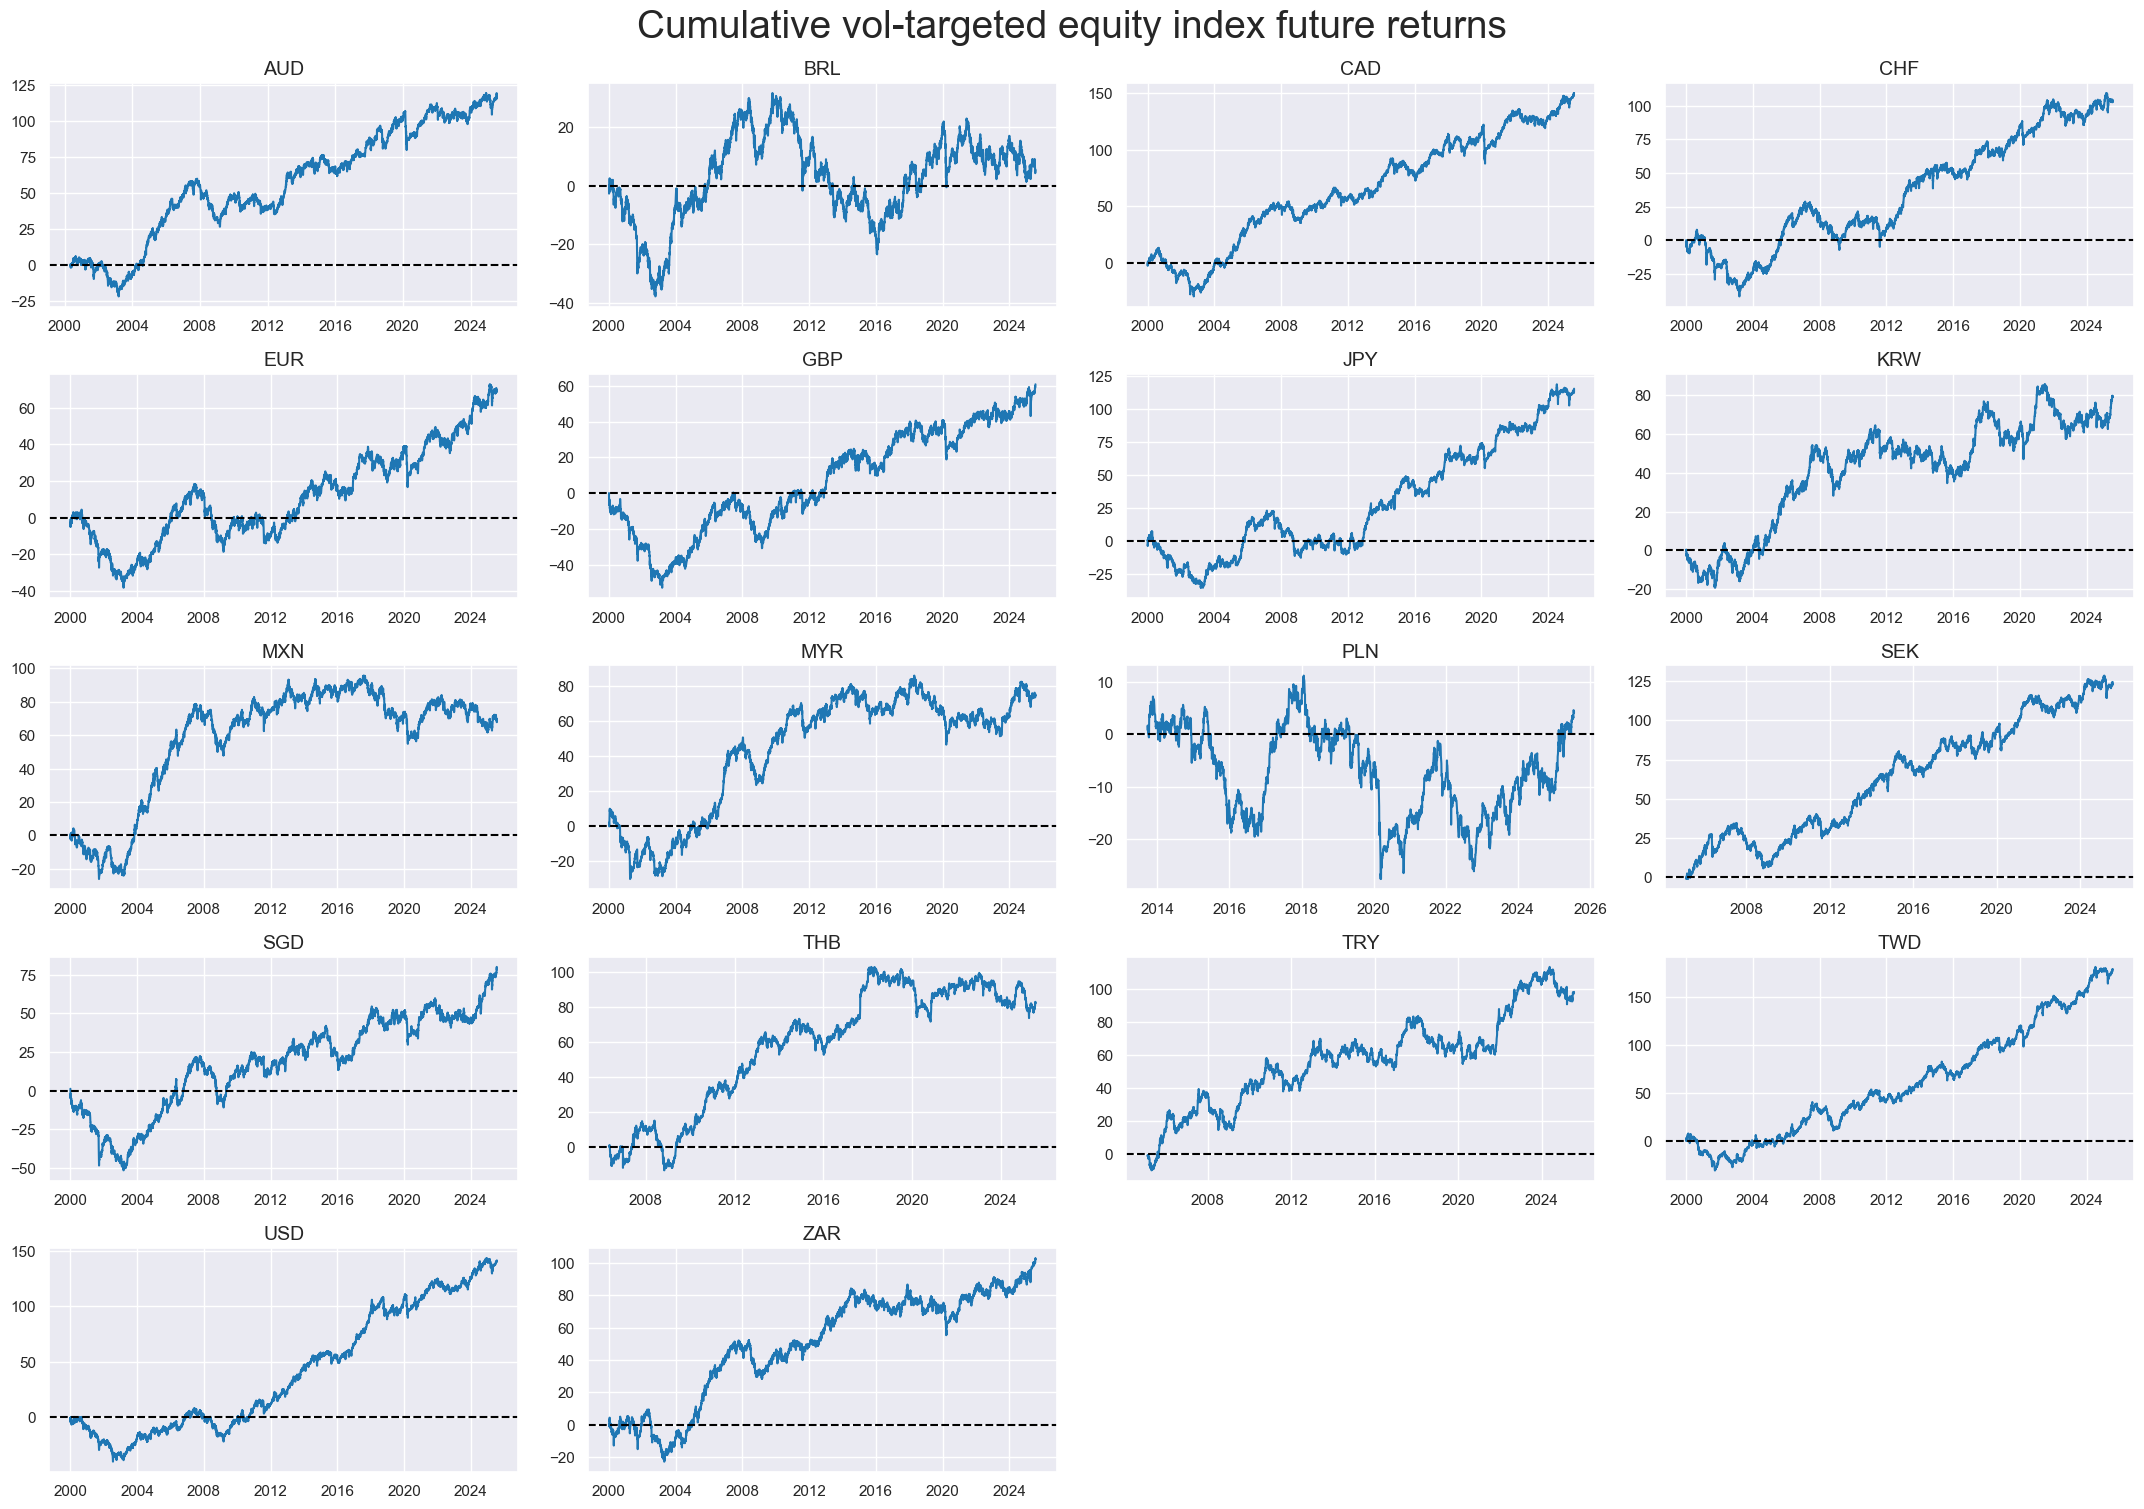
cidx = cids_eq
xcatx = ["EQXR_VT10"]

msp.view_timelines(
    dfx,
    xcats=xcatx,
    cids=cidx,
    cumsum=True,
    ncol=4,
    start="2000-01-01",
    title_fontsize=28,
    size=(10, 6),
    aspect=1.8,
    height=2,
    same_y=False,
    title="Cumulative vol-targeted equity index future returns",
    all_xticks=True,
    legend_fontsize=16,
)
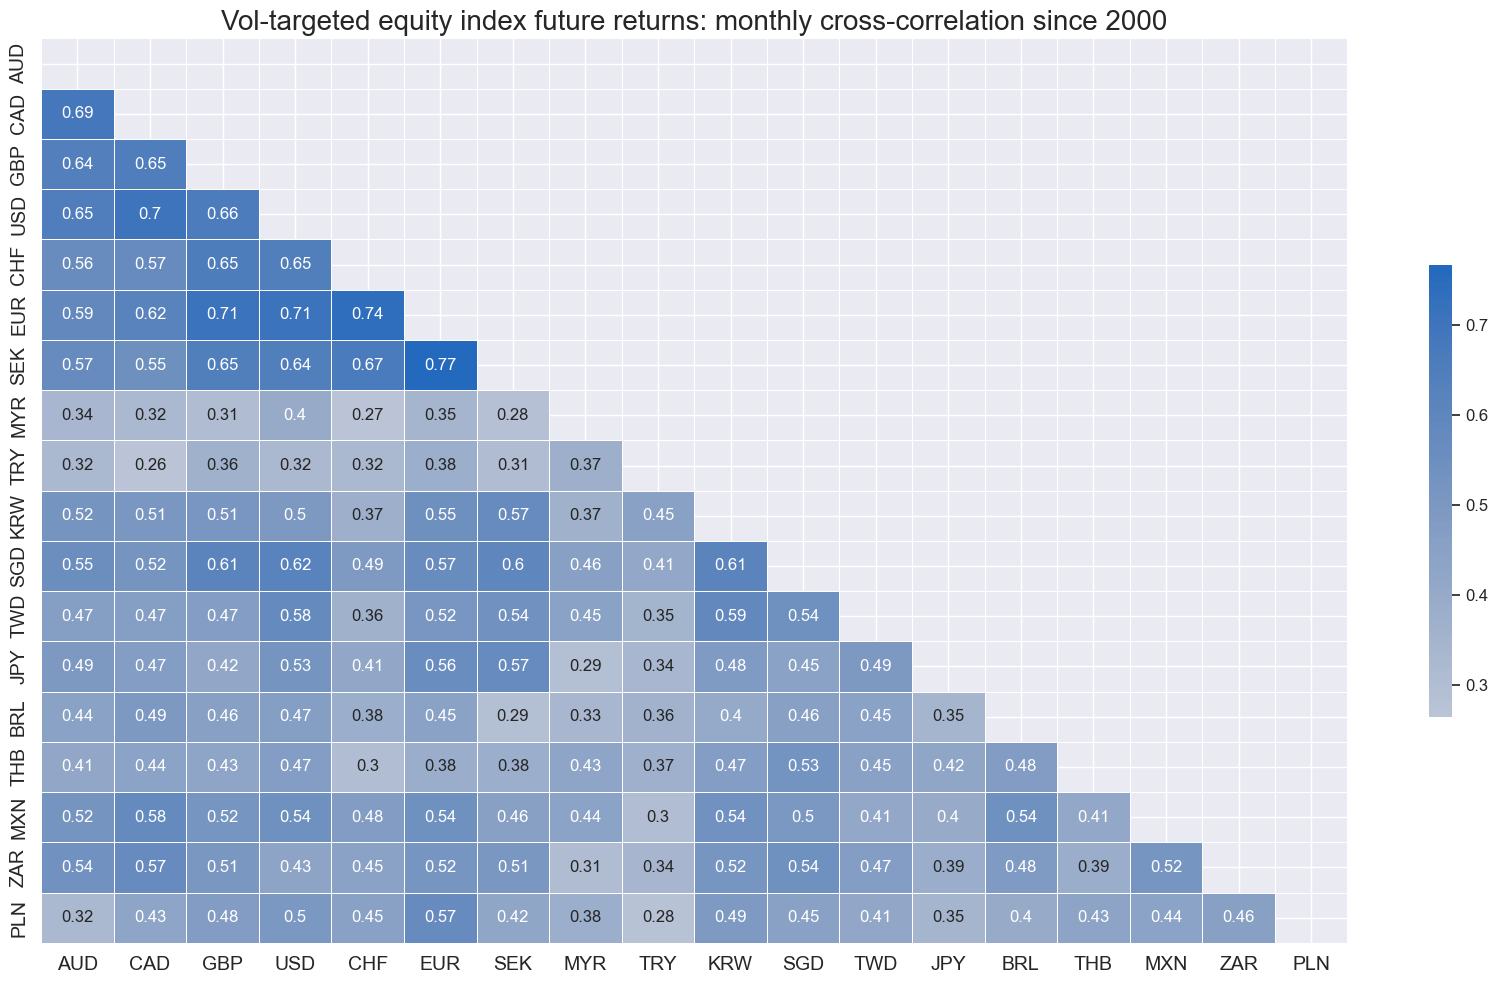
cidx = cids_eq

msp.correl_matrix(
    dfx,
    xcats="EQXR_VT10",
    cids=cidx,
    freq="M",
    title="Vol-targeted equity index future returns: monthly cross-correlation since 2000",
    size=(17, 10),
    cluster=True,
    annot=True
)
Signal generation with machine learning #
We use a weighted mean with the expanding 10-fold cross-validation splitter to deweight the influence of folds with worse availability.
availability_weights = np.array([i / 11 for i in range(1, 11)])
cv_weights = availability_weights / np.sum(availability_weights)
cv_weights
array([0.01818182, 0.03636364, 0.05454545, 0.07272727, 0.09090909,
       0.10909091, 0.12727273, 0.14545455, 0.16363636, 0.18181818])
Pooled model #
start_name = "PooledRidge"
so = msl.SignalOptimizer(
df=dfx,
cids=cids_eq,
xcats=factorz + ["EQXR_VT10"],
xcat_aggs=["last", "sum"],
lag=1,
freq="M",
)
so.calculate_predictions(
name=start_name,
models={
start_name: Pipeline([
("scaler", msl.PanelStandardScaler(with_mean=False)),
("predictor", Ridge(positive=True)),
])
},
hyperparameters={
start_name: {
"predictor__alpha": [1, 10, 100, 1000, 10000],
"predictor__fit_intercept": [True, False],
},
},
scorers={
"RMSE": make_scorer(root_mean_squared_error, greater_is_better=False)
},
inner_splitters={
"Expanding": msl.ExpandingKFoldPanelSplit(n_splits=10),
},
cv_summary=lambda row: np.average(a = row, weights=cv_weights) if len(row) == len(cv_weights) else np.nanmean(row),
test_size=1,
min_periods = 48,
)
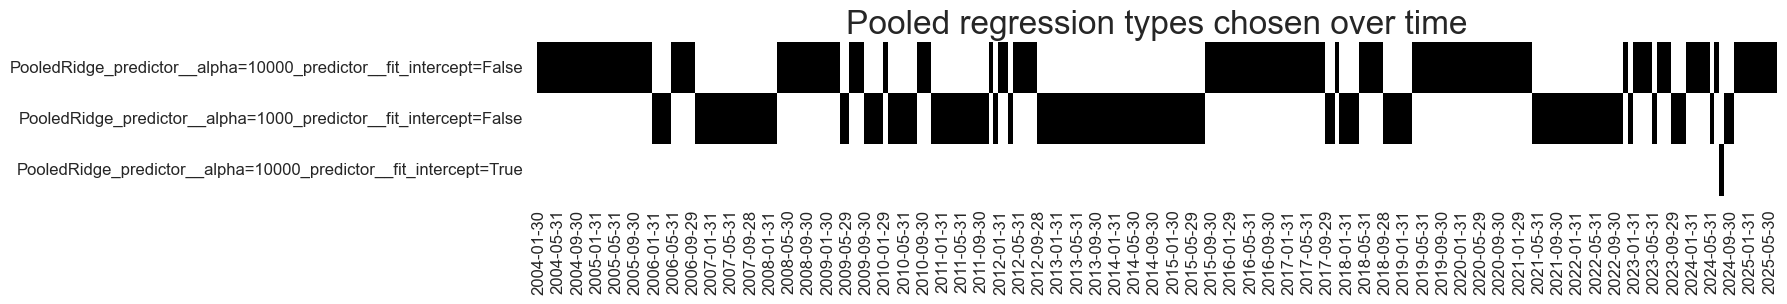
dfa = so.get_optimized_signals("PooledRidge")
dfx = msm.update_df(dfx, dfa)
so.models_heatmap(
    "PooledRidge",
    title="Pooled regression types chosen over time",
    title_fontsize=24,
    figsize=(16, 2),
)
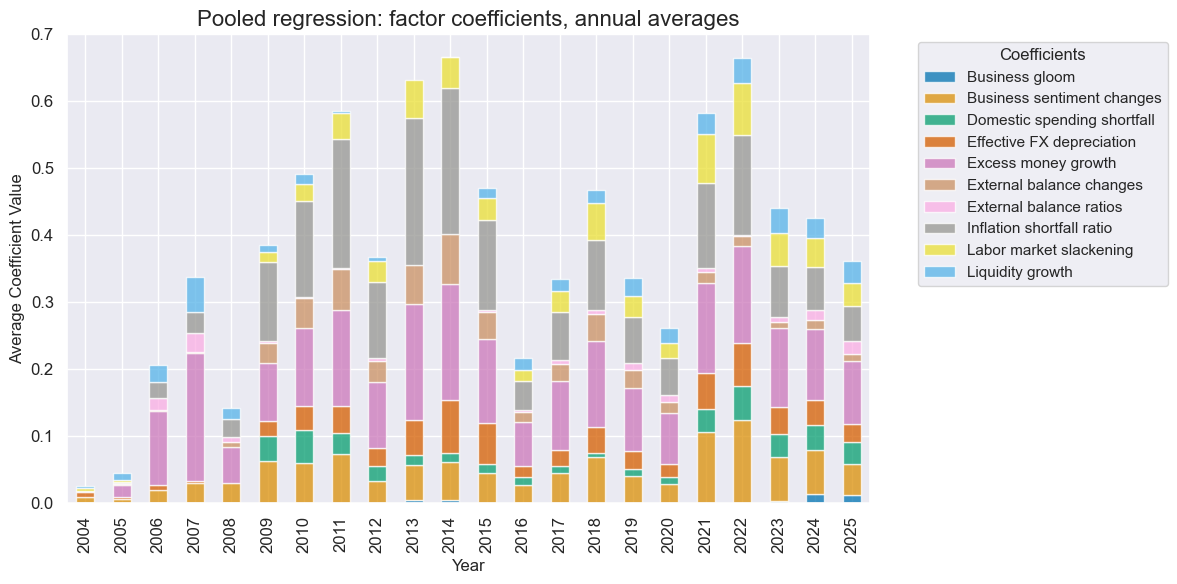
so.coefs_stackedbarplot(
    "PooledRidge",
    title="Pooled regression: factor coefficients, annual averages",
    title_fontsize=16,
    figsize=(12, 6),
    ftrs_renamed=dict_facts
)
Country models #
strat_name = "CountryRidge"
so.calculate_predictions(
name=strat_name,
models={
strat_name: Pipeline([
("scaler", msl.PanelStandardScaler(with_mean=False)),
(
"predictor",
msl.CountryByCountryRegression(
estimator = Ridge(positive=True)
),
),
])
},
hyperparameters={
strat_name: {
"predictor__estimator__alpha": [1, 10, 100, 1000, 10000],
"predictor__estimator__fit_intercept": [True, False],
},
},
scorers={
"RMSE": make_scorer(root_mean_squared_error, greater_is_better=False)
},
inner_splitters={
"Expanding": msl.ExpandingKFoldPanelSplit(n_splits=10),
},
cv_summary=lambda row: np.average(a = row, weights=cv_weights) if len(row) == len(cv_weights) else np.nanmean(row),
test_size=1,
min_periods = 48
)
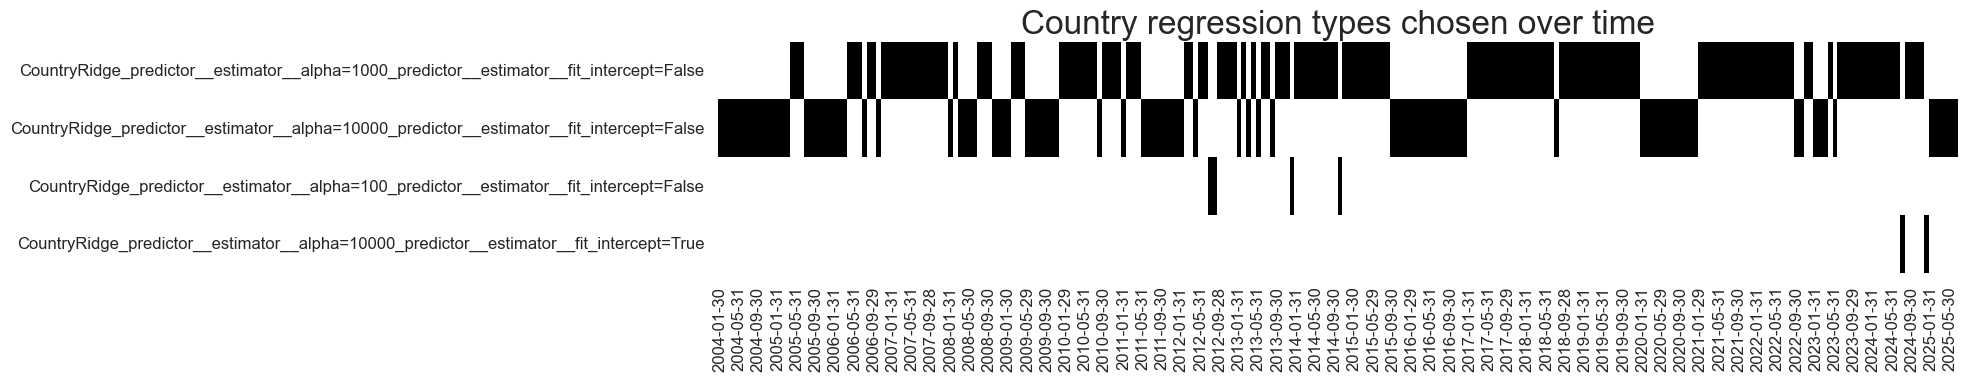
dfa = so.get_optimized_signals("CountryRidge")
dfx = msm.update_df(dfx, dfa)
so.models_heatmap(
    "CountryRidge",
    title="Country regression types chosen over time",
    title_fontsize=24,
    figsize=(16, 3),
)
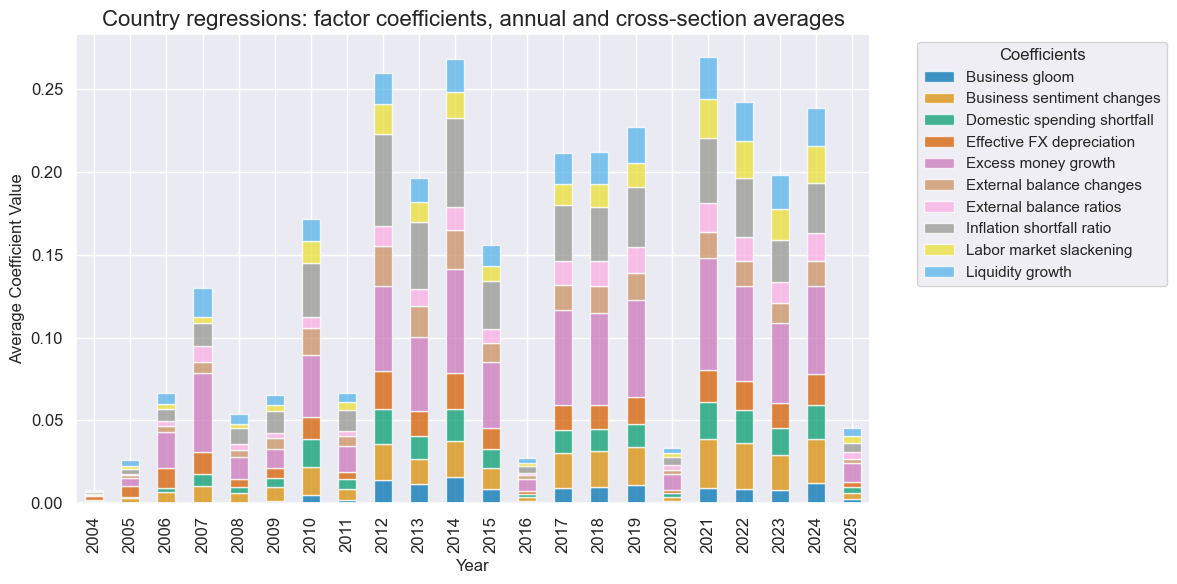
so.coefs_stackedbarplot(
    "CountryRidge",
    title="Country regressions: factor coefficients, annual and cross-section averages",
    title_fontsize=16,
    figsize=(12, 6),
    ftrs_renamed=dict_facts
)
Global-local method #
strat_name = "GlobalLocal"
so.calculate_predictions(
name=strat_name,
models={
strat_name: Pipeline([
("scaler", msl.PanelStandardScaler(with_mean=False)),
("model", msl.GlobalLocalRegression(positive=True)),
]),
},
hyperparameters={
strat_name: {
"model__local_lambda": [1, 10, 100, 1000, 10000],
"model__global_lambda": [1, 10, 100, 1000, 10000],
"model__fit_intercept": [True, False],
},
},
scorers={
"RMSE": make_scorer(root_mean_squared_error, greater_is_better=False)
},
inner_splitters={
"Expanding": msl.ExpandingKFoldPanelSplit(n_splits=10),
},
cv_summary=lambda row: np.average(a = row, weights=cv_weights) if len(row) == len(cv_weights) else np.nanmean(row),
test_size=1,
min_periods = 48
)
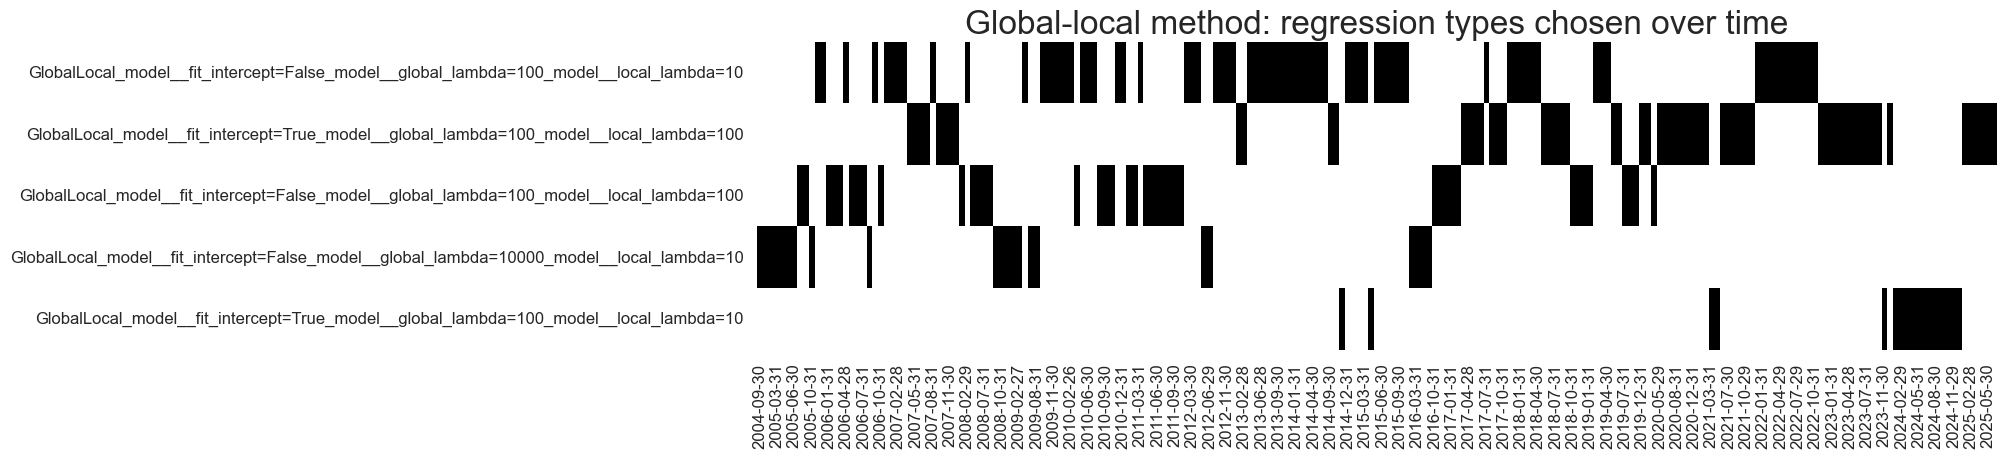
dfa = so.get_optimized_signals(strat_name)
dfx = msm.update_df(dfx, dfa)
so.models_heatmap(
    "GlobalLocal",
    title="Global-local method: regression types chosen over time",
    title_fontsize=24,
    figsize=(16, 4),
)
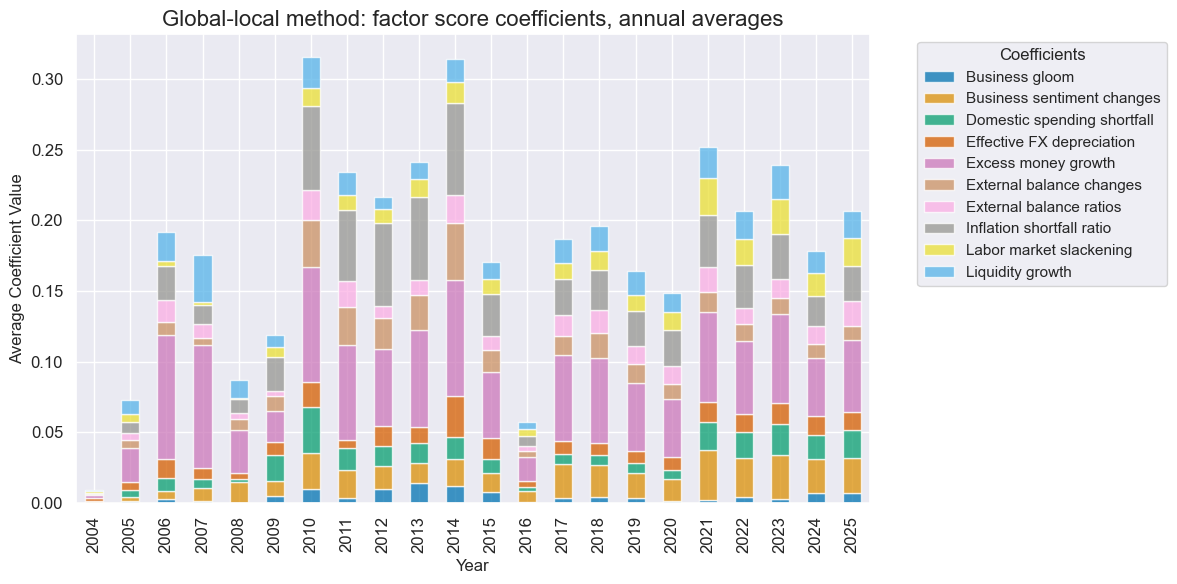
so.coefs_stackedbarplot(
    "GlobalLocal",
    title="Global-local method: factor score coefficients, annual averages",
    title_fontsize=16,
    figsize=(12, 6),
    ftrs_renamed=dict_facts
)
Long-only signals #
xcatx = ["PooledRidge", "CountryRidge", "GlobalLocal"]
cidx = cids_eq

dfa = msp.panel_calculator(
    df = dfx,
    calcs = [
        f"{xcat}_LO = np.clip( {xcat} , a_min=0, a_max=np.inf )"
        for xcat in xcatx
    ],
    cids= cidx
)
dfx = msm.update_df(dfx, dfa)
Value checks #
Panel test #
crs = []
xcatx = ["PooledRidge", "CountryRidge", "GlobalLocal"]
for xcat in xcatx:
crs.append(
msp.CategoryRelations(
df=dfx,
xcats=[xcat, "EQXR_NSA"],
cids=cids_eq,
freq="M",
lag=1,
xcat_aggs=["last", "sum"],
slip=0,
)
)
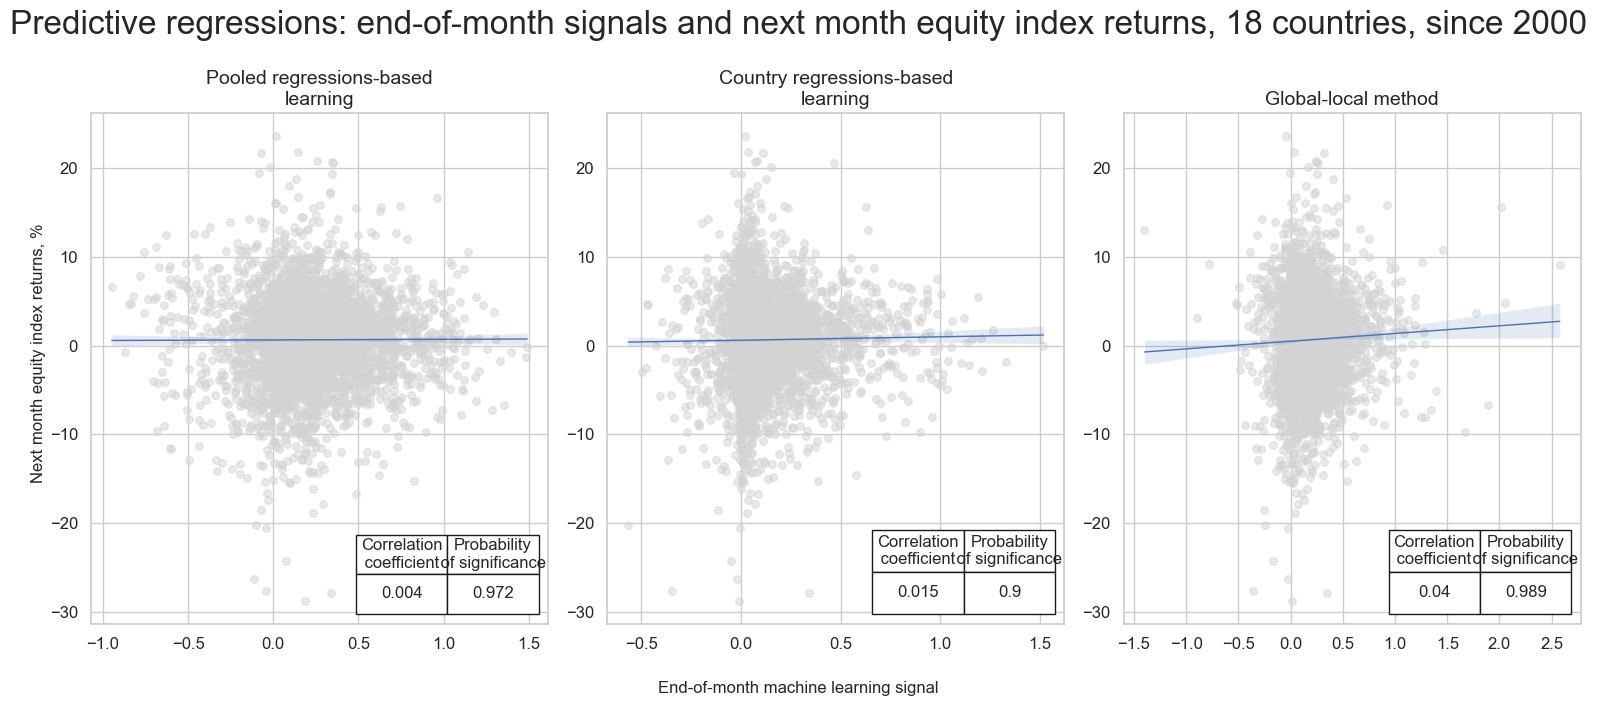
msv.multiple_reg_scatter(
cat_rels=crs,
ncol=3,
nrow=1,
title="Predictive regressions: end-of-month signals and next month equity index returns, 18 countries, since 2000",
title_fontsize=24,
xlab="End-of-month machine learning signal",
ylab="Next month equity index returns, %",
subplot_titles=[
"Pooled regressions-based learning",
"Country regressions-based learning",
"Global-local method",
],
prob_est="map",
coef_box="lower right",
share_axes=False,
figsize=(16, 7),
)
Accuracy and correlation check #
srr = mss.SignalReturnRelations(
df=dfx,
rets=["EQXR_NSA"],
sigs=["PooledRidge", "CountryRidge", "GlobalLocal"],
cids=cids_eq,
freqs="M",
slip=1,
cosp=True,
ms_panel_test=True,
)
display(srr.multiple_relations_table().round(3))
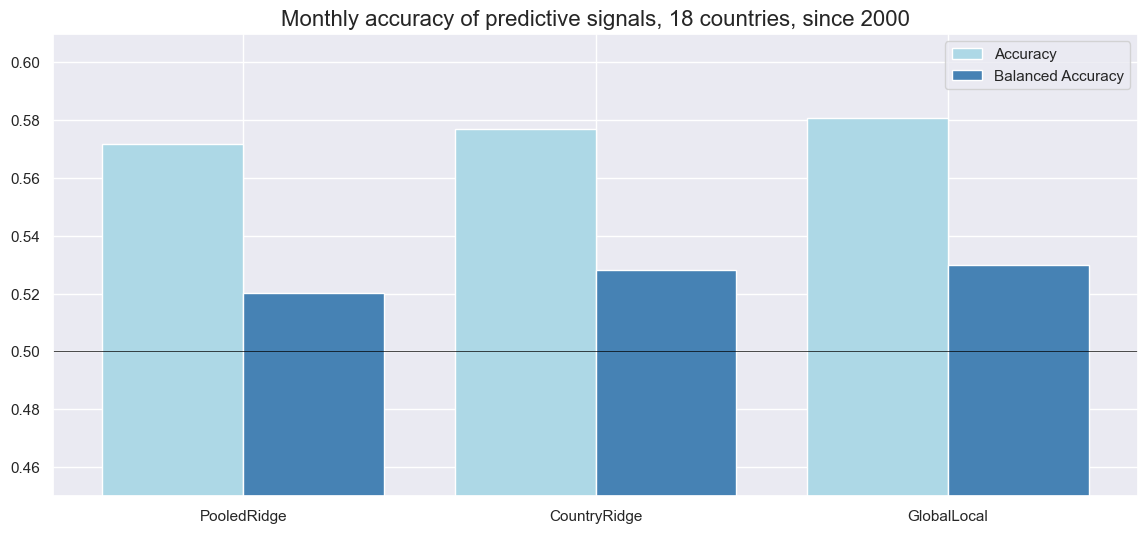
srr.accuracy_bars(
type="signals",
size=(14, 6),
title="Monthly accuracy of predictive signals, 18 countries, since 2000",
)
| accuracy | bal_accuracy | pos_sigr | pos_retr | pos_prec | neg_prec | pearson | pearson_pval | kendall | kendall_pval | auc | map_pval | ||||
|---|---|---|---|---|---|---|---|---|---|---|---|---|---|---|---|
| Return | Signal | Frequency | Aggregation | ||||||||||||
| EQXR_NSA | CountryRidge | M | last | 0.569 | 0.515 | 0.834 | 0.592 | 0.597 | 0.433 | 0.001 | 0.973 | -0.009 | 0.362 | 0.509 | 0.082 |
| GlobalLocal | M | last | 0.581 | 0.530 | 0.865 | 0.592 | 0.600 | 0.460 | 0.040 | 0.010 | 0.019 | 0.069 | 0.514 | 0.014 | |
| PooledRidge | M | last | 0.577 | 0.529 | 0.831 | 0.592 | 0.602 | 0.457 | 0.004 | 0.793 | 0.002 | 0.836 | 0.517 | 0.024 |
Naive PnL #
Directional strategy #
xcatx = ["PooledRidge", "CountryRidge", "GlobalLocal"]
pnl = msn.NaivePnL(
df=dfx,
ret="EQXR_NSA",
sigs=xcatx,
cids=cids_eq,
start="2004-01-30",
bms=["USD_EQXR_NSA"],
)
for xcat in xcatx:
pnl.make_pnl(
sig=xcat,
sig_op="zn_score_pan",
rebal_freq="monthly",
sig_add=0,
rebal_slip=1,
vol_scale=10,
neutral="zero",
thresh=3,
)
dict_pnl_labs = {
"PNL_PooledRidge": "Pooled panel model learning signal",
"PNL_CountryRidge": "Country-by-country model learning signal",
"PNL_GlobalLocal": "Global-local model learning signal",
}
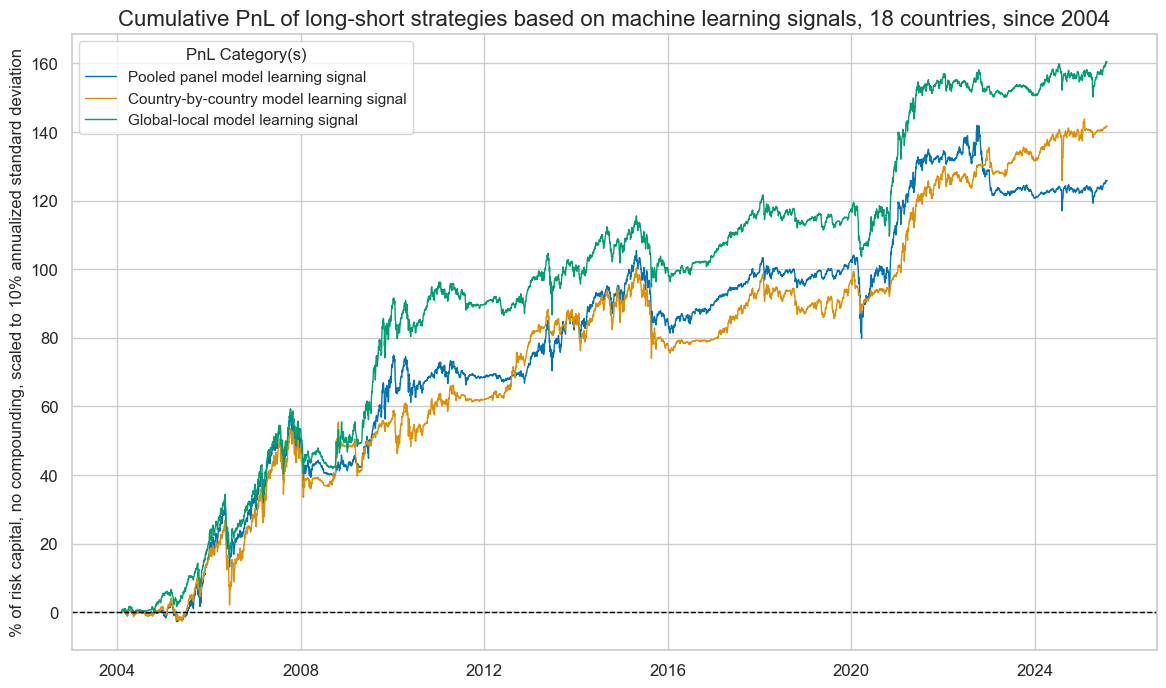
pnl.plot_pnls(
title="Cumulative PnL of long-short strategies based on machine learning signals, 18 countries, since 2004",
title_fontsize=16,
figsize=(14, 8),
compounding=False,
ylab="% of risk capital, no compounding, scaled to 10% annualized standard deviation",
xcat_labels=dict_pnl_labs,
)
pnl.evaluate_pnls(
pnl_cats=pnl.pnl_names
)
| xcat | PNL_PooledRidge | PNL_CountryRidge | PNL_GlobalLocal |
|---|---|---|---|
| Return % | 5.853963 | 6.588654 | 7.463408 |
| St. Dev. % | 10.0 | 10.0 | 10.0 |
| Sharpe Ratio | 0.585396 | 0.658865 | 0.746341 |
| Sortino Ratio | 0.805781 | 0.903274 | 1.047545 |
| Max 21-Day Draw % | -22.427272 | -18.7349 | -15.916498 |
| Max 6-Month Draw % | -19.538216 | -21.011779 | -16.417859 |
| Peak to Trough Draw % | -25.544304 | -26.463751 | -20.715635 |
| Top 5% Monthly PnL Share | 0.698658 | 0.559353 | 0.582869 |
| USD_EQXR_NSA correl | 0.332875 | 0.265545 | 0.293153 |
| Traded Months | 259 | 259 | 259 |
Long-biased directional strategy #
xcatx = ["PooledRidge", "CountryRidge", "GlobalLocal"]

pnl = msn.NaivePnL(
    df=dfx,
    ret="EQXR_NSA",
    sigs=xcatx,
    cids=cids_eq,
    start="2004-01-30",
    bms=["USD_EQXR_NSA"],
)

for xcat in xcatx:
    pnl.make_pnl(
        sig=xcat,
        sig_op="zn_score_pan",
        rebal_freq="monthly",
        sig_add=1,
        rebal_slip=1,
        vol_scale=10,
        neutral="zero",
        thresh=3,
    )

dict_pnl_labs = {
    "PNL_PooledRidge": "Pooled panel model learning signal",
    "PNL_CountryRidge": "Country-by-country model learning signal",
    "PNL_GlobalLocal": "Global-local model learning signal",
    "LONG": "Long-only equally-weighted basket",
}

pnl.make_long_pnl(vol_scale = 10, label = "LONG")

pnl.plot_pnls(
    title="Cumulative PnL of long-biased strategies based on machine learning signals, 18 countries, since 2004",
    title_fontsize=16,
    figsize=(14, 8),
    compounding=False,
    ylab="% of risk capital, no compounding, scaled to 10% annualized standard deviation",
    xcat_labels=dict_pnl_labs,
)

pnl.evaluate_pnls(
    pnl_cats=pnl.pnl_names
)
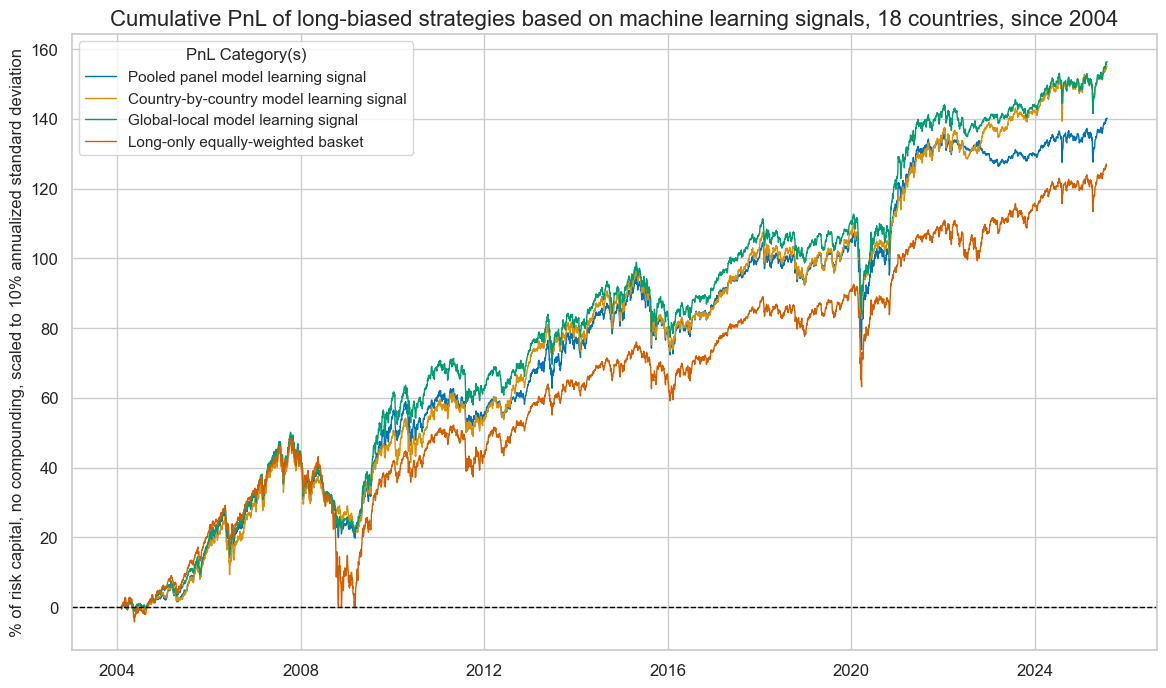
| xcat | PNL_PooledRidge | PNL_CountryRidge | PNL_GlobalLocal | LONG |
|---|---|---|---|---|
| Return % | 6.520109 | 7.209107 | 7.274139 | 5.918028 |
| St. Dev. % | 10.0 | 10.0 | 10.0 | 10.0 |
| Sharpe Ratio | 0.652011 | 0.720911 | 0.727414 | 0.591803 |
| Sortino Ratio | 0.892398 | 0.988697 | 1.00595 | 0.812708 |
| Max 21-Day Draw % | -31.16346 | -23.755657 | -26.08395 | -27.600784 |
| Max 6-Month Draw % | -27.095839 | -18.927467 | -21.945427 | -40.987411 |
| Peak to Trough Draw % | -33.360623 | -27.427828 | -28.587861 | -48.514801 |
| Top 5% Monthly PnL Share | 0.580874 | 0.47671 | 0.538247 | 0.616752 |
| USD_EQXR_NSA correl | 0.560735 | 0.556759 | 0.566528 | 0.651844 |
| Traded Months | 259 | 259 | 259 | 259 |
Long-only strategy #
xcatx = ["PooledRidge_LO", "CountryRidge_LO", "GlobalLocal_LO"]

pnl = msn.NaivePnL(
    df=dfx,
    ret="EQXR_NSA",
    sigs=xcatx,
    cids=cids_eq,
    start="2004-01-30",
    bms=["USD_EQXR_NSA"],
)

for xcat in xcatx:
    pnl.make_pnl(
        sig=xcat,
        sig_op="zn_score_pan",
        rebal_freq="monthly",
        sig_add=0,
        rebal_slip=1,
        vol_scale=10,
        neutral="zero",
        thresh=3,
    )

dict_pnl_labs = {
    "PNL_PooledRidge_LO": "Pooled panel model learning signal",
    "PNL_CountryRidge_LO": "Country-by-country model learning signal",
    "PNL_GlobalLocal_LO": "Global-local model learning signal",
    "LONG": "Long-only signal",
}

pnl.make_long_pnl(vol_scale = 10, label = "LONG")

pnl.plot_pnls(
    title="Cumulative PnL of long-only strategies based on machine learning signals, 18 countries, since 2004",
    title_fontsize=16,
    figsize=(14, 8),
    compounding=False,
    ylab="% of risk capital, no compounding, scaled to 10% annualized standard deviation",
    xcat_labels=dict_pnl_labs,
)

pnl.evaluate_pnls(
    pnl_cats=pnl.pnl_names
)
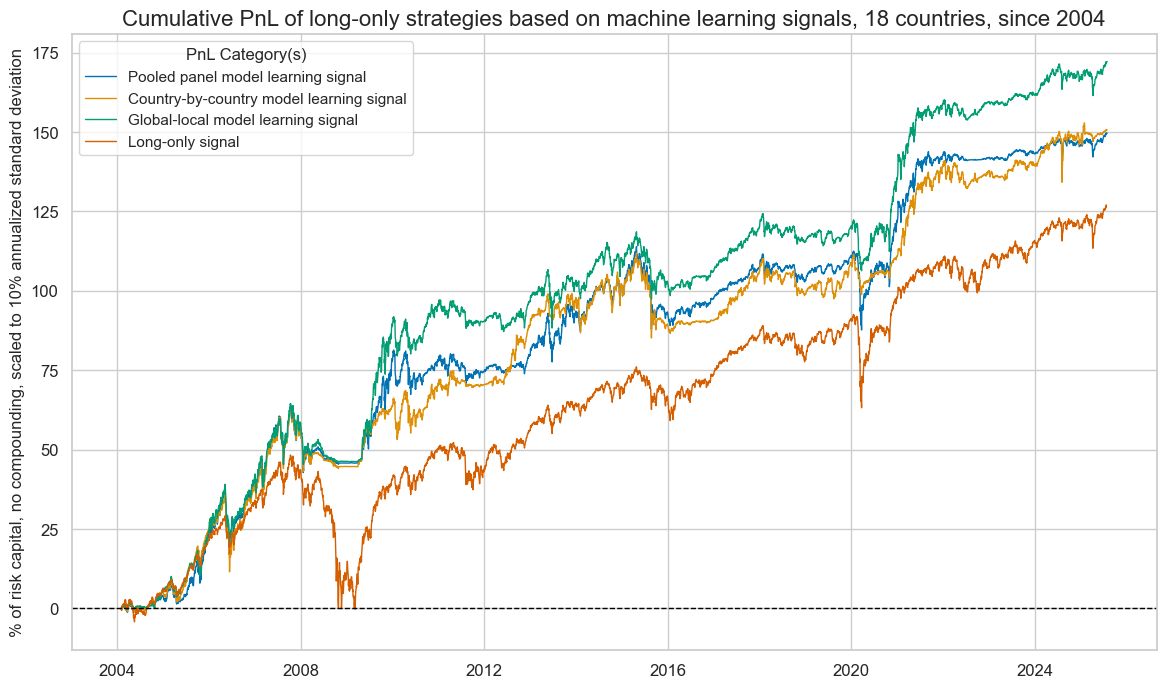
| xcat | PNL_PooledRidge_LO | PNL_CountryRidge_LO | PNL_GlobalLocal_LO | LONG |
|---|---|---|---|---|
| Return % | 6.960735 | 7.007455 | 8.005576 | 5.918028 |
| St. Dev. % | 10.0 | 10.0 | 10.0 | 10.0 |
| Sharpe Ratio | 0.696074 | 0.700745 | 0.800558 | 0.591803 |
| Sortino Ratio | 0.961435 | 0.95619 | 1.123197 | 0.812708 |
| Max 21-Day Draw % | -22.962563 | -18.926469 | -16.246543 | -27.600784 |
| Max 6-Month Draw % | -20.178311 | -21.158479 | -16.791511 | -40.987411 |
| Peak to Trough Draw % | -26.284546 | -26.762323 | -21.183001 | -48.514801 |
| Top 5% Monthly PnL Share | 0.602707 | 0.514416 | 0.554037 | 0.616752 |
| USD_EQXR_NSA correl | 0.448868 | 0.388523 | 0.416048 | 0.651844 |
| Traded Months | 259 | 259 | 259 | 259 |