Information state changes and the Treasury market #
Get packages and JPMaQS data #
# >>> Define constants <<< #
import os

# Minimum Macrosynergy package version required for this notebook
MIN_REQUIRED_VERSION: str = "0.1.32"

# DataQuery credentials: Remember to replace with your own client ID and secret
DQ_CLIENT_ID: str = os.getenv("DQ_CLIENT_ID")
DQ_CLIENT_SECRET: str = os.getenv("DQ_CLIENT_SECRET")

# Define any Proxy settings required (http/https)
PROXY = {}

# Start date for the data (argument passed to the JPMaQSDownloader class)
START_DATE: str = "1995-01-01"
# Standard library imports
from typing import List, Tuple, Dict
import warnings

import numpy as np
import pandas as pd
import matplotlib.pyplot as plt
import matplotlib as mpl
import seaborn as sns
from scipy.stats import chi2

# Macrosynergy package imports
import macrosynergy.management as msm
import macrosynergy.panel as msp
import macrosynergy.pnl as msn
import macrosynergy.visuals as msv
import macrosynergy.signal as mss

from macrosynergy.download import JPMaQSDownload

warnings.simplefilter("ignore")
# Check installed Macrosynergy package meets version requirement
import macrosynergy as msy
msy.check_package_version(required_version=MIN_REQUIRED_VERSION)
Specify and download the data #
# Cross sections to be explored
cids = ["USD",]

# Quantamental categories of interest
growth = [
    "RGDPTECH_SA_P1M1ML12_3MMA", # (-) Technical Real GDP growth
    "INTRGDP_NSA_P1M1ML12_3MMA", # (-) Intuitive Growth
]

# Inflation measures
inflation = [
    "CPIH_SA_P1M1ML12",  # (-) Headline consumer price inflation
    "PPIH_NSA_P1M1ML12", # (-) Purchasing Price inflation
]

# Labour market tightness measures
labour = [
    "COJLCLAIMS_SA_D4W4WL52", # (+) Initial jobless claims
    "EMPL_NSA_P1M1ML12",  # (-) Change in empyloyment  (non-farm payrolls)
]

# All feature categories
main = growth +  inflation + labour

# Market returns (target) categories
rets = [f"{AC}{MAT}_{ADJ}" for AC in ["DU", "GB"] for MAT in ["02YXR", "05YXR", "10YXR"] for ADJ in ["NSA", "VT10"]]

# All category tickers
xcats = main + rets

# All tickers
tickers = [cid + "_" + xcat for cid in cids for xcat in xcats]

print(f"Maximum number of JPMaQS tickers to be downloaded is {len(tickers)}")
Maximum number of JPMaQS tickers to be downloaded is 18
# Download from DataQuery
with JPMaQSDownload(
    client_id=DQ_CLIENT_ID, client_secret=DQ_CLIENT_SECRET
) as downloader:
    df: pd.DataFrame = downloader.download(
        tickers=tickers,
        start_date=START_DATE,
        metrics=["value", "grading", "eop_lag"],
        suppress_warning=True,
        show_progress=True,
        report_time_taken=True,
        proxy=PROXY,
    )
Downloading data from JPMaQS.
Timestamp UTC:  2024-10-04 15:00:14
Connection successful!
Requesting data: 100%|██████████| 3/3 [00:00<00:00,  4.86it/s]
Downloading data: 100%|██████████| 3/3 [00:11<00:00,  3.92s/it]
Time taken to download data: 	13.68 seconds.
Some dates are missing from the downloaded data.
2 out of 7767 dates are missing.
dfx = df.copy()
dfx.info()
<class 'pandas.core.frame.DataFrame'>
RangeIndex: 137367 entries, 0 to 137366
Data columns (total 6 columns):
 #   Column     Non-Null Count   Dtype
---  ------     --------------   -----
 0   real_date  137367 non-null  datetime64[ns]
 1   cid        137367 non-null  object
 2   xcat       137367 non-null  object
 3   value      137367 non-null  float64
 4   grading    137367 non-null  float64
 5   eop_lag    137367 non-null  float64
dtypes: datetime64[ns](1), float64(3), object(2)
memory usage: 6.3+ MB
Availability #
xcatx = main
msm.check_availability(df=dfx, xcats=xcatx, cids=cids, missing_recent=False)

Transformation and checks #
Calculate and list positive effect categories #
dfa = dfx[dfx['xcat'].isin(main)].copy()
dfa.loc[:, 'value'] = dfa['value'] * -1
dfa.loc[:, 'xcat'] = dfa['xcat']  + "_NEG"
dfx = msm.update_df(dfx, dfa)
# Lists for sign change relative to target of 10y gov bonds
positives = [
    "COJLCLAIMS_SA_D4W4WL52", # (+) Initial jobless claims
]

negatives = [x for x in main if x not in positives]

# Positive effects features against target
pe_feats = [xc for xc in positives] + [xc + "_NEG" for xc in negatives]
Calculate and add normalized information state changes #
df_red = msm.reduce_df(dfx, xcats=pe_feats, cids=["USD"])

# creates sparse dataframe with information state changes
isc_obj = msm.InformationStateChanges.from_qdf(
    df=df_red,
    norm=True, # normalizes changes by first release values
    std="std",
    halflife=12,
    min_periods=36,
)

# Revert back to Quantamenal DataFrame information states
dfa = isc_obj.to_qdf(value_column="zscore", postfix="_NIC")

dfx = msm.update_df(dfx, dfa[["real_date", "cid", "xcat", "value"]])
# Calculate [1] Information state changes (IC), and [2] back-out volatility estimates (IC_STD)
for cat in pe_feats:
    calcs = [
        f"{cat:s}_IC = {cat:s}.diff()",  # IC : information state changes
        f"{cat:s}_IC_STD = ( {cat:s}_IC / {cat:s}_NIC ).ffill()"  # IC_STD: information state changes standard deviations
    ]
    dfa = msp.panel_calculator(dfx, calcs=calcs, cids=["USD"])
    dfx = msm.update_df(dfx, dfa)

# Weekly variables adjustment for frequency scaling to monthly unit volatility
weekly = ["COJLCLAIMS_SA_D4W4WL52"]
calcs = [
    f"{kk:s}_NICW = np.sqrt(5/21) * {kk:s}_NIC"
    for kk in weekly
]

# Monthly variables (no adjustment)
monthly = [kk for kk in pe_feats if kk not in weekly]
calcs +=  [
    f"{kat:s}_NICW = {kat:s}_NIC"
    for kat in monthly
]

dfa = msp.panel_calculator(dfx, calcs=calcs, cids=["USD"])
dfx = msm.update_df(dfx, dfa)
# Winsorization for charts
calcs = [
    f"{cat:s}_NICWW = {cat:s}_NICW.clip(lower=5, upper=-5)"
    for cat in pe_feats
]
dfa = msp.panel_calculator(dfx, calcs=calcs, cids=["USD"])
dfx = msm.update_df(dfx, dfa)
xcatx_labels = {
    "RGDPTECH_SA_P1M1ML12_3MMA_NEG": "Technical real GDP, %oya, 3mma, negative change",
    "INTRGDP_NSA_P1M1ML12_3MMA_NEG": "Intuitive real GDP, %oya, 3mma, negative change",
}

msp.view_timelines(
    dfx,
    xcats=[xc + "_NICWW" for xc in xcatx_labels.keys()],
    cids=["USD"],
    xcat_grid=True,
    same_y=False,
    ncol=2,
    title="Estimated growth: Normalized and frequency-adjusted information state changes (trimmed at 5SD)",
    xcat_labels=list(xcatx_labels.values()),
)

xcatx_labels = {
    'CPIH_SA_P1M1ML12_NEG': "CPI, %oya, negative change",
    'PPIH_NSA_P1M1ML12_NEG': "PPI, %oya, negative change",
}

msp.view_timelines(
    dfx,
    xcats=[xc + "_NICWW" for xc in xcatx_labels.keys()],
    cids=["USD"],
    xcat_grid=True,
    same_y=False,
    ncol=2,
    title="Inflation: Normalized and frequency-adjusted information state changes (trimmed at 5SD)",
    xcat_labels=list(xcatx_labels.values()),
)

xcatx_labels = {
    'COJLCLAIMS_SA_D4W4WL52': "Jobless claims, diff oya, positive change",
    'EMPL_NSA_P1M1ML12_NEG': "Employment, %oya, negative change",
}

msp.view_timelines(
    dfx,
    xcats=[xc + "_NICWW" for xc in xcatx_labels.keys()],
    cids=["USD"],
    xcat_grid=True,
    same_y=False,
    ncol=2,
    title="Labor market tightening: Normalized and frequency-adjusted information state changes (trimmed at 5SD)",
    xcat_labels=list(xcatx_labels.values()),
)

Temporal aggregations #
# Trim/Winsorisation in below!
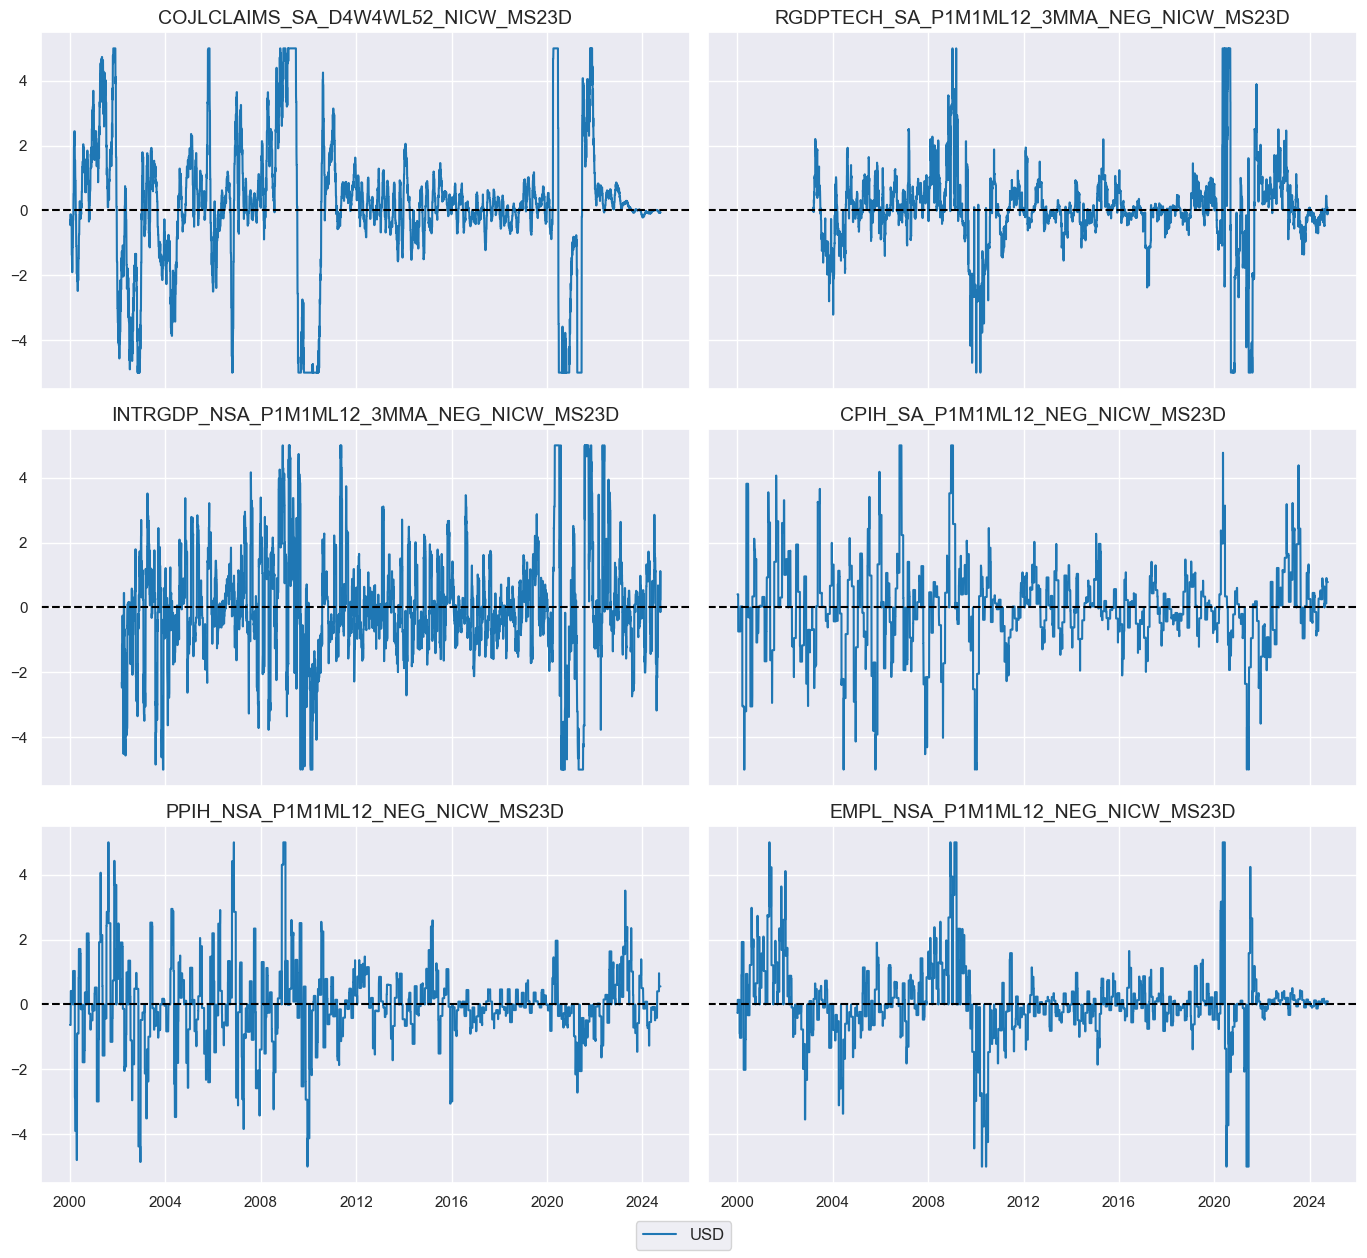
calcs = [
    f"{cat:s}_NICW_MS23D = {cat:s}_NICW.rolling(23).sum().clip(lower=5, upper=-5)"
    for cat in pe_feats
]
dfa = msp.panel_calculator(dfx, calcs=calcs, cids=["USD"])
dfx = msm.update_df(dfx, dfa)

# Define aggregation name for below
nic_agg = "_NICW_MS23D"
msp.view_timelines(
    dfx,
    xcats=[kk + nic_agg for kk in pe_feats],
    cids=["USD"],
    xcat_grid = True,
    same_y = True,
    ncol=2,
)
xcatx = [xc + "_NIC" for xc in pe_feats]
df_red = msm.reduce_df(dfx, xcats=xcatx, cids=["USD"])

# Exponential moving average
dfa = msm.temporal_aggregator_exponential(df=df_red, halflife=15, winsorise=None)
dfx = msm.update_df(dfx, dfa)  # NICEWM15D

# Equal weighted mean
dfa = msm.temporal_aggregator_mean(df=df_red, window=23,  winsorise=None)
dfx = msm.update_df(dfx, dfa)  # NICMA23D

# Define aggregation name for below
# nic_agg = "_NICMA23D"
Group aggregation and data checks #
Growth #
growth_nic = [xc + nic_agg for xc in pe_feats if xc.split('_')[0] in [x.split('_')[0] for x in growth]]
xcatx = growth_nic

dfa = msp.linear_composite(
    df=dfx,
    xcats=xcatx,
    cids=["USD"],
    new_xcat="AVG_GROWTH" + nic_agg ,
)
dfx = msm.update_df(dfx, dfa)
xcatx = growth_nic + ["AVG_GROWTH" + nic_agg]

msp.view_timelines(
    dfx,
    xcats=xcatx,
    cids=["USD"],
    xcat_grid = True,
    same_y = True,
    ncol=3,
)

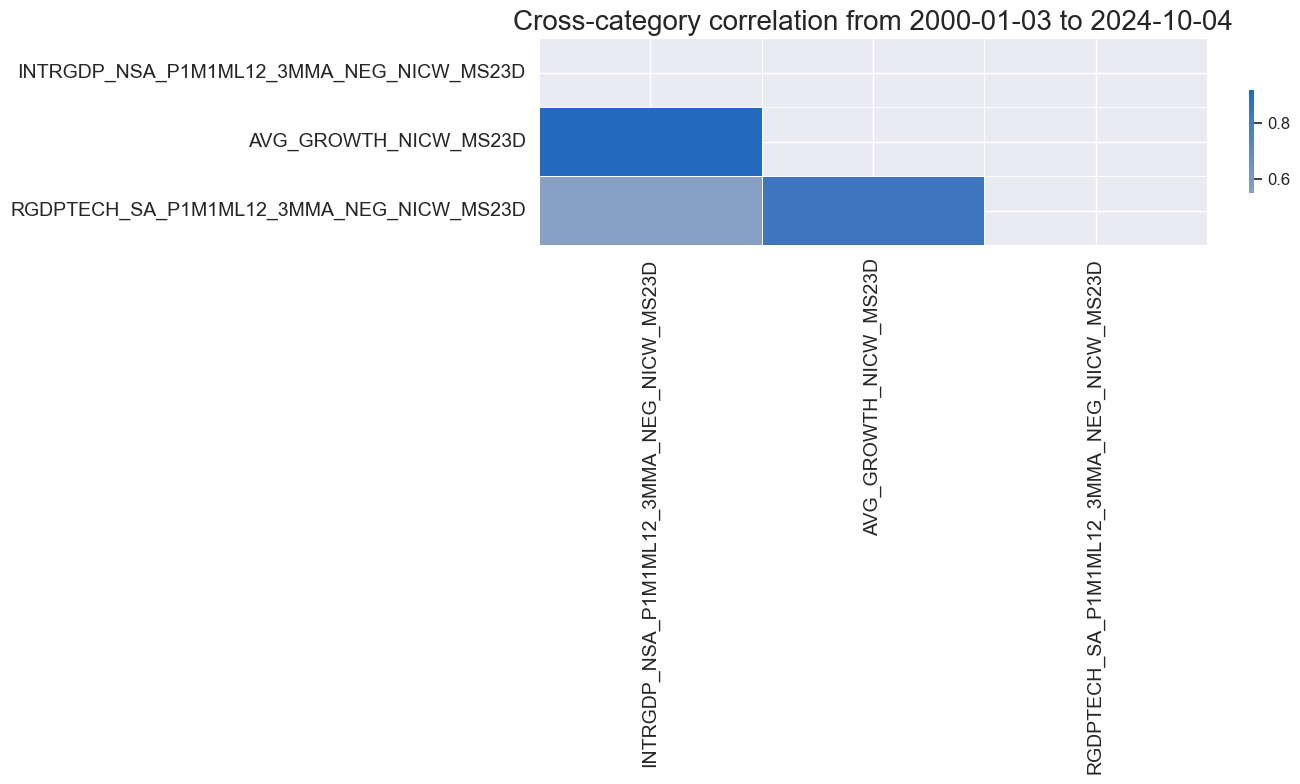
msp.correl_matrix(
    dfx,
    xcats=xcatx,
    cids="USD",
    start="2000-01-01",
    cluster=True,
    freq="M",
)

Inflation #
inf_nic = [xc + nic_agg for xc in pe_feats if xc.split('_')[0] in [x.split('_')[0] for x in inflation]]
xcatx = inf_nic

dfa = msp.linear_composite(
    df=dfx,
    xcats=xcatx,
    cids=["USD"],
    new_xcat="AVG_INFLATION" + nic_agg ,
)
dfx = msm.update_df(dfx, dfa)
xcatx = inf_nic + ["AVG_INFLATION" + nic_agg]

msp.view_timelines(
    dfx,
    xcats=xcatx,
    cids=["USD"],
    xcat_grid = True,
    same_y = True,
    ncol=3,
)

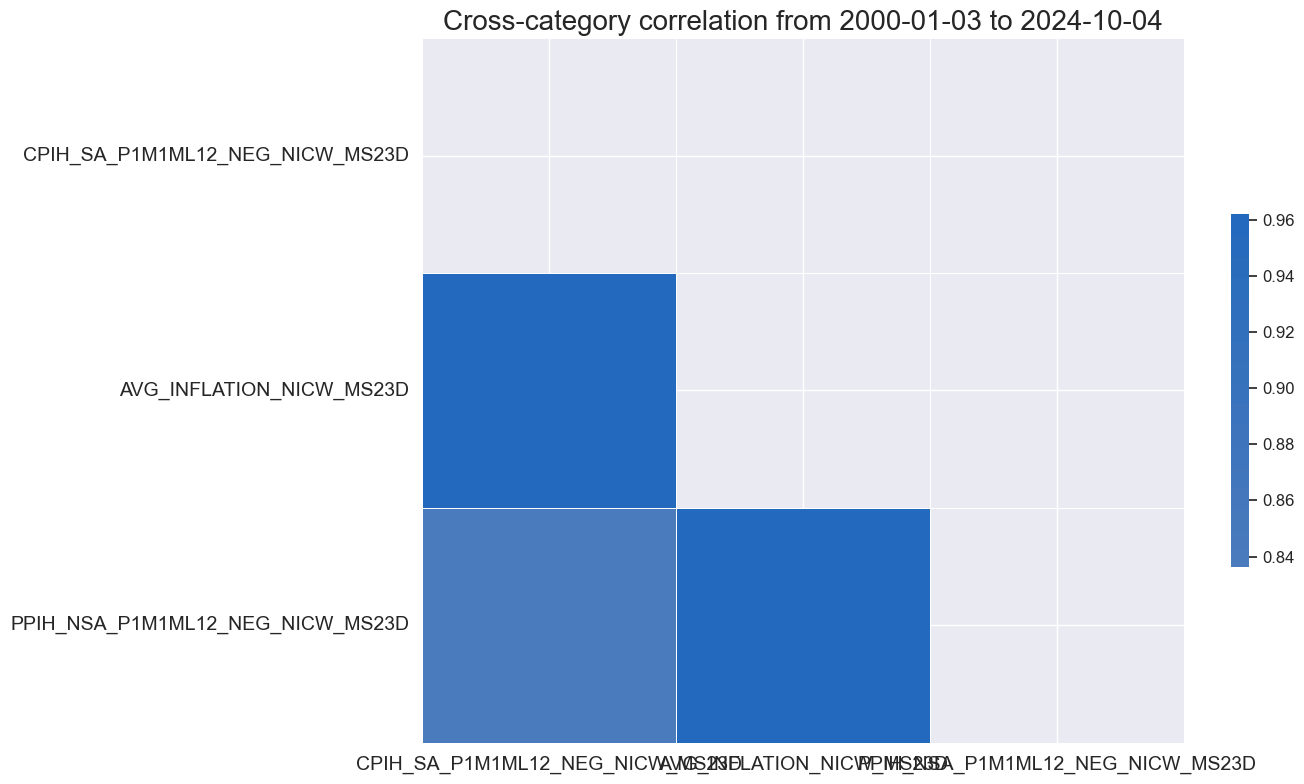
msp.correl_matrix(
    dfx,
    xcats=xcatx,
    cids="USD",
    start="2000-01-01",
    cluster=True,
    freq="M",
)

Labour market #
lab_nic = [xc + nic_agg for xc in pe_feats if xc.split('_')[0] in [x.split('_')[0] for x in labour]]
xcatx = lab_nic

dfa = msp.linear_composite(
    df=dfx,
    xcats=xcatx,
    cids=["USD"],
    new_xcat="AVG_LABOUR" + nic_agg ,
)
dfx = msm.update_df(dfx, dfa)
xcatx = lab_nic + ["AVG_LABOUR" + nic_agg]

msp.view_timelines(
    dfx,
    xcats=xcatx,
    cids=["USD"],
    xcat_grid = True,
    same_y = True,
    ncol=3,
)

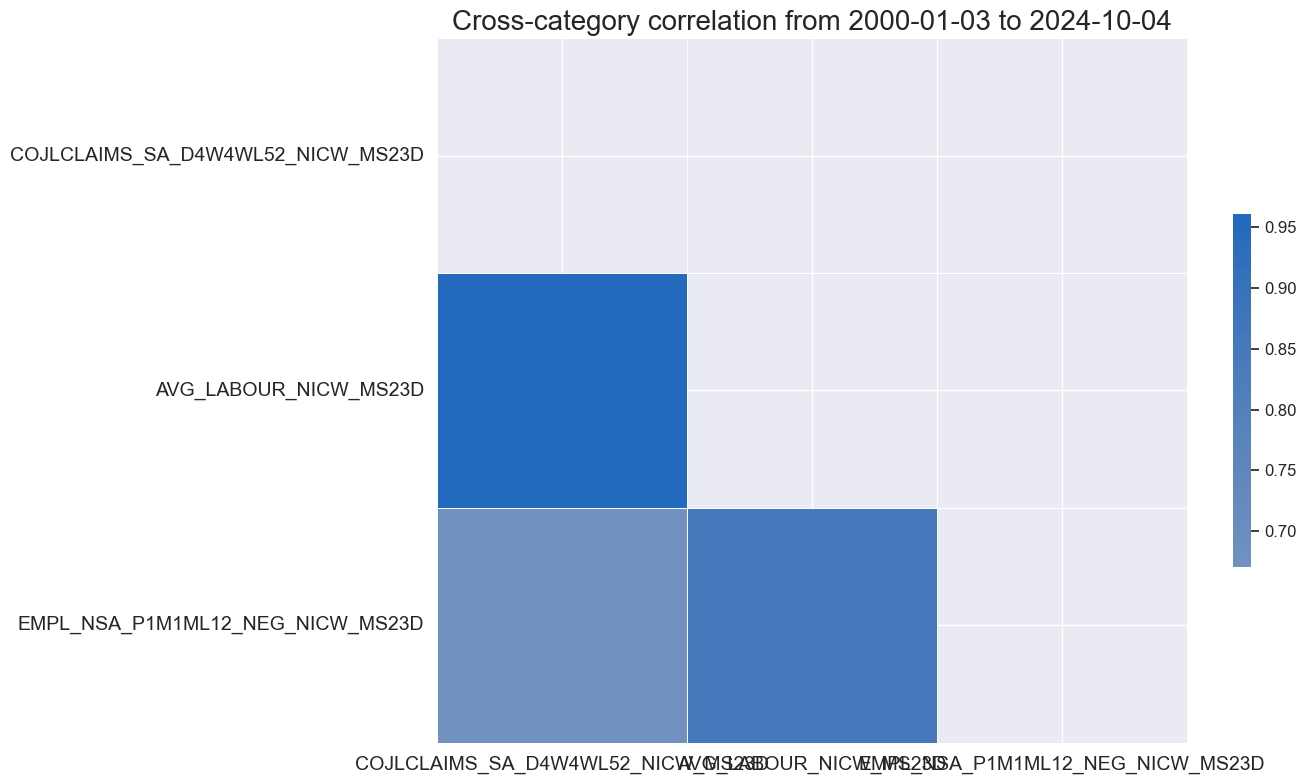
msp.correl_matrix(
    dfx,
    xcats=xcatx,
    cids="USD",
    start="2000-01-01",
    cluster=True,
    freq="M"
)

Cross-group aggregation #
groups = ["GROWTH", "INFLATION", "LABOUR"]

xcatx = [f"AVG_{g}{nic_agg}" for g in groups]
dfa = msp.linear_composite(
    df=dfx,
    xcats=xcatx,
    cids=["USD"],
    new_xcat=f"AVG_ALL{nic_agg}",
)
dfx = msm.update_df(dfx, dfa)
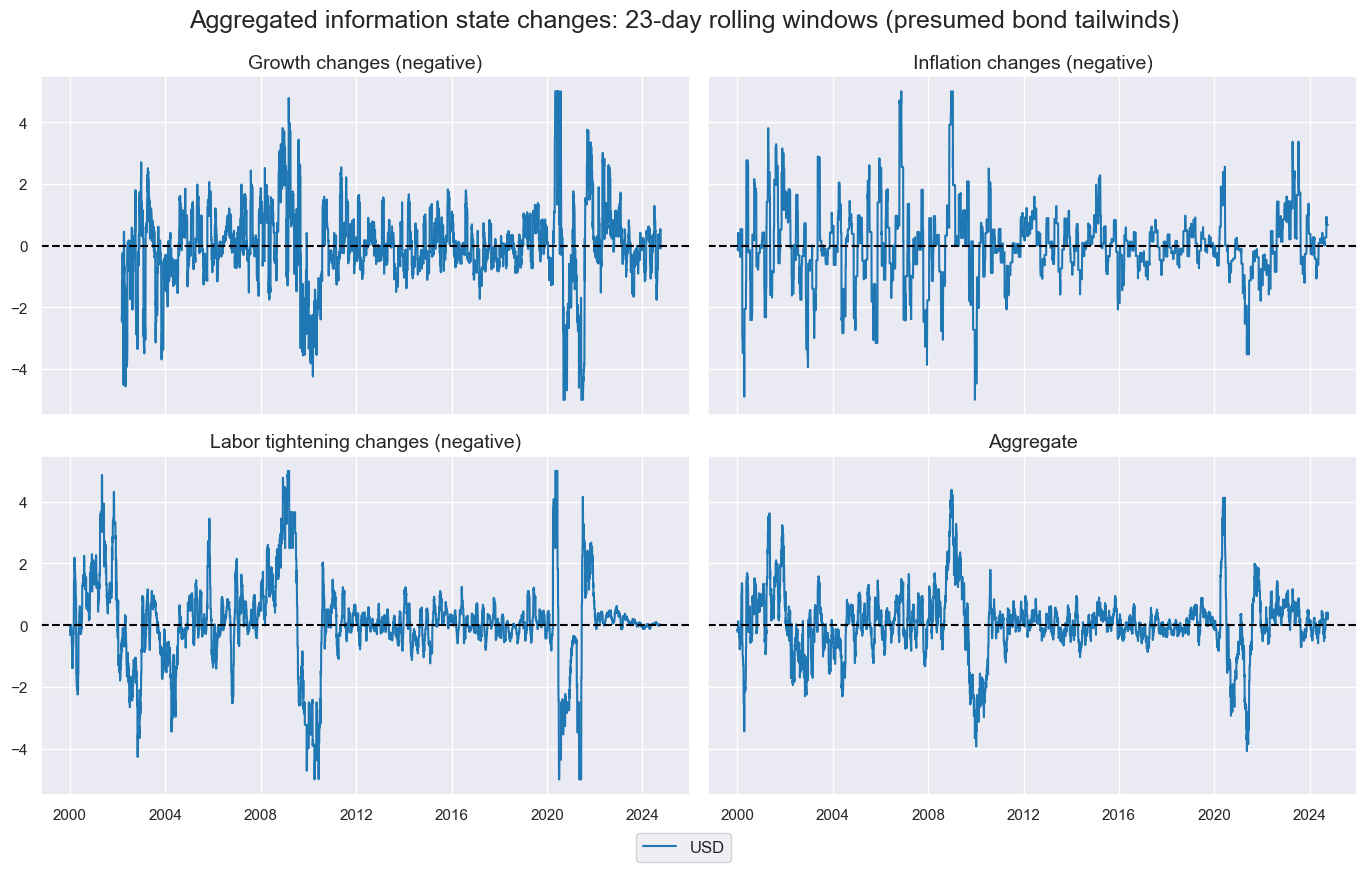
groups = ["GROWTH", "INFLATION", "LABOUR"]
xcatx = [f"AVG_{g}{nic_agg}" for g in groups + ["ALL"]]

msp.view_timelines(
    dfx,
    xcats=xcatx,
    cids=["USD"],
    xcat_grid = True,
    ncol=2,
    same_y = True,
    title="Aggregated information state changes: 23-day rolling windows (presumed bond tailwinds)",
    xcat_labels=["Growth changes (negative)", "Inflation changes (negative)", "Labor tightening changes (negative)", "Aggregate"]
)

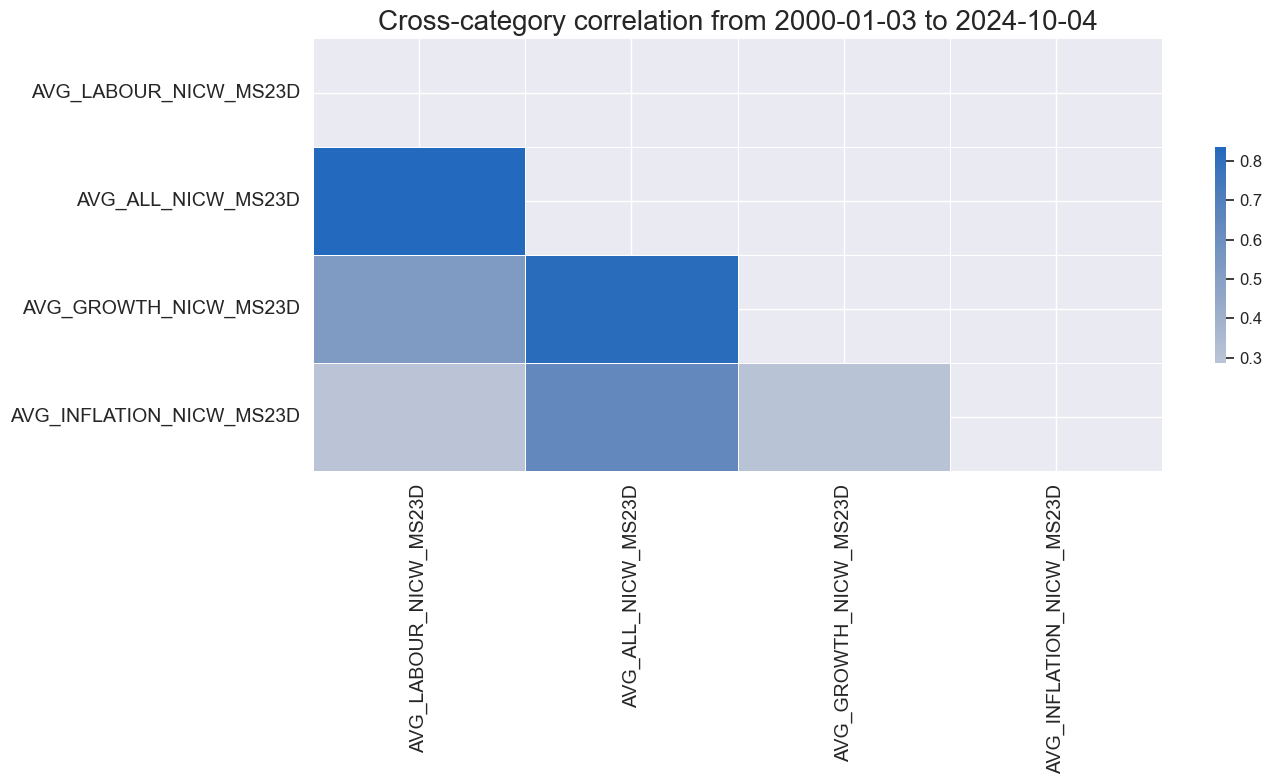
msp.correl_matrix(
    dfx,
    xcats=xcatx,
    cids="USD",
    start="2000-01-01",
    cluster=True,
    freq="M"
)
Treasury correlations #
nic_agg = "_NICW_MS23D"

dict_groups = {
    "sigx": [f"AVG_{g}{nic_agg}" for g in ["ALL"] + groups],
    "ret": "GB10YXR_NSA",
    "cidx": ["USD"],
    "freq": "M",
    "start": "2000-01-01",
    "black": None,
    "srr": None,
    "pnls": None,
}
dix = dict_groups

sigx = dix["sigx"]
ret = dix["ret"]
cidx = dix["cidx"]
freq = dix["freq"]
start = dix["start"]

catregs = {}
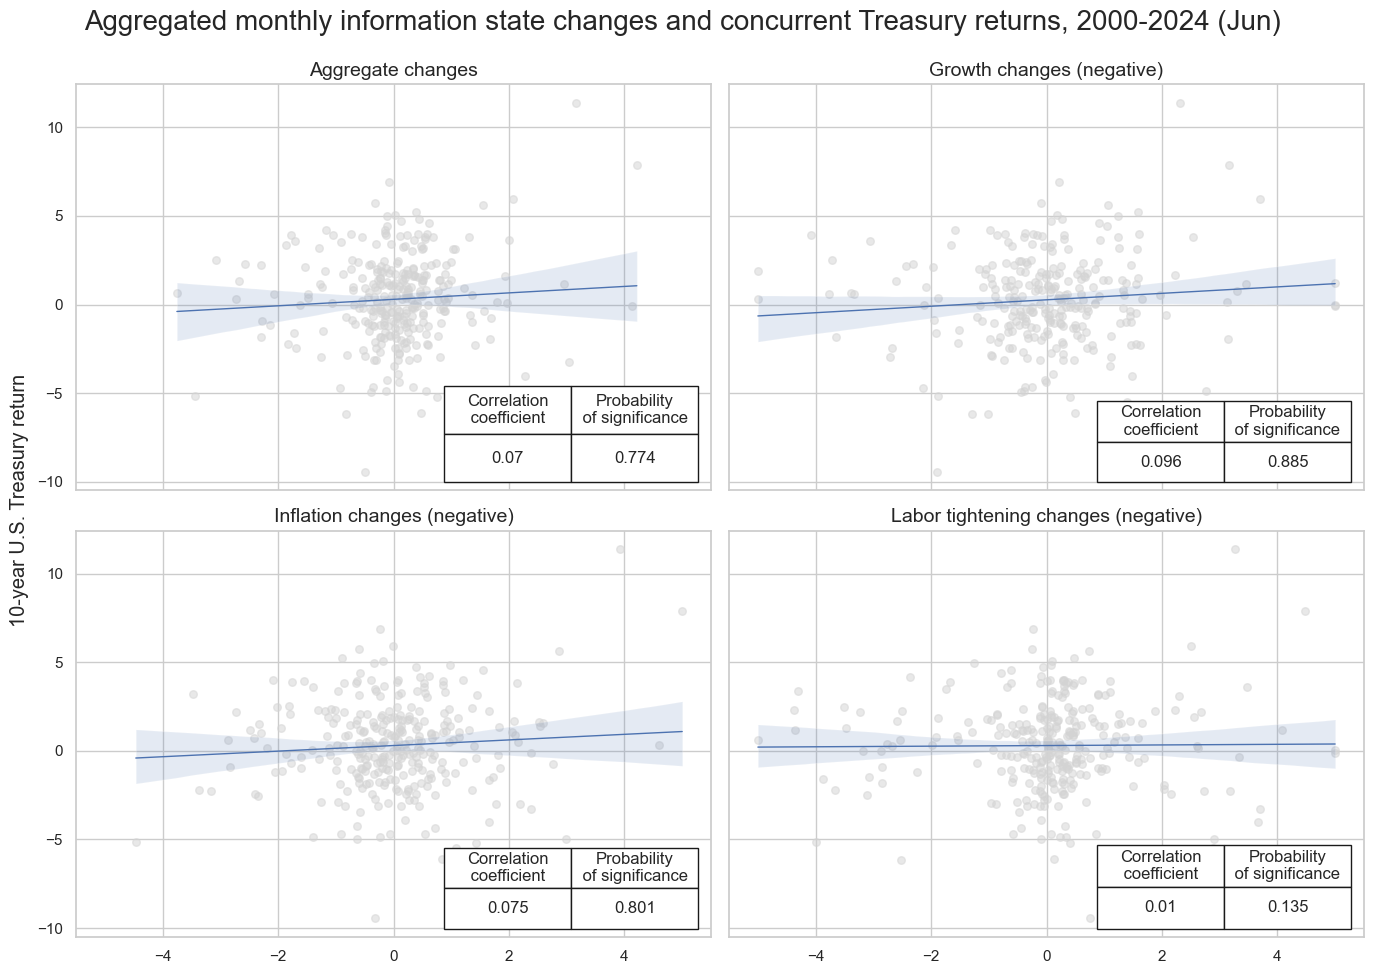
for sig in sigx:
    catregs[sig] = msp.CategoryRelations(
        dfx,
        xcats=[sig, ret],
        cids=cidx,
        freq=freq,
        lag=0,
        xcat_aggs=["last", "sum"],
        start=start,
    )

msv.multiple_reg_scatter(
    cat_rels=[v for k, v in catregs.items()],
    ncol=2,
    nrow=2,
    figsize=(14, 10),
    title="Aggregated monthly information state changes and concurrent Treasury returns, 2000-2024 (Jun)",
    title_xadj=0.5,
    title_yadj=0.99,
    title_fontsize=20,
    xlab=None,
    ylab="10-year U.S. Treasury return",
    coef_box="lower right",
    single_chart=True,
    subplot_titles=[
        "Aggregate changes",
        "Growth changes (negative)",
        "Inflation changes (negative)",
        "Labor tightening changes (negative)",
    ],
)
dix = dict_groups

sigx = dix['sigx']
ret = dix['ret']
cidx = dix["cidx"]
freq = dix["freq"]
start = dix["start"]

catregs = {}
for sig in sigx:
    catregs[sig] = msp.CategoryRelations(
        dfx,
        xcats=[sig, ret],
        cids=cidx,
        freq=freq,
        lag=1,
        xcat_aggs=["last", "sum"],
        start=start,
    )

msv.multiple_reg_scatter(
    cat_rels=[v for k, v in catregs.items()],
    ncol=2,
    nrow=2,
    figsize=(14, 10),
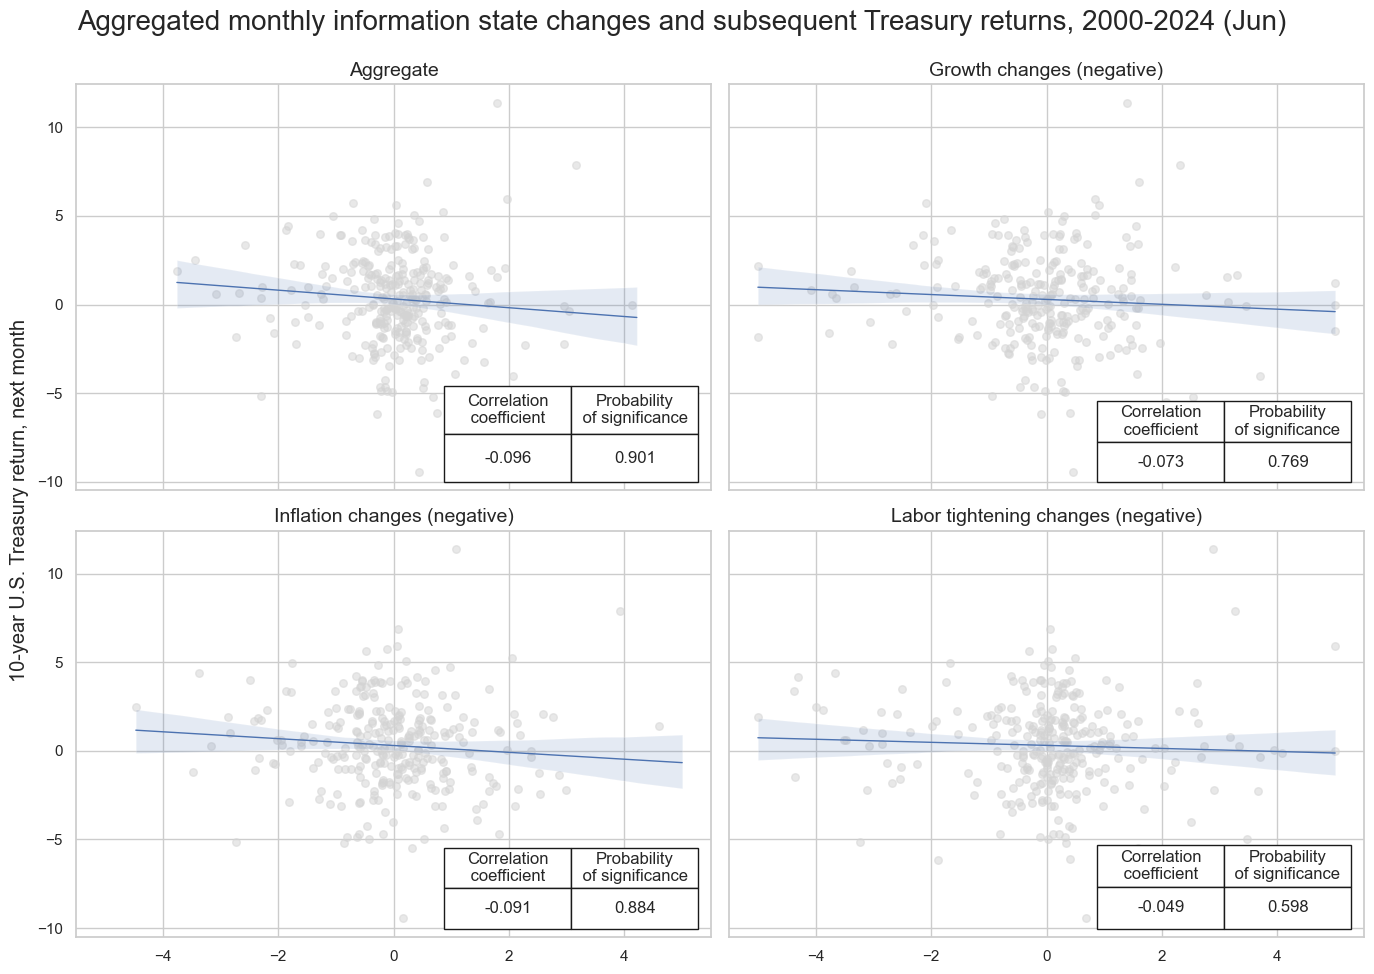
    title="Aggregated monthly information state changes and subsequent Treasury returns, 2000-2024 (Jun)",
    title_xadj=0.5,
    title_yadj=0.99,
    title_fontsize=20,
    xlab=None,
    ylab="10-year U.S. Treasury return, next month",
    coef_box="lower right",
    single_chart=True,
    subplot_titles=[
        "Aggregate",
        "Growth changes (negative)",
        "Inflation changes (negative)",
        "Labor tightening changes (negative)",
    ],
)
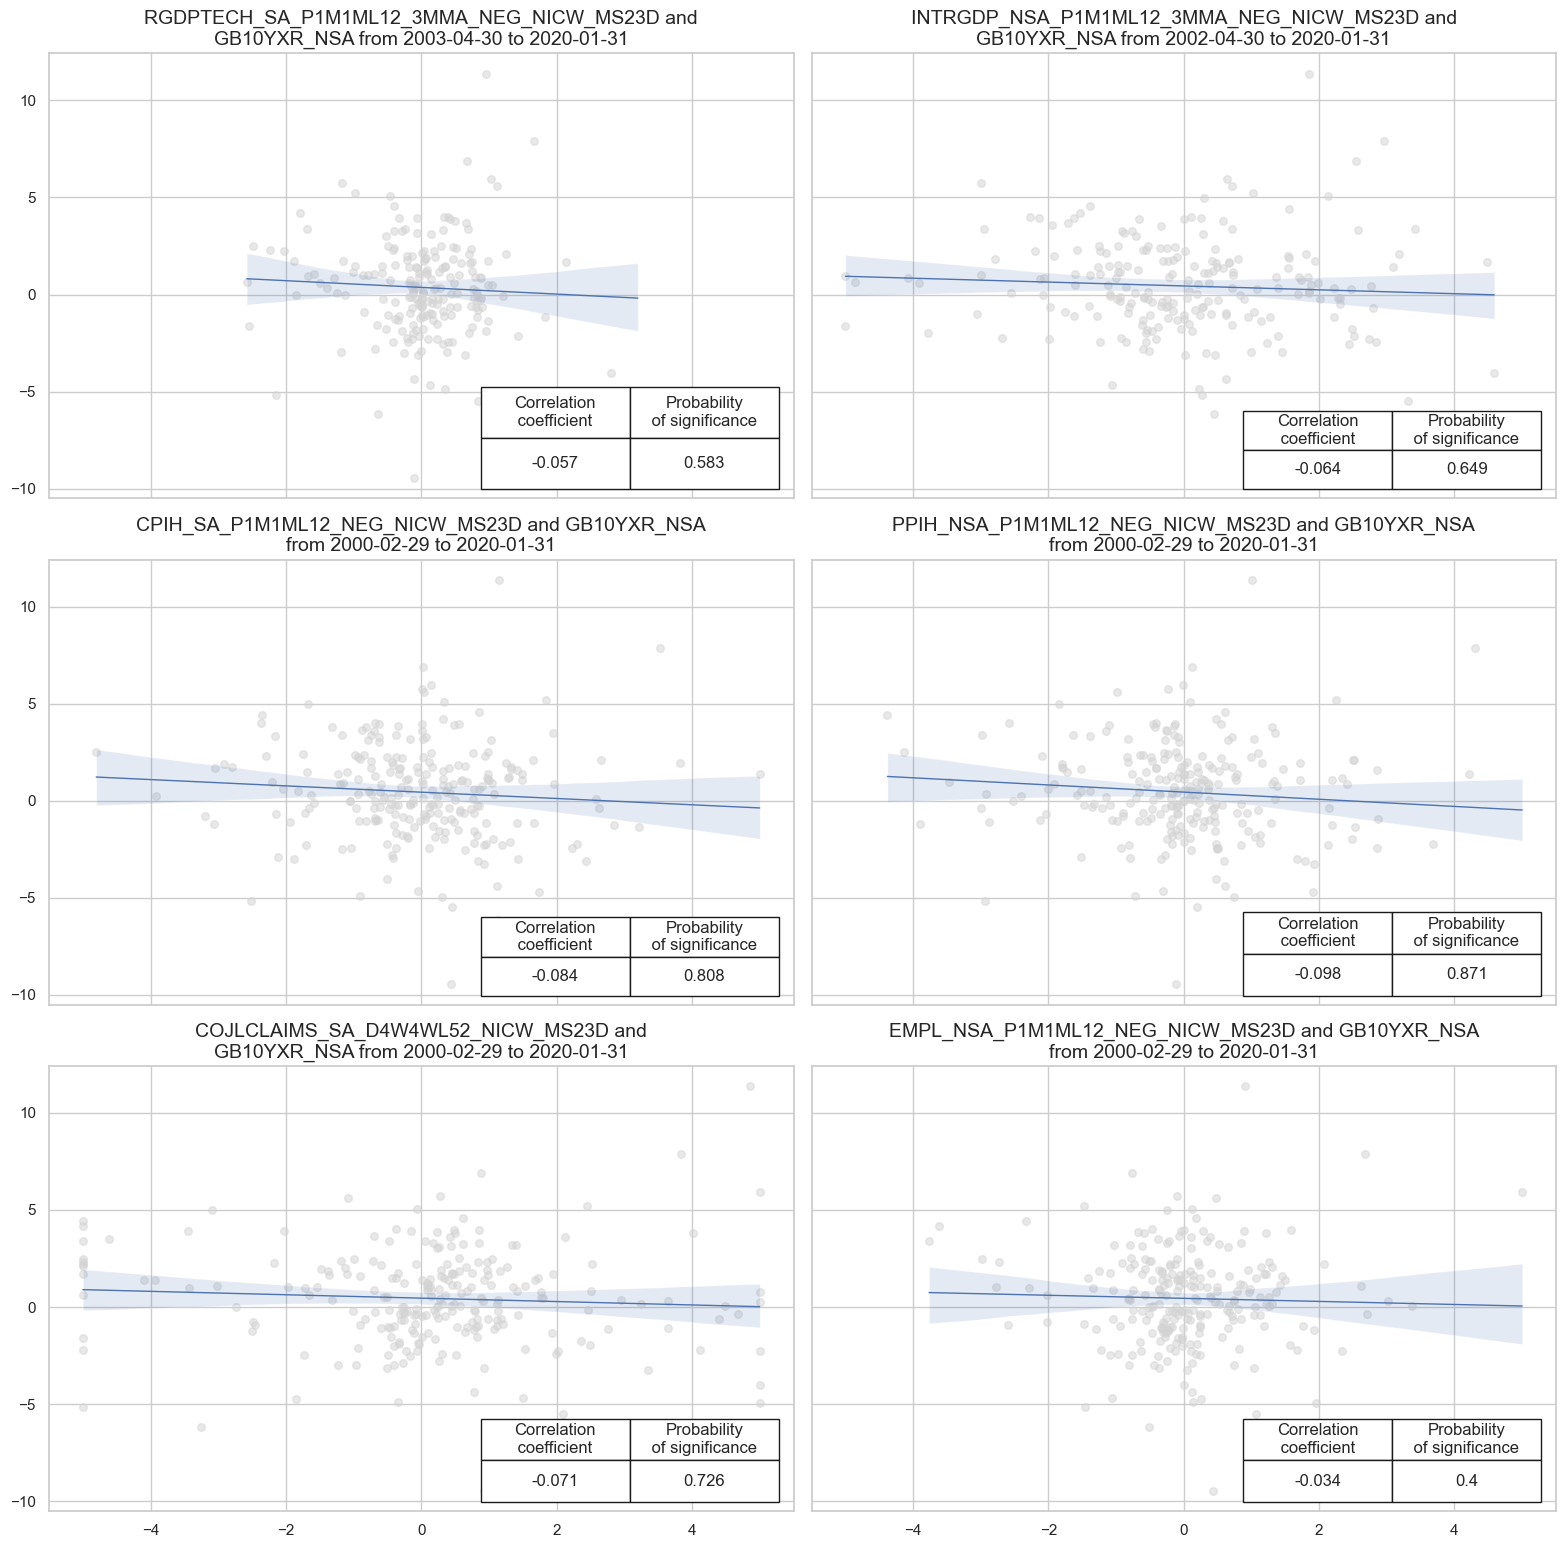
xcatx= growth_nic + inf_nic + lab_nic

dict_all = {
    "sigx": xcatx,
    "ret": "GB10YXR_NSA",
    "cidx": ["USD"],
    "freq": "M",
    "start": "2000-01-01",
    "black": None,
    "srr": None,
    "pnls": None,
}
dix = dict_all

sigx = dix['sigx']
ret = dix['ret']
cidx = dix["cidx"]
freq = dix["freq"]
start = dix["start"]

catregs = {}
for sig in sigx:
    catregs[sig] = msp.CategoryRelations(
        dfx,
        xcats=[sig, ret],
        cids=cidx,
        freq=freq,
        lag=0,
        xcat_aggs=["last", "sum"],
        start=start,
        end="2020-01-01"
    )

msv.multiple_reg_scatter(
    cat_rels=[v for k, v in catregs.items()],
    ncol=2,
    nrow=3,
    figsize=(16, 16),
    title=None,
    title_xadj=0.5,
    title_yadj=0.99,
    title_fontsize=12,
    xlab=None,
    ylab=None,
    coef_box="lower right",
    single_chart=True,
    # separator=2012,
)
dix = dict_all

sigx = dix['sigx']
ret = dix['ret']
cidx = dix["cidx"]
freq = dix["freq"]
start = dix["start"]

catregs = {}
for sig in sigx:
    catregs[sig] = msp.CategoryRelations(
        dfx,
        xcats=[sig, ret],
        cids=cidx,
        freq=freq,
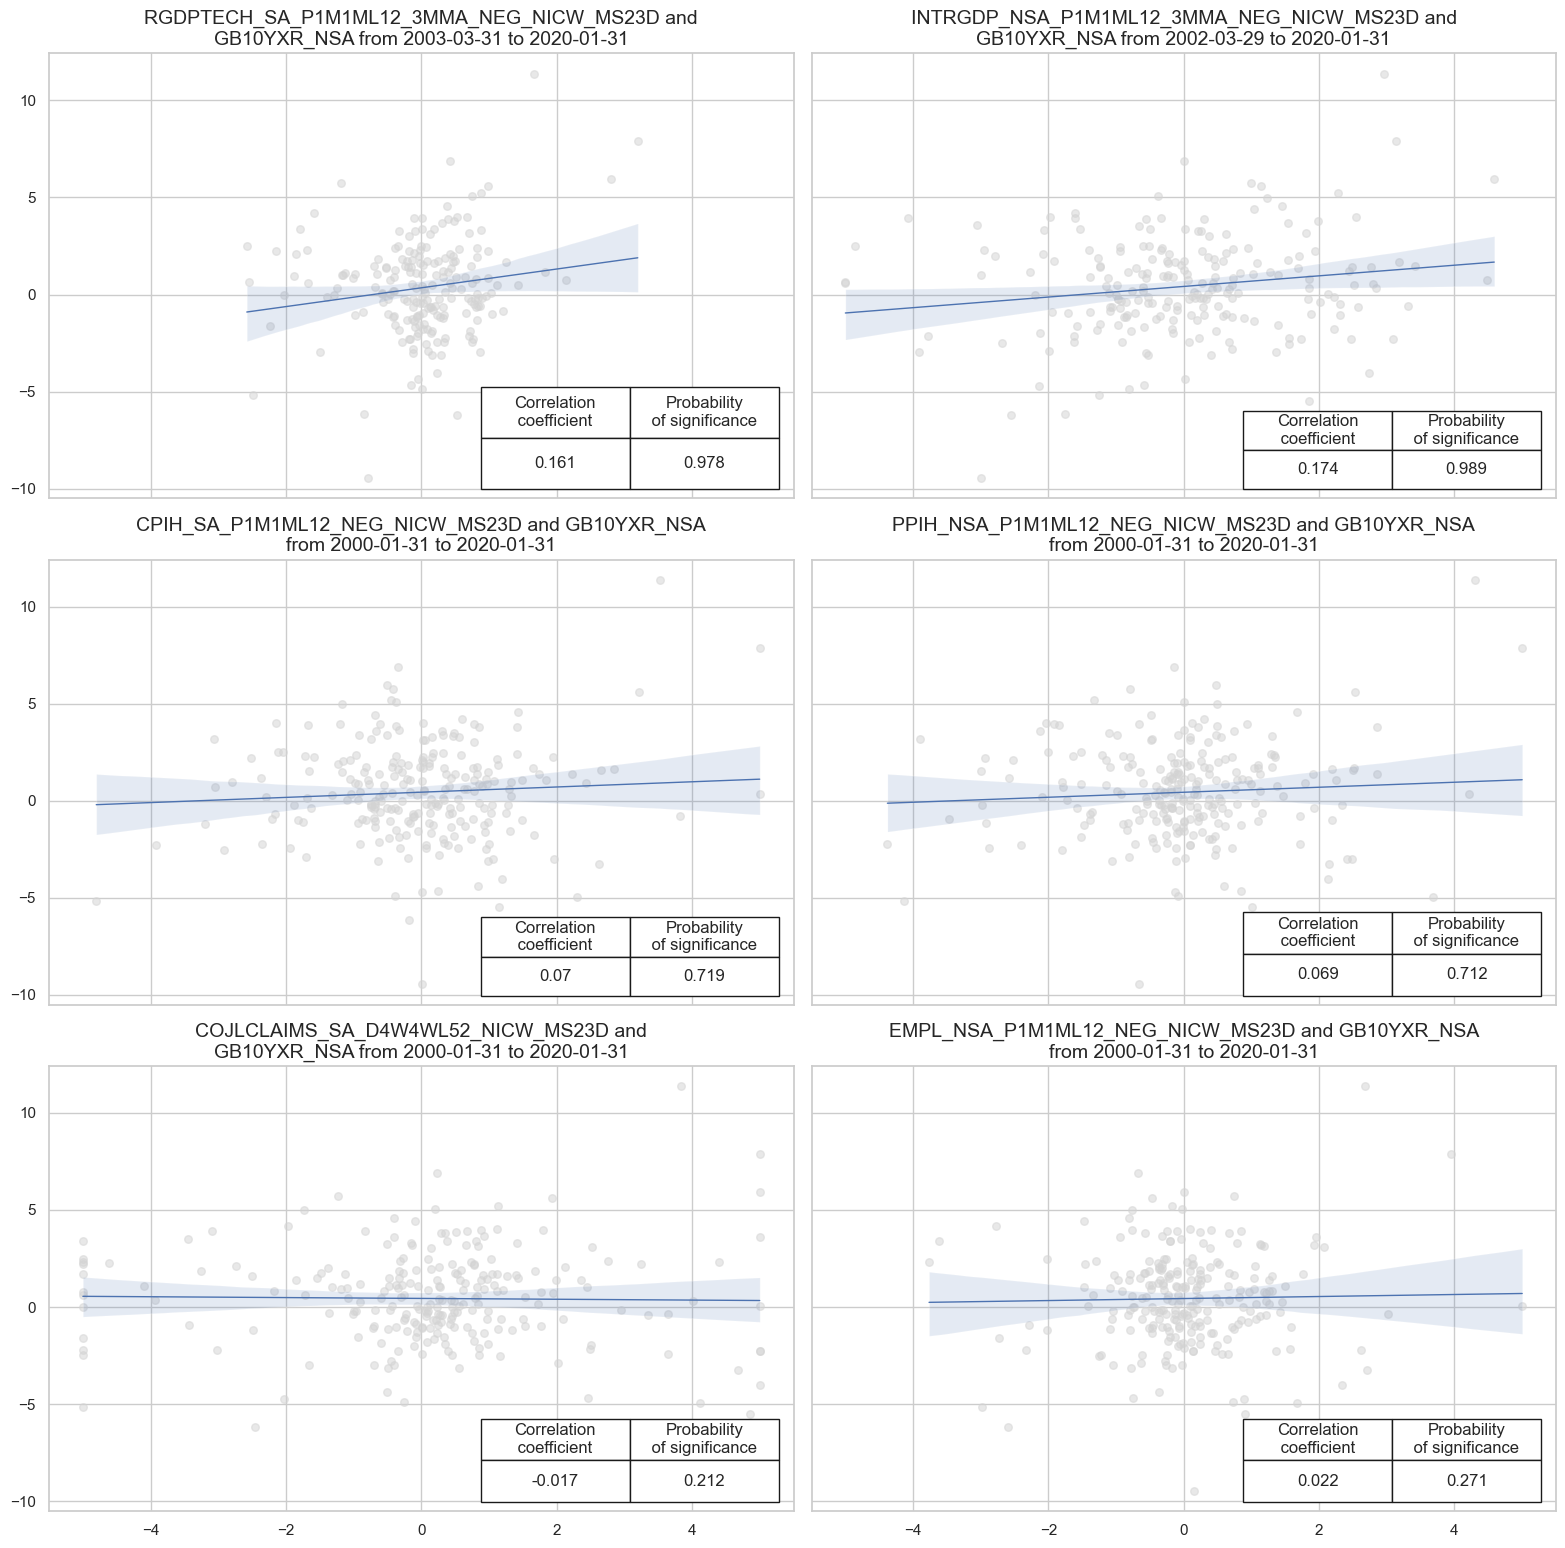
        lag=1,
        xcat_aggs=["last", "sum"],
        start=start,
        end="2020-01-01"
    )

msv.multiple_reg_scatter(
    cat_rels=[v for k, v in catregs.items()],
    ncol=2,
    nrow=3,
    figsize=(16, 16),
    title=None,
    title_xadj=0.5,
    title_yadj=0.99,
    title_fontsize=12,
    xlab=None,
    ylab=None,
    coef_box="lower right",
    single_chart=True,
    # separator=2012,
)
