Estimating EM sovereign risk premia #
Get packages and JPMaQS data #
Setup and imports #
# !pip install macrosynergy --upgrade
DQ_CLIENT_ID: str = "your_client_id"
DQ_CLIENT_SECRET: str = "your_client_secret"
# Constants and credentials
import os

REQUIRED_VERSION: str = "1.2.2"
DQ_CLIENT_ID: str = os.getenv("DQ_CLIENT_ID")
DQ_CLIENT_SECRET: str = os.getenv("DQ_CLIENT_SECRET")
PROXY = {}  # Configure if behind corporate firewall
START_DATE: str = "1998-01-01"
import macrosynergy as msy

msy.check_package_version(required_version=REQUIRED_VERSION)
# If version check fails: pip install macrosynergy --upgrade
if not DQ_CLIENT_ID or not DQ_CLIENT_SECRET:
    raise ValueError(
        "Missing DataQuery credentials." \
        "Please set DQ_CLIENT_ID and DQ_CLIENT_SECRET as environment variables or insert them directly in the notebook."
    )
import numpy as np
import pandas as pd
from pandas import Timestamp
import matplotlib.pyplot as plt
import os
import io

from datetime import datetime

import macrosynergy.management as msm
import macrosynergy.panel as msp
import macrosynergy.signal as mss
import macrosynergy.pnl as msn
import macrosynergy.visuals as msv

from macrosynergy.download import JPMaQSDownload
from macrosynergy.panel.adjust_weights import adjust_weights
import warnings

pd.set_option('display.width', 400)

warnings.simplefilter("ignore")
Data selection and download #
cids_fc_latam = [  # Latam foreign currency debt countries
    "BRL",
    "CLP",
    "COP",
    "DOP",
    "MXN",
    "PEN",
    "UYU",
]
cids_fc_emeu = [  # EM Europe foreign currency debt countries
    "HUF",
    "PLN",
    "RON",
    "RUB",
    "RSD",
    "TRY",
]
cids_fc_meaf = [  # Middle-East and Africa foreign currency debt countries
    "AED",
    "EGP",
    "NGN",
    "OMR",
    "QAR",
    "ZAR",
    "SAR",
]
cids_fc_asia = [  # Asia foreign currency debt countries
    "CNY",
    "IDR",
    "INR",
    "PHP",
]

cids_fc = sorted(
    list(
        set(cids_fc_latam + cids_fc_emeu + cids_fc_meaf + cids_fc_asia)
    )
)
cids_emxfc = ["CZK", "ILS", "KRW", "MYR", "SGD", "THB", "TWD"]

cids_em = sorted(cids_fc + cids_emxfc)
# Category tickers

# Features
govfin = [
    "GGOBGDPRATIO_NSA",
    "GGOBGDPRATIONY_NSA",
    "GGDGDPRATIO_NSA",
]

xbal = [
    "CABGDPRATIO_NSA_12MMA",
    "MTBGDPRATIO_NSA_12MMA",
]

xliab = [
    "NIIPGDP_NSA_D1Mv2YMA",
    "NIIPGDP_NSA_D1Mv5YMA",
    "IIPLIABGDP_NSA_D1Mv2YMA",
    "IIPLIABGDP_NSA_D1Mv5YMA",
]

xdebt = [
    "ALLIFCDSGDP_NSA",
    "GGIFCDSGDP_NSA",
]

GOVRISK = [
    "ACCOUNTABILITY_NSA",
    "POLSTAB_NSA",
    "CORRCONTROL_NSA",
]
growth = [
    'RGDP_SA_P1Q1QL4_20QMA',
    "RGDP_SA_P1Q1QL4"
]

infl = [
    "CPIC_SA_P1M1ML12",
    "CPIH_SA_P1M1ML12",
]


risk_metrics = [
    "LTFCRATING_NSA",
    "LTLCRATING_NSA",
    "FCBICRY_NSA",
    "FCBICRY_VT10",
    "CDS05YSPRD_NSA",
    "CDS05YXRxEASD_NSA",
]

# Targets

rets = ["FCBIR_NSA", "FCBIXR_NSA", "FCBIXR_VT10"]

# Benchmark returns

bms = ["USD_EQXR_NSA", "UHY_CRXR_NSA", "UIG_CRXR_NSA"]

# Create ticker list

xcats = govfin + xbal + xliab + xdebt + GOVRISK + growth + infl + risk_metrics + rets
tickers = [cid + "_" + xcat for cid in cids_em for xcat in xcats] + bms

print(f"Maximum number of tickers is {len(tickers)}")
Maximum number of tickers is 840
# Download macro-quantamental indicators from JPMaQS via the DataQuery API

with JPMaQSDownload(
    client_id=DQ_CLIENT_ID,
    client_secret=DQ_CLIENT_SECRET,
    proxy=PROXY
) as downloader:
    df: pd.DataFrame = downloader.download(
        tickers=tickers,
        start_date=START_DATE,
        metrics=["value",],
        suppress_warning=True,
        show_progress=True,
        report_time_taken=True,
        get_catalogue=True,
    )
Downloading the JPMAQS catalogue from DataQuery...
Downloaded JPMAQS catalogue with 25698 tickers.
Removed 84/840 expressions that are not in the JPMaQS catalogue.
Downloading data from JPMaQS.
Timestamp UTC:  2025-10-08 12:16:14
Connection successful!
Requesting data: 100%|██████████| 38/38 [00:07<00:00,  4.94it/s]
Downloading data: 100%|██████████| 38/38 [00:25<00:00,  1.47it/s]
Time taken to download data: 	35.13 seconds.
Some expressions are missing from the downloaded data. Check logger output for complete list.
1 out of 756 expressions are missing. To download the catalogue of all available expressions and filter the unavailable expressions, set `get_catalogue=True` in the call to `JPMaQSDownload.download()`.
# Preserve original downloaded data for debugging and comparison
dfx = df.copy()
dfx.info()
<class 'pandas.core.frame.DataFrame'>
RangeIndex: 4714764 entries, 0 to 4714763
Data columns (total 4 columns):
 #   Column     Dtype
---  ------     -----
 0   real_date  datetime64[ns]
 1   cid        object
 2   xcat       object
 3   value      float64
dtypes: datetime64[ns](1), float64(1), object(2)
memory usage: 143.9+ MB
Availability checks and blacklisting #
Availability #
xcatx = govfin
msm.check_availability(df=dfx, xcats=xcatx, cids=cids_em, missing_recent=False)
xcatx = xbal
msm.check_availability(df=dfx, xcats=xcatx, cids=cids_em, missing_recent=False)

xcatx = xliab
msm.check_availability(df=dfx, xcats=xcatx, cids=cids_em, missing_recent=False)
xcatx = xdebt
msm.check_availability(df=dfx, xcats=xcatx, cids=cids_em, missing_recent=False)

xcatx = risk_metrics
msm.check_availability(df=dfx, xcats=xcatx, cids=cids_em, missing_recent=False)
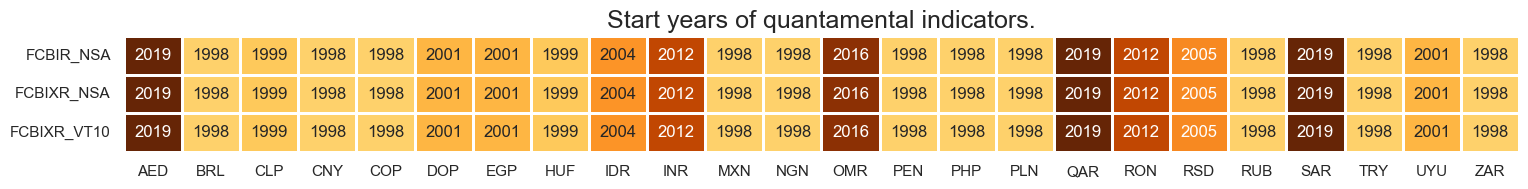
xcatx = rets
msm.check_availability(df=dfx, xcats=xcatx, cids=cids_em, missing_recent=False)
xcatx = growth
msm.check_availability(df=dfx, xcats=xcatx, cids=cids_em, missing_recent=False)

xcatx = infl
msm.check_availability(df=dfx, xcats=xcatx, cids=cids_em, missing_recent=False)

Blacklist #
black_fc = {'RUB': [Timestamp('2022-02-01 00:00:00'), Timestamp('2035-02-26 00:00:00')]}
Macro risk score construction and checks #
Preparatory transformations #
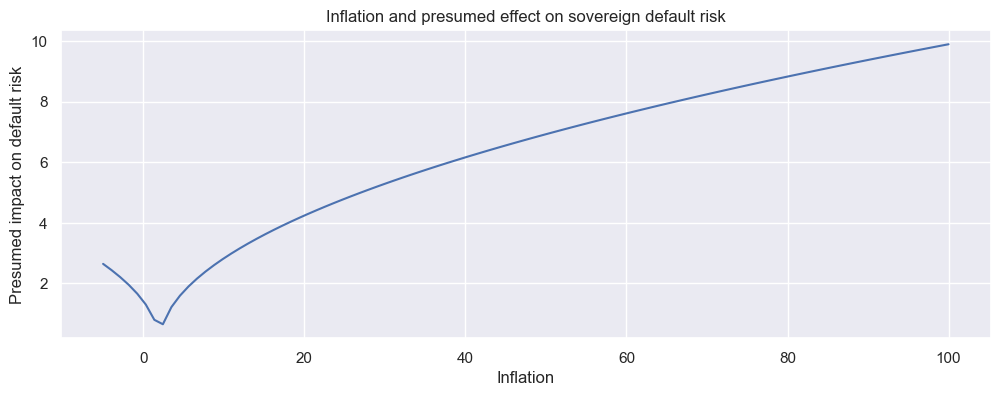
# Non-linear inflation effect theory

x = np.linspace(-5, 100, 100)
y = np.power(abs(x - 2), 1/2)

plt.figure(figsize=(12, 4))
plt.plot(x, y)
plt.title("Inflation and presumed effect on sovereign default risk")
plt.xlabel("Inflation")
plt.ylabel("Presumed impact on default risk")
plt.grid(True)
plt.show()
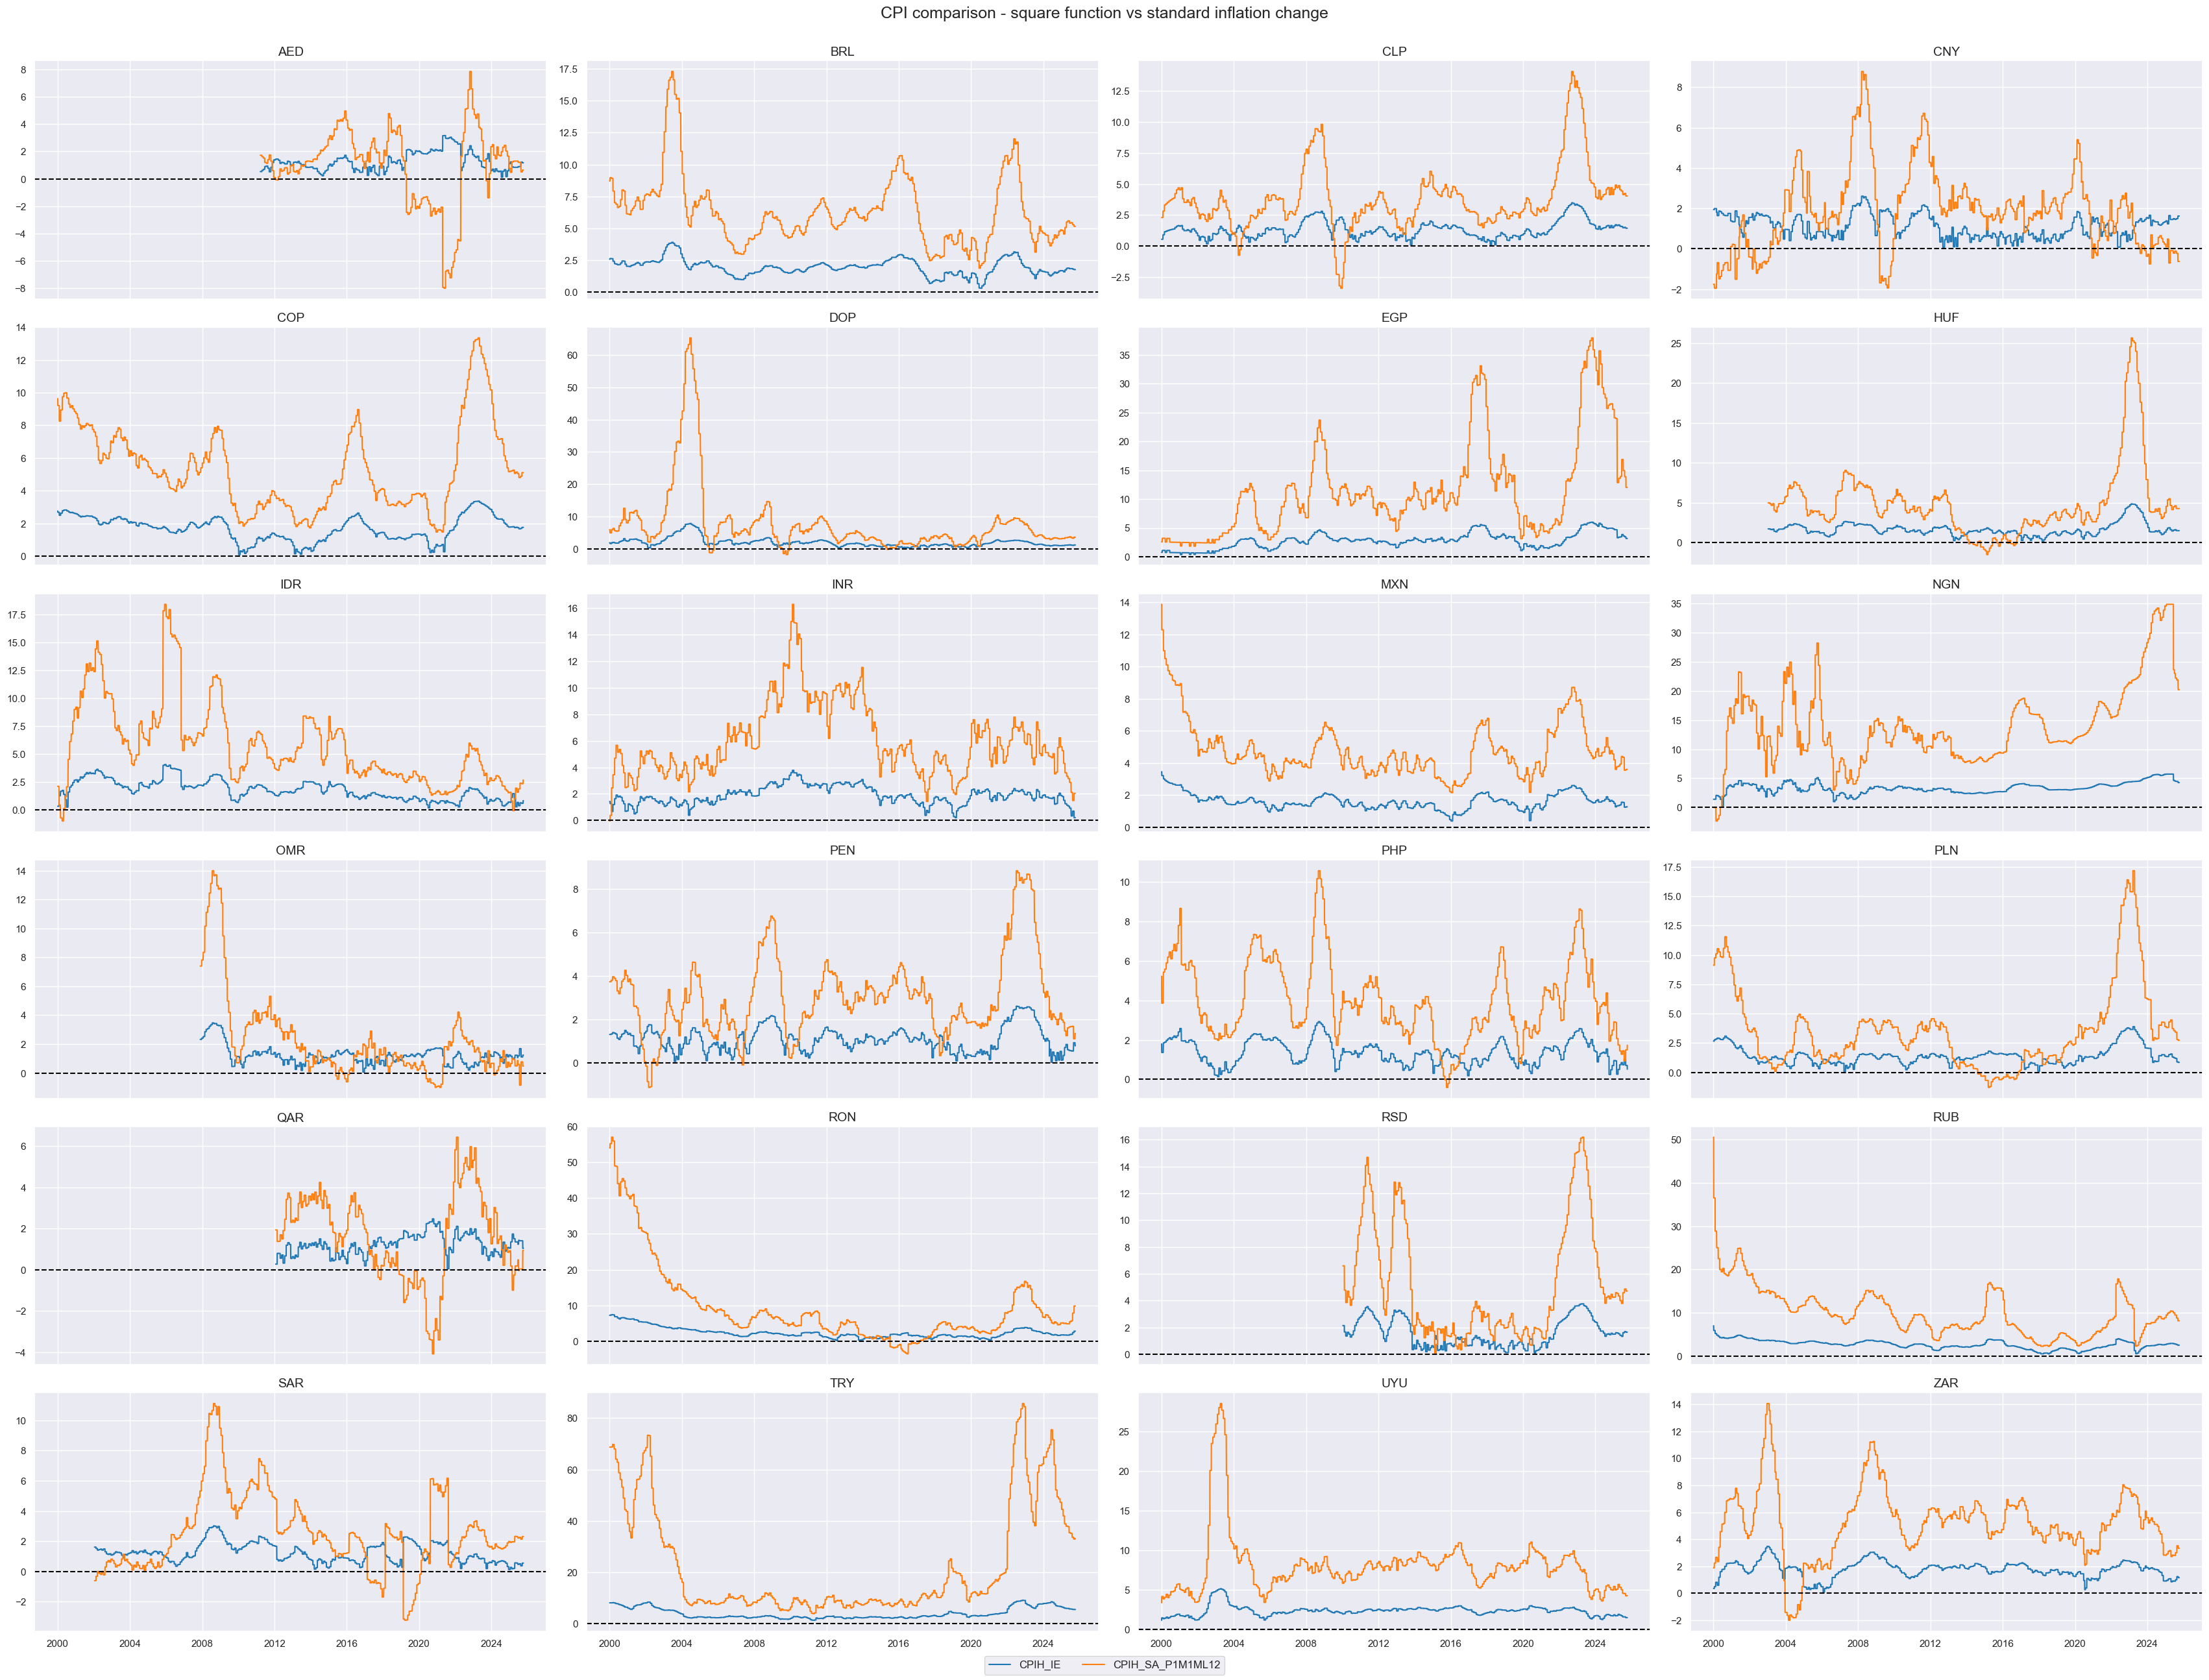
# Inflation effects

cidx = cids_fc
xcx = ["CPIH", "CPIC"]

calcs = [
    f"{xc}_IE = {xc}_SA_P1M1ML12.applymap(lambda x: np.power(abs(x - 2), 1/2))"
    for xc in xcx
]
dfa = msp.panel_calculator(dfx, calcs=calcs, cids=cidx)
dfx = msm.update_df(dfx, dfa)


xcatx = ["CPIH_IE", "CPIH_SA_P1M1ML12"]


msp.view_timelines(
    dfx,
    xcats=xcatx,
    cids=cidx,
    ncol=4,
    start="2000-01-01",
    title='CPI comparison - square function vs standard inflation change',
    aspect=2,
    same_y=False,
)
Macro risk scores #
Conceptual factor scores #
# Placeholder dictionaries

dict_factz = {}
dict_labels = {}
# Governing dictionary of quantamental indicators, neutral levels, and weightings
dict_macros = {
"GFINRISK":{
"GGOBGDPRATIO_NSA": ["median", "NEG", 1/3],
"GGOBGDPRATIONY_NSA": ["median", "NEG", 1/3],
"GGDGDPRATIO_NSA": ["median", "", 1/3],
},
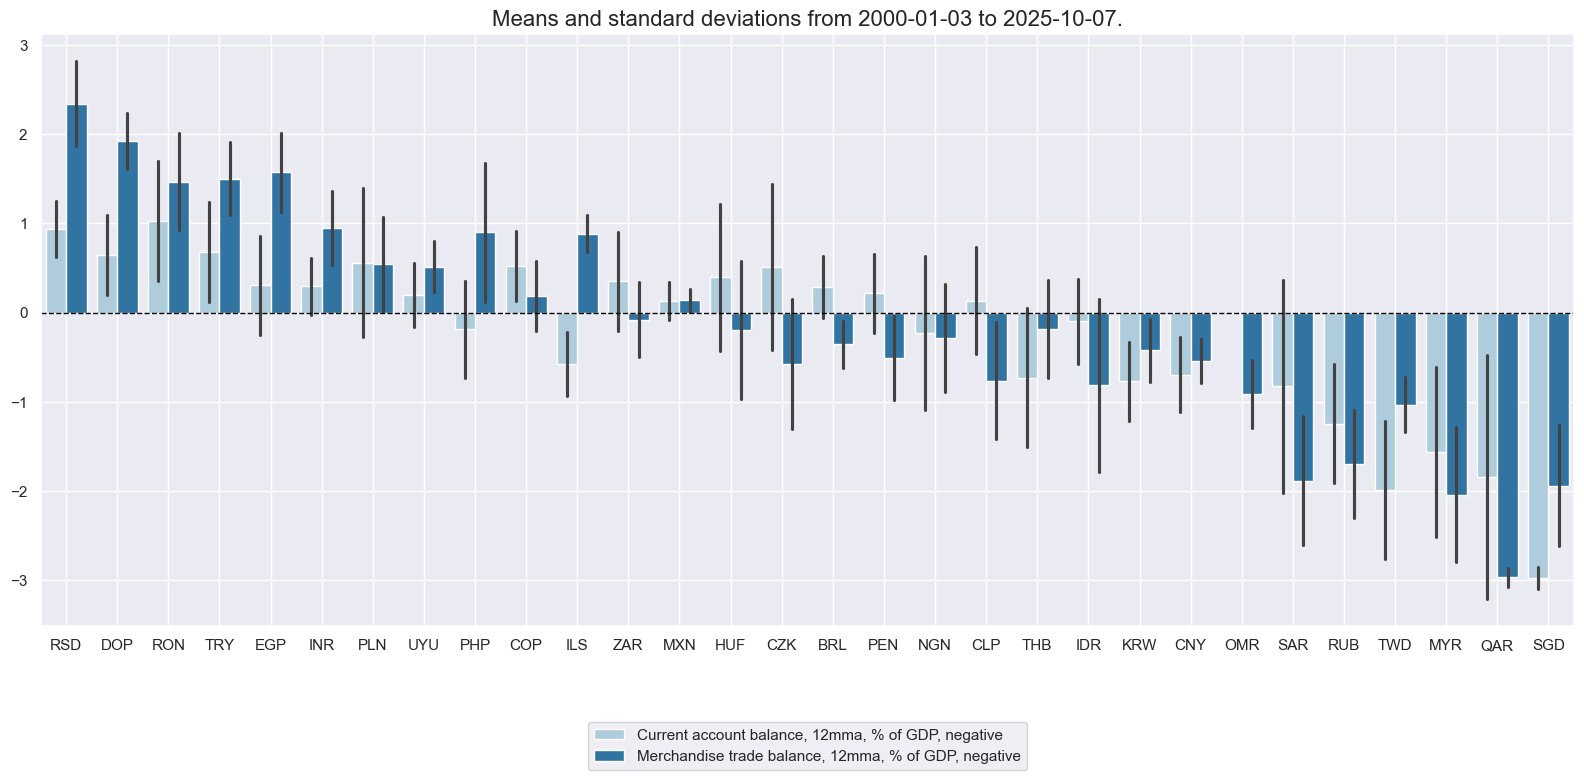
"XBALRISK":{
"CABGDPRATIO_NSA_12MMA": ["median", "NEG", 0.5],
"MTBGDPRATIO_NSA_12MMA": ["median", "NEG", 0.5],
},
"XLIABRISK":{
"NIIPGDP_NSA_D1Mv2YMA": ["median", "NEG", 0.25],
"NIIPGDP_NSA_D1Mv5YMA": ["median", "NEG", 0.25],
"IIPLIABGDP_NSA_D1Mv2YMA": ["median", "", 0.25],
"IIPLIABGDP_NSA_D1Mv5YMA": ["median", "", 0.25],
},
"XDEBTRISK":{
"ALLIFCDSGDP_NSA": ["median", "", 0.5],
"GGIFCDSGDP_NSA": ["median", "", 0.5],
},
"GOVRISK":{
"ACCOUNTABILITY_NSA": ["median", "NEG", 1/3],
"POLSTAB_NSA": ["median", "NEG", 1/3],
"CORRCONTROL_NSA": ["median", "NEG", 1/3],
},
"GROWTHRISK":{
"RGDP_SA_P1Q1QL4_20QMA": ["median", "NEG", 0.5],
"RGDP_SA_P1Q1QL4": ["median", "NEG", 0.5],
},
"INFLRISK":{
"CPIH_IE": ["median", "", 0.5],
"CPIC_IE": ["median", "", 0.5],
}
}
# Normalize all macro-quantamental categories based on the broad EM set

cidx = cids_em

for fact in dict_macros.keys():

    dict_fact = dict_macros[fact]
    xcatx = list(dict_fact.keys())

    dfa = pd.DataFrame(columns=list(dfx.columns))

    for xc in xcatx:

        postfix = dict_fact[xc][1]
        neutral = dict_fact[xc][0]

        dfaa = msp.make_zn_scores(
            dfx,
            xcat=xc,
            cids=cidx,
            sequential=True,
            min_obs=261 * 3,
            neutral=neutral,
            pan_weight=1,
            thresh=3,
            postfix="_" + postfix + "ZN",
            est_freq="m",
        )
        dfaa["value"] = dfaa["value"] * (1 if postfix == "" else -1)
        dfa = msm.update_df(dfa, dfaa)

    dict_factz[fact] = dfa["xcat"].unique()
    dfx = msm.update_df(dfx, dfa)
# Combine quantamental scores to conceptual scores

cidx = cids_em

for key, value in dict_factz.items():

    weights = [w[2] for w in list(dict_macros[key].values())]
    dfa = msp.linear_composite(
        dfx,
        xcats=value,
        cids=cidx,
        weights=weights,
        normalize_weights= True,
        complete_xcats=False,
        new_xcat=key,
    )

    dfx = msm.update_df(dfx, dfa)

for key in dict_factz.keys():

    dfa = msp.make_zn_scores(
        dfx,
        xcat=key,
        cids=cidx,
        sequential=True,
        min_obs=261 * 3,
        neutral="zero",
        pan_weight=1,
        thresh=3,
        postfix="_ZN",
        est_freq="m",
    )

    dfx = msm.update_df(dfx, dfa)

macroz = [fact + "_ZN" for fact in dict_factz.keys()]
dict_labels["GGOBGDPRATIO_NSA_NEGZN"] = "Excess government balance, % of GDP, current year, negative"
dict_labels["GGOBGDPRATIONY_NSA_NEGZN"] = "Excess government balance, % of GDP, next year, negative"
dict_labels["GGDGDPRATIO_NSA_ZN"] = "Excess general government debt ratio, % of GDP"
dict_labels["GFINRISK_ZN"] = "Government finances risk score"
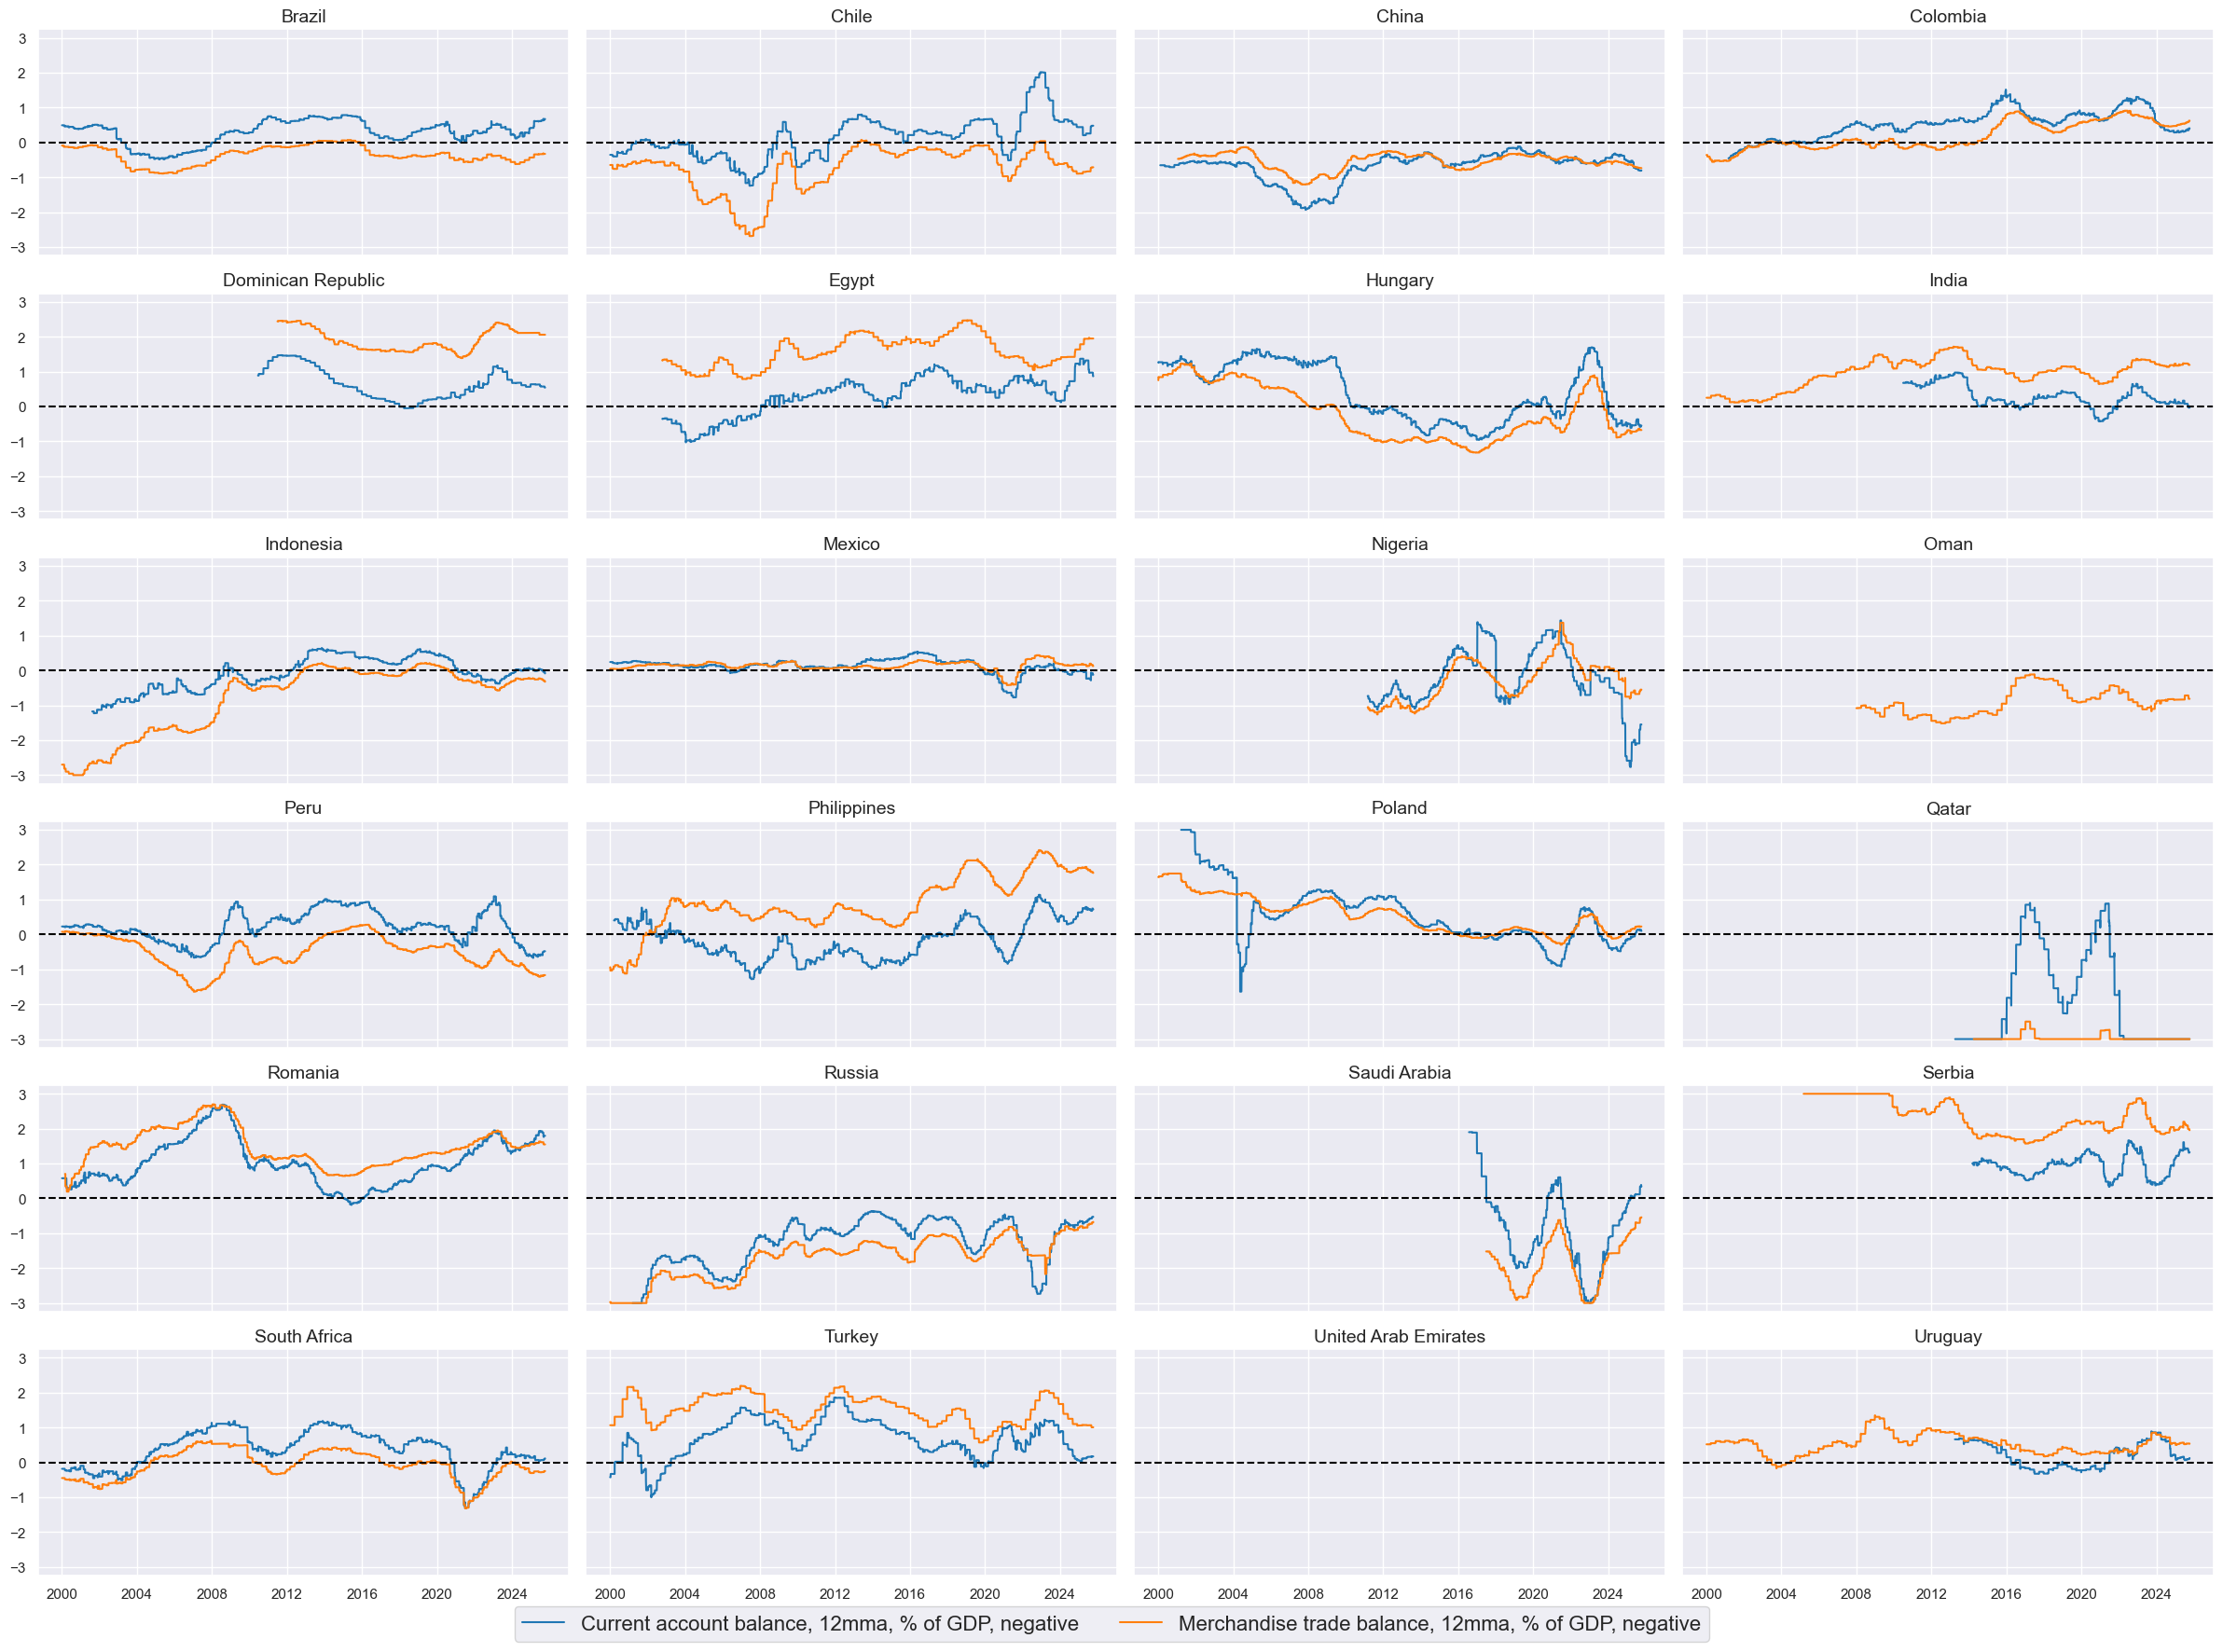
dict_labels["CABGDPRATIO_NSA_12MMA_NEGZN"] = "Current account balance, 12mma, % of GDP, negative"
dict_labels["MTBGDPRATIO_NSA_12MMA_NEGZN"] = "Merchandise trade balance, 12mma, % of GDP, negative"
dict_labels["XBALRISK_ZN"] = "External balances risk score"
dict_labels["IIPLIABGDP_NSA_D1Mv2YMA_ZN"] = "International liabilities, vs. 2yma, % of GDP"
dict_labels["IIPLIABGDP_NSA_D1Mv5YMA_ZN"] = "International liabilities, vs. 5yma, % of GDP"
dict_labels["NIIPGDP_NSA_D1Mv2YMA_NEGZN"] = "Net international investment position, vs. 2yma, % of GDP, negative"
dict_labels["NIIPGDP_NSA_D1Mv5YMA_NEGZN"] = "Net international investment position, vs. 5yma, % of GDP, negative"
dict_labels["XLIABRISK_ZN"] = "International position risk score"
dict_labels["ALLIFCDSGDP_NSA_NEGZN"] = "Excess foreign-currency debt securities, all, % of GDP, negative"
dict_labels["GGIFCDSGDP_NSA_NEGZN"] = "Excess foreign-currency debt securities, government, % of GDP, negative"
dict_labels["XDEBTRISK_ZN"] = "Foreign-currency debt risk score"
dict_labels["ACCOUNTABILITY_NSA_NEGZN"] = "Voice and accountability index, z-score"
dict_labels["POLSTAB_NSA_NEGZN"] = "Political stability and absence of violence/terrorism index, z-score"
dict_labels["CORRCONTROL_NSA_NEGZN"] = "Corruption control index, z-score"
dict_labels['GOVRISK_ZN'] = 'Governance risk score'
dict_labels["RGDP_SA_P1Q1QL4_20QMA_NEGZN"] = "Real GDP growth, percentage over a year ago, z-score, negative"
dict_labels["RGDP_SA_P1Q1QL4_NEGZN"] = "Real GDP growth, percentage over a year ago, z-score"
dict_labels['GROWTHRISK_ZN'] = "Growth risk score"
dict_labels["CPIH_IE_NEGZN"] = "Headline CPI inflation effect, z-score"
dict_labels["CPIC_IE_NEGZN"] = "Core CPI inflation effect, z-score"
dict_labels["INFLRISK_ZN"] = "Inflation risk score"
dict_countries = {
    'AED': 'United Arab Emirates',
    'BRL': 'Brazil',
    'CLP': 'Chile',
    'CNY': 'China',
    'COP': 'Colombia',
    'DOP': 'Dominican Republic',
    'EGP': 'Egypt',
    'HUF': 'Hungary',
    'IDR': 'Indonesia',
    'INR': 'India',
    'MXN': 'Mexico',
    'NGN': 'Nigeria',
    'OMR': 'Oman',
    'PEN': 'Peru',
    'PHP': 'Philippines',
    'PLN': 'Poland',
    'QAR': 'Qatar',
    'RON': 'Romania',
    'RSD': 'Serbia',
    'RUB': 'Russia',
    'SAR': 'Saudi Arabia',
    'TRY': 'Turkey',
    'UYU': 'Uruguay',
    'ZAR': 'South Africa'
}
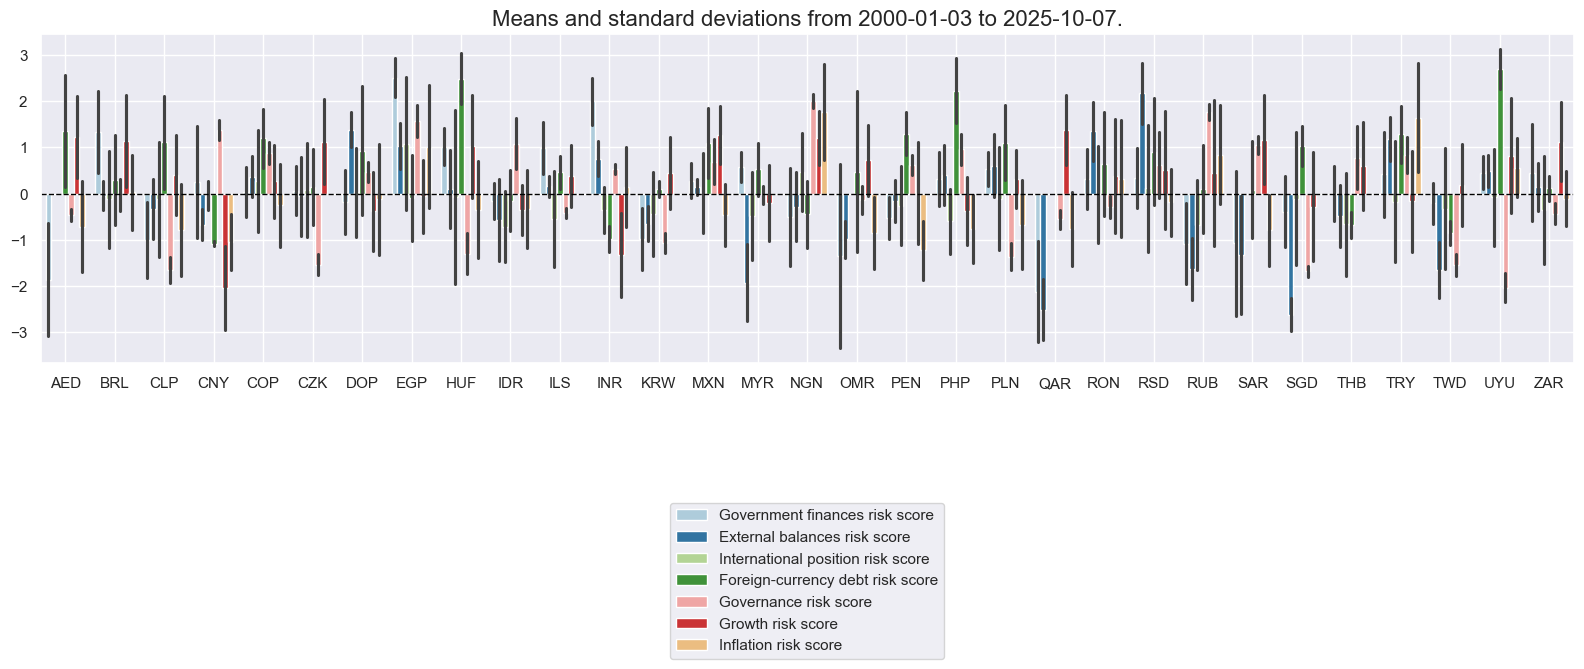
# Box for quantamental score review

factor = "XBALRISK"   # "GFINRISK" "XBALRISK" "XLIABRISK" "XDEBTRISK" "GOVRISK" "GROWTHRISK" "INFLRISK"
xcatx = list(dict_factz[factor])
cidx = cids_fc
sdate = "2000-01-01"

msp.view_ranges(
    dfx,
    xcats=xcatx,
    kind="bar",
    sort_cids_by="mean",  # countries sorted by mean of the first category
    start=sdate,
    xcat_labels=dict_labels,
)

msp.view_timelines(
    dfx,
    xcats=xcatx,
    cids=cidx,
    ncol=4,
    start=sdate,
    same_y=True,
    aspect=2,
    xcat_labels=dict_labels,
    cid_labels=dict_countries,
    title=None,
    title_fontsize=22,
    legend_fontsize=16,
    height=2,
)
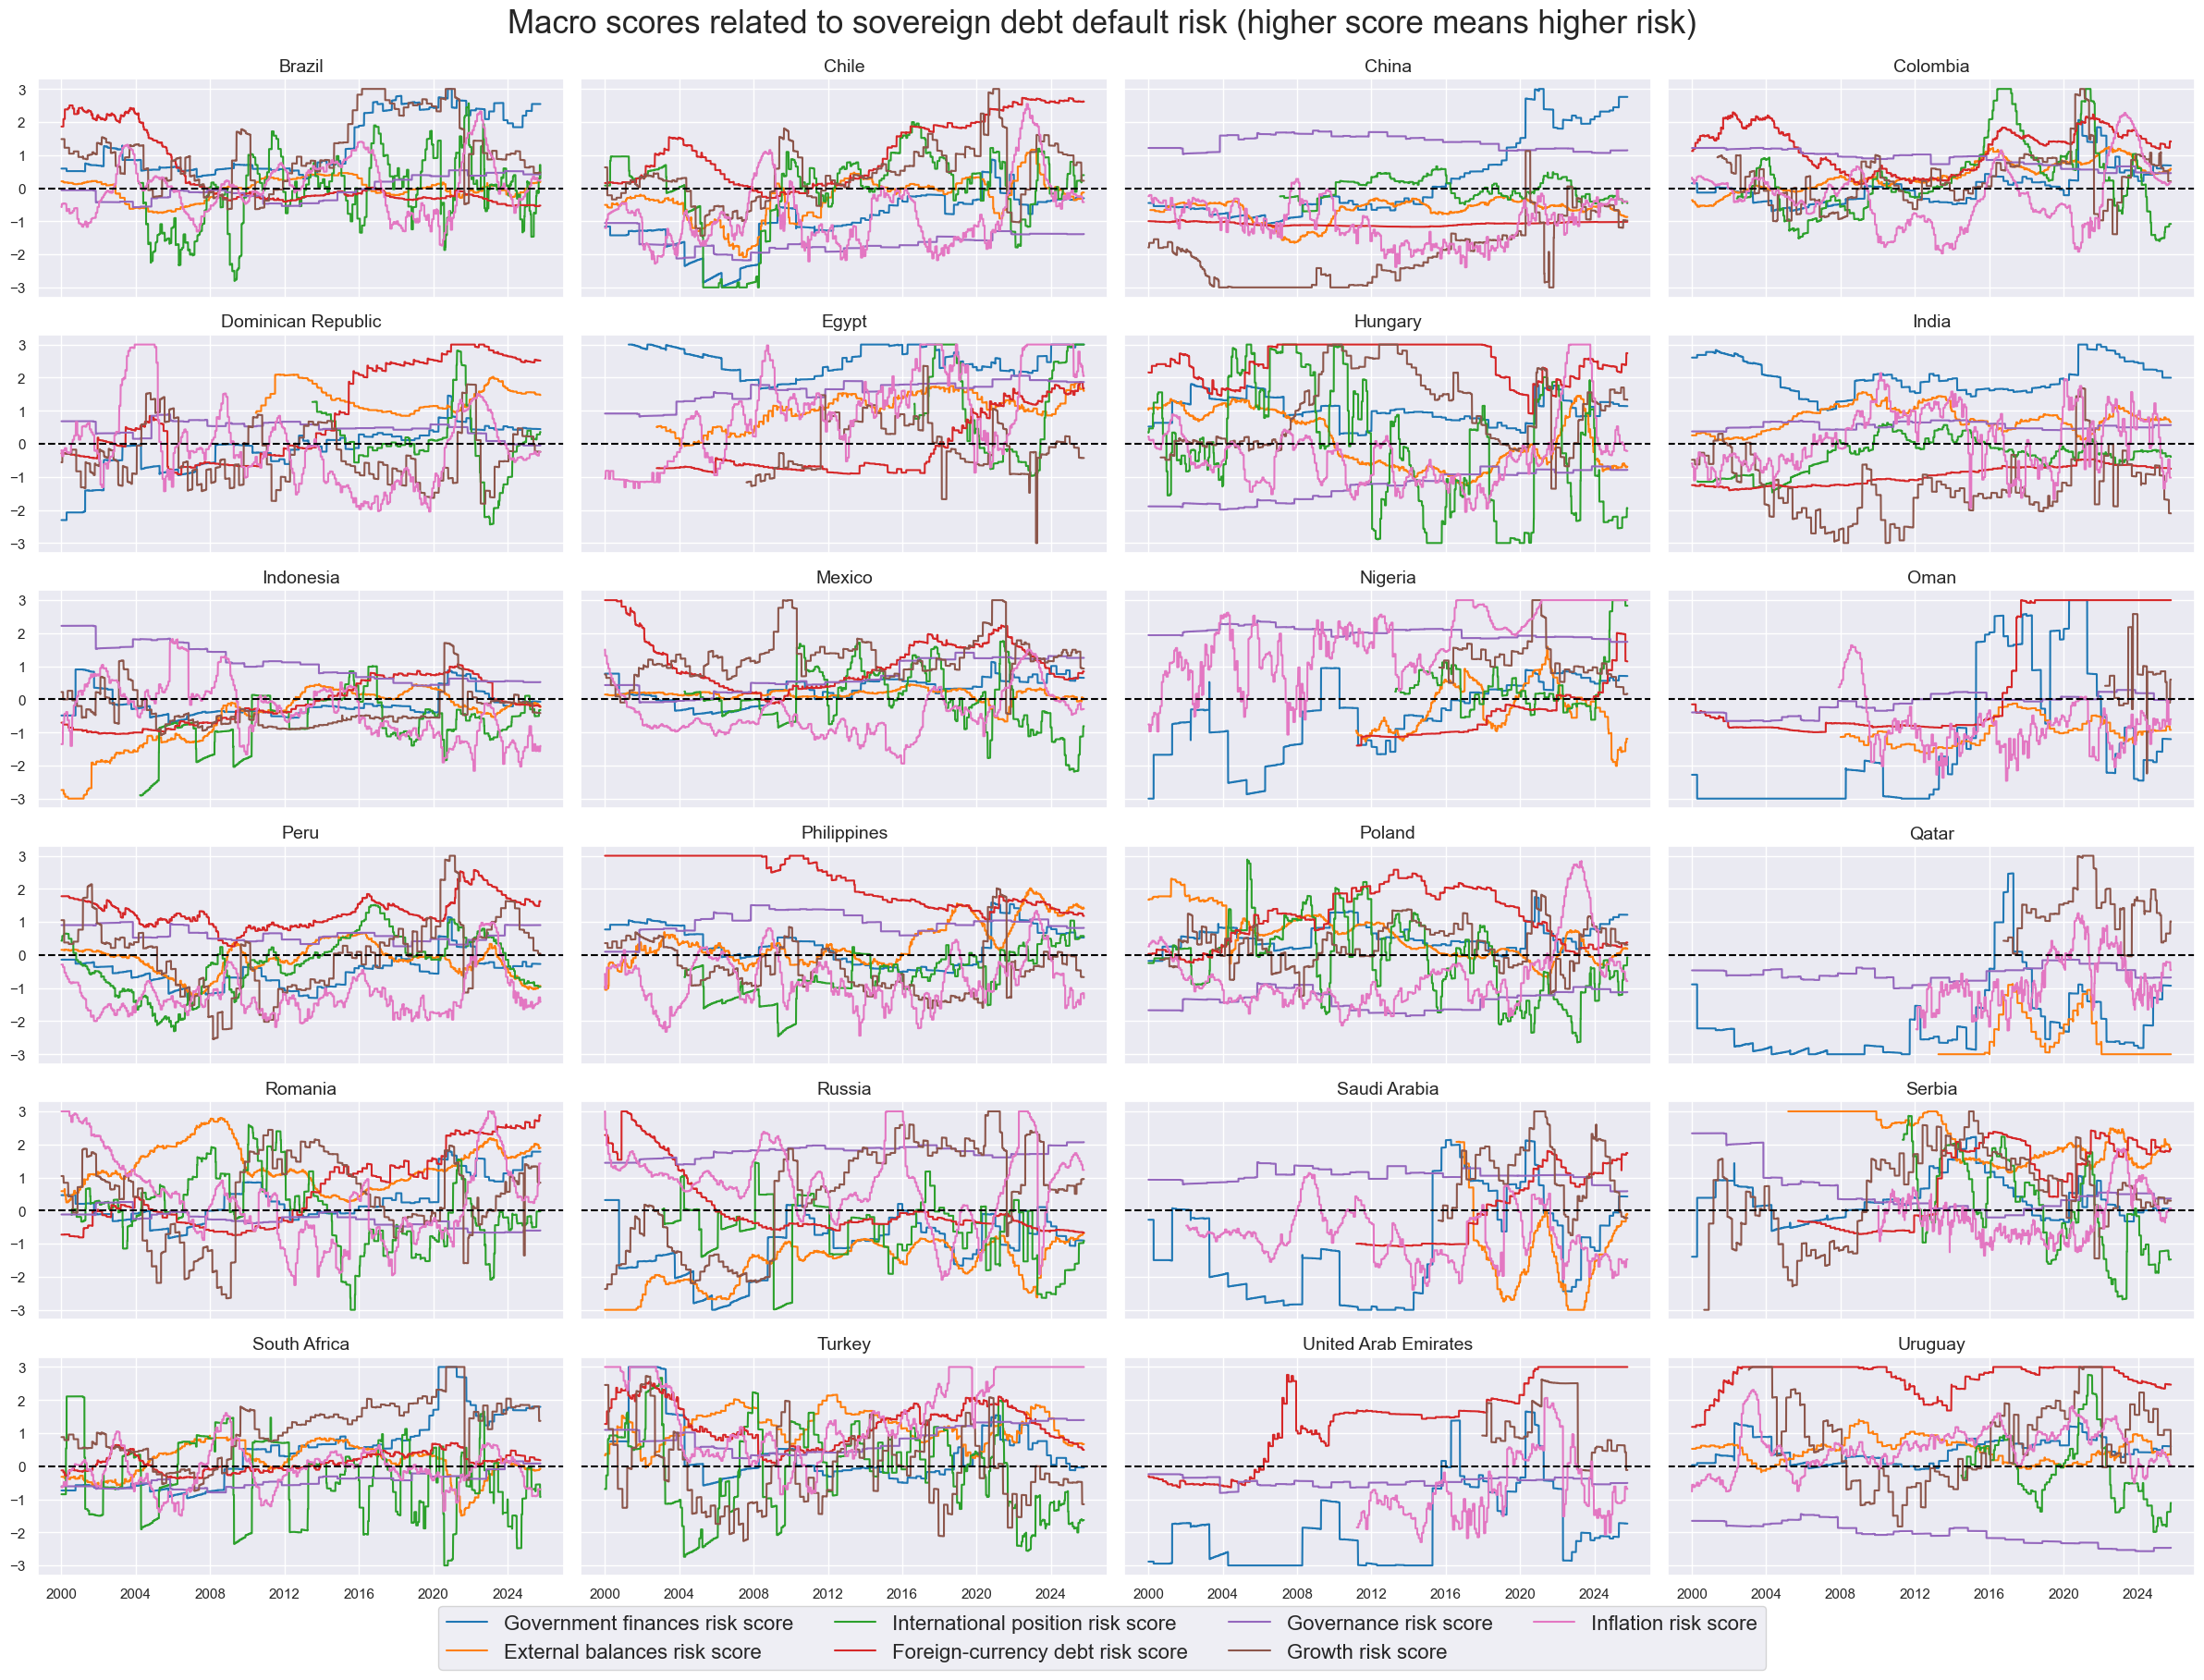
xcatx = macroz
cidx = cids_fc
sdate = "2000-01-01"

msp.view_ranges(
    dfx,
    xcats=xcatx,
    kind="bar",
    sort_cids_by=None,
    start=sdate,
    xcat_labels=dict_labels,
)

msp.view_timelines(
    dfx,
    xcats=xcatx,
    cids=cidx,
    ncol=4,
    start=sdate,
    same_y=True,
    aspect=2,
    xcat_labels=dict_labels,
    cid_labels=dict_countries,
    title="Macro scores related to sovereign debt default risk (higher score means higher risk)",
    title_fontsize=25,
    legend_fontsize=16,
    height=2,
)
Composite macro risk scores #
# Custom weights

dict_custom_weights = {
    'GFINRISK_ZN': 1,
    'XBALRISK_ZN': 1,
    'XLIABRISK_ZN': 1,
    'XDEBTRISK_ZN': 0.001,
    'GOVRISK_ZN': 1,
    'GROWTHRISK_ZN': 0.001,
    'INFLRISK_ZN': 0.001,
}

reduced_dict_custom_weights = {
    'GFINRISK_ZN': 1,
    'XBALRISK_ZN': 1,
    'XLIABRISK_ZN': 1,
    'GOVRISK_ZN': 1
}
# Weighted composite macro risk scores
cidx = cids_fc
xcatx = macroz
reduced_macroz = ['GFINRISK_ZN', 'XBALRISK_ZN', 'XLIABRISK_ZN', 'GOVRISK_ZN']
equal_weights = [1/len(macroz)] * len(macroz)
reduced_custom_weights = [reduced_dict_custom_weights[m] for m in reduced_macroz]
weights = {
"EWS": (macroz, equal_weights),
"CWS": (reduced_macroz, reduced_custom_weights),
}
# Step 4: Loop through
for k, (xcat_list, weight_list) in weights.items():
dfa = msp.linear_composite(
dfx,
xcats=xcat_list,
cids=cids_fc,
weights=weight_list,
normalize_weights=True,
complete_xcats=False,
new_xcat="MACRORISK_" + k,
)
dfx = msm.update_df(dfx, dfa)
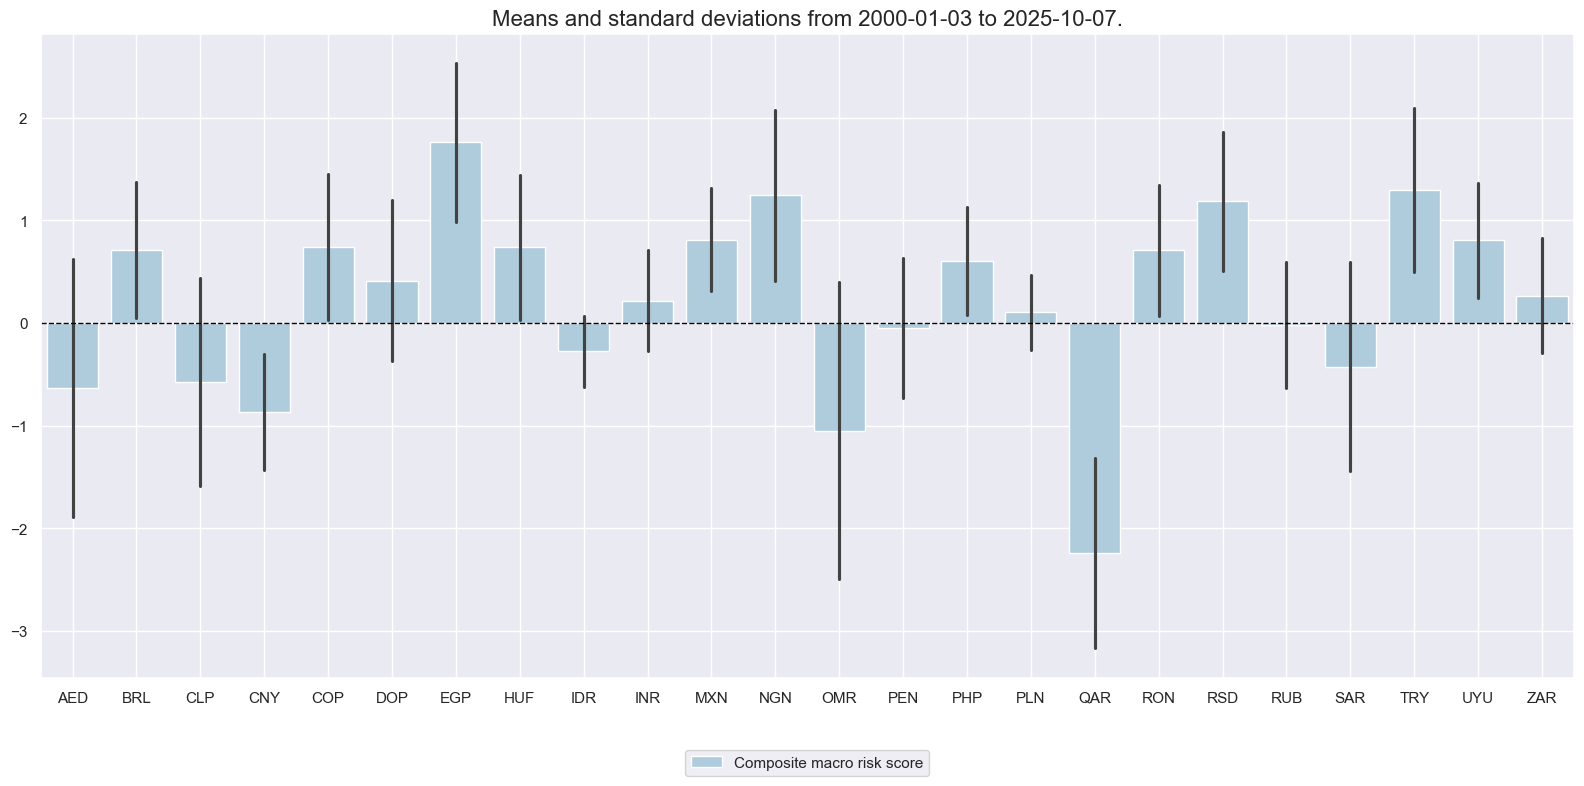
# Re-scoring the composites
for m in ['MACRORISK_EWS', 'MACRORISK_CWS']:
dfa = msp.make_zn_scores(
dfx,
xcat=m,
cids=cidx,
sequential=True,
min_obs=261 * 3,
neutral="zero",
pan_weight=1,
thresh=3,
postfix="_ZN",
est_freq="m",
)
dfx = msm.update_df(dfx, dfa)
dict_labels['MACRORISK_EWS_ZN'] = 'Composite macro risk score'
dict_labels['MACRORISK_CWS_ZN'] = 'Custom weighted macro risk score'
xcatx = ['MACRORISK_EWS_ZN'] # ['MACRORISK_EWS_ZN', 'MACRORISK_CWS_ZN']
cidx = cids_fc
sdate = "2000-01-01"
msp.view_ranges(
dfx,
xcats=xcatx,
kind="bar",
sort_cids_by=None,
start=sdate,
xcat_labels=dict_labels,
)
msp.view_timelines(
dfx,
xcats=xcatx,
cids=cidx,
ncol=4,
start=sdate,
same_y=True,
aspect=2,
xcat_labels=dict_labels,
cid_labels=dict_countries,
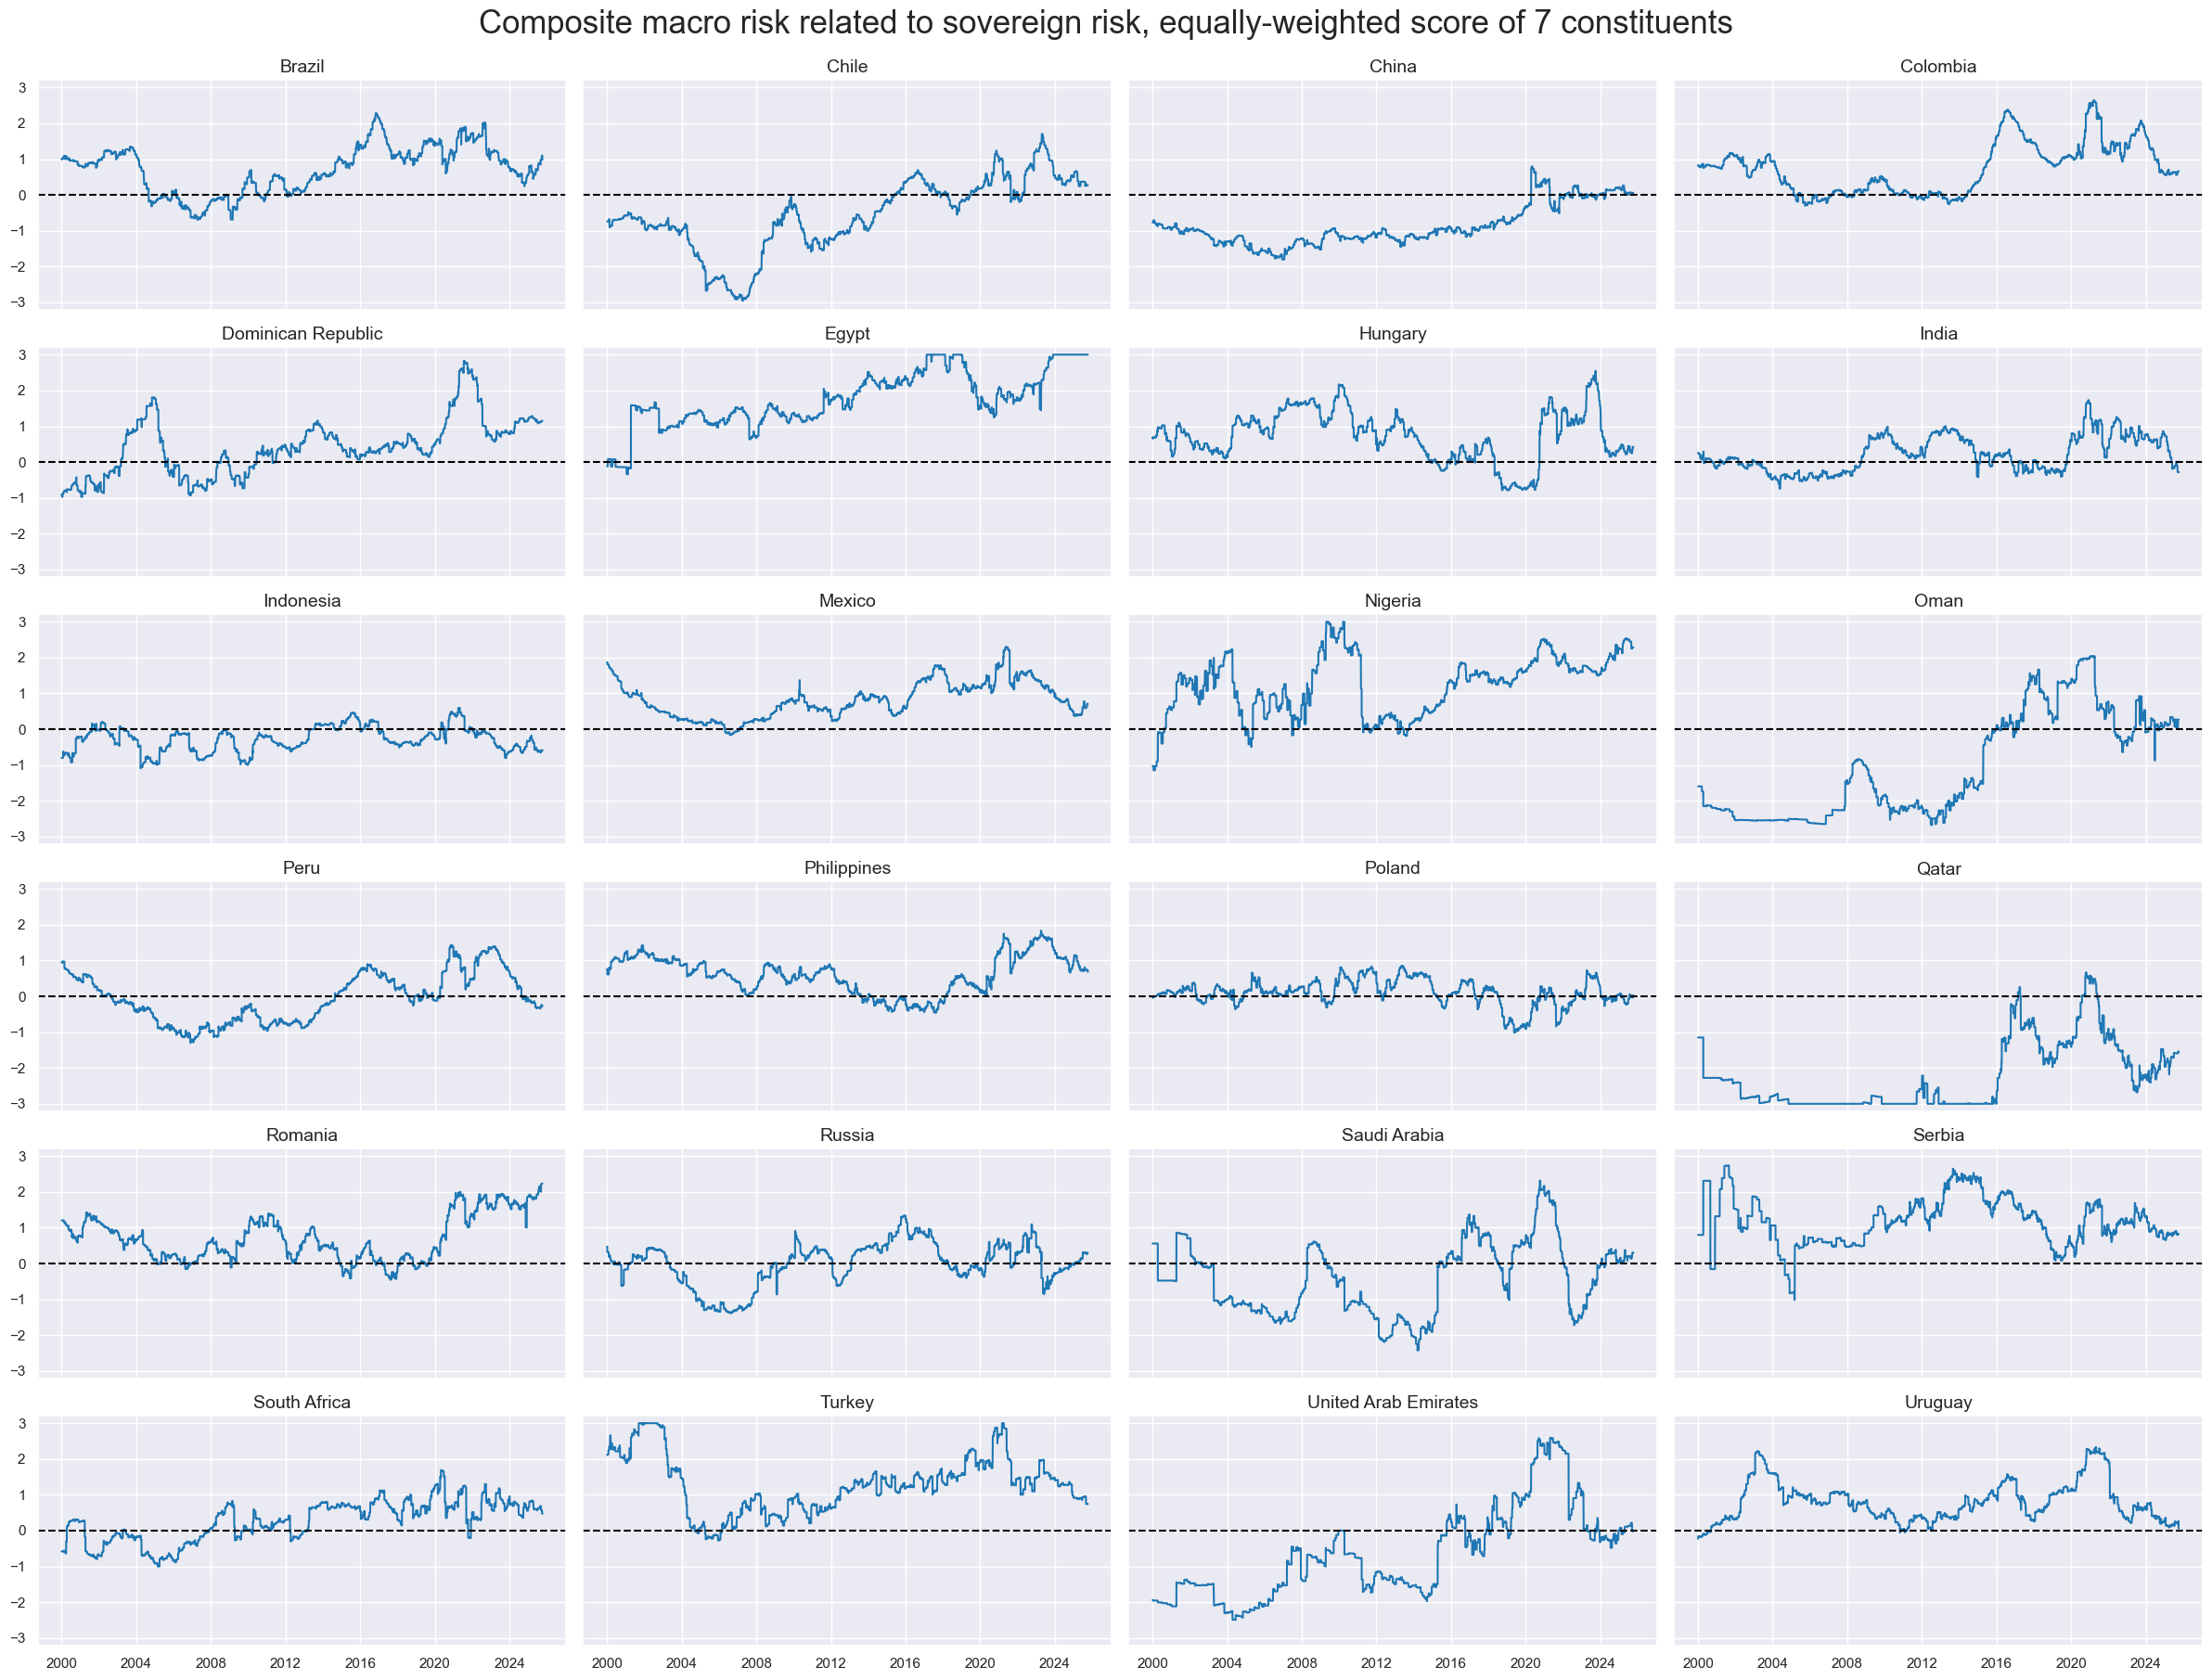
title="Composite macro risk related to sovereign risk, equally-weighted score of 7 constituents",
title_fontsize=25,
legend_fontsize=16,
height=2,
)
Market-implied risk scores #
# Use index carry where CDS spreads not available ("priced risk" score)

msm.missing_in_df(df, xcats=["CDS05YSPRD_NSA"], cids=cids_fc)  # countries without CDS
cidx = ['AED', 'DOP', 'EGP', 'INR', 'NGN', 'OMR', 'QAR', 'RSD', 'SAR', 'UYU']

calcs = ["CDS05YSPRD_NSA = FCBICRY_NSA"]
dfa = msp.panel_calculator(dfx, calcs=calcs, cids=cidx)
dfx = msm.update_df(dfx, dfa)

# Use inverse rating score ("rated risk" score)

calcs = [
    "LTFCRATING_ADJ = LTFCRATING_NSA + 1",  # temporary fix for VEF/RUB problem
    "LTFCRATING_INV = 1 / LTFCRATING_ADJ",
    "CDS05YSPRD_LOG = np.log( CDS05YSPRD_NSA )"  # accoount for non-linearity of spread changes

]
cidx = cids_fc
dfa = msp.panel_calculator(dfx, calcs=calcs, cids=cidx)
dfx = msm.update_df(dfx, dfa)
No missing XCATs across DataFrame.
Missing cids for CDS05YSPRD_NSA:  ['AED', 'DOP', 'EGP', 'INR', 'NGN', 'OMR', 'QAR', 'RSD', 'SAR', 'UYU']
xcatx = ["LTFCRATING_INV", "MACRORISK_EWS_ZN"]
cidx = cids_fc
catregs = {}
for xc in xcatx:
catregs[xc] = msp.CategoryRelations(
dfx,
xcats=[xc, "CDS05YSPRD_NSA"],
cids=cidx,
years=1,
lag=0,
xcat_aggs=["mean", "mean"],
blacklist=black_fc,
start="2000-01-01",
)
msv.multiple_reg_scatter(
cat_rels=[v for k, v in catregs.items()],
reg_order=2,
share_axes=False,
ncol=2,
nrow=1,
figsize=(14, 7),
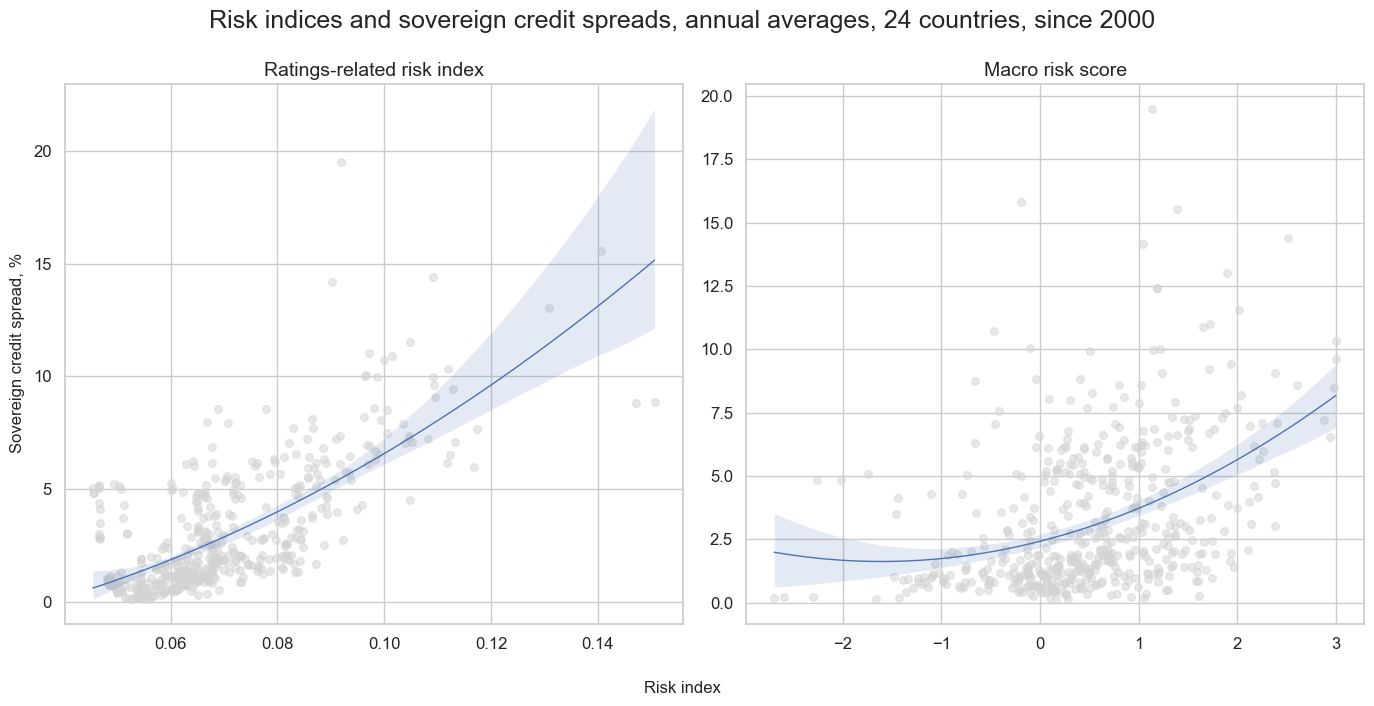
title="Risk indices and sovereign credit spreads, annual averages, 24 countries, since 2000",
title_fontsize=18,
xlab="Risk index",
ylab="Sovereign credit spread, %",
subplot_titles=["Ratings-related risk index", "Macro risk score"],
)
# Re-score the composite

for xc in ["CDS05YSPRD_LOG", "LTFCRATING_INV"]:
    dfa = msp.make_zn_scores(
        dfx,
        xcat=xc,
        cids=cidx,
        sequential=True,
        min_obs=261 * 3,
        neutral="median",
        pan_weight=1,
        thresh=3,
        postfix="_ZN",
        est_freq="m",
    )

    dfx = msm.update_df(dfx, dfa)

dict_labels["CDS05YSPRD_LOG_ZN"] = "Log spread-based market risk score"
dict_labels["LTFCRATING_INV_ZN"] = "Ratings-based market risk score"
# Composite market risk scores

cidx = cids_fc
xcatx = ["CDS05YSPRD_LOG_ZN", "LTFCRATING_INV_ZN"]

dfa = msp.linear_composite(
    dfx,
    xcats=xcatx,
    cids=cidx,
    complete_xcats=False,
    new_xcat="MARKETRISK",
)

dfx = msm.update_df(dfx, dfa)

# Re-score the composite

dfa = msp.make_zn_scores(
    dfx,
    xcat="MARKETRISK",
    cids=cidx,
    sequential=True,
    min_obs=261 * 3,
    neutral="zero",
    pan_weight=1,
    thresh=3,
    postfix="_ZN",
    est_freq="m",
)

dfx = msm.update_df(dfx, dfa)

dict_labels["MARKETRISK_ZN"] = "Composite market risk score"
xcatx = ["MARKETRISK_ZN", "CDS05YSPRD_LOG_ZN", "LTFCRATING_INV_ZN"]
cidx = cids_fc
sdate = "2000-01-01"
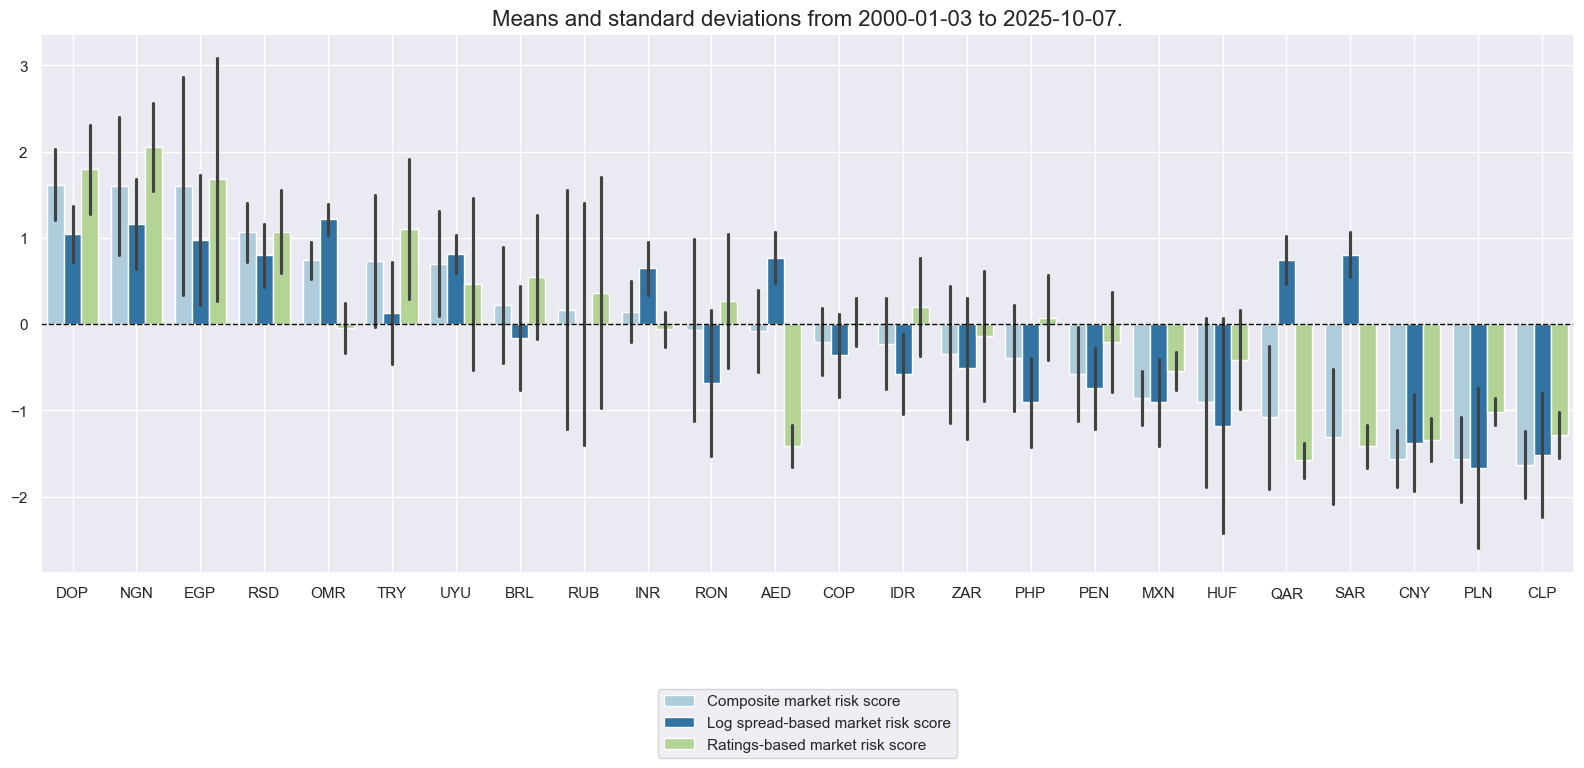
msp.view_ranges(
dfx,
xcats=xcatx,
kind="bar",
sort_cids_by="mean",
start=sdate,
xcat_labels=dict_labels,
)
msp.view_timelines(
dfx,
xcats=xcatx,
cids=cidx,
ncol=4,
start=sdate,
same_y=True,
xcat_labels=dict_labels,
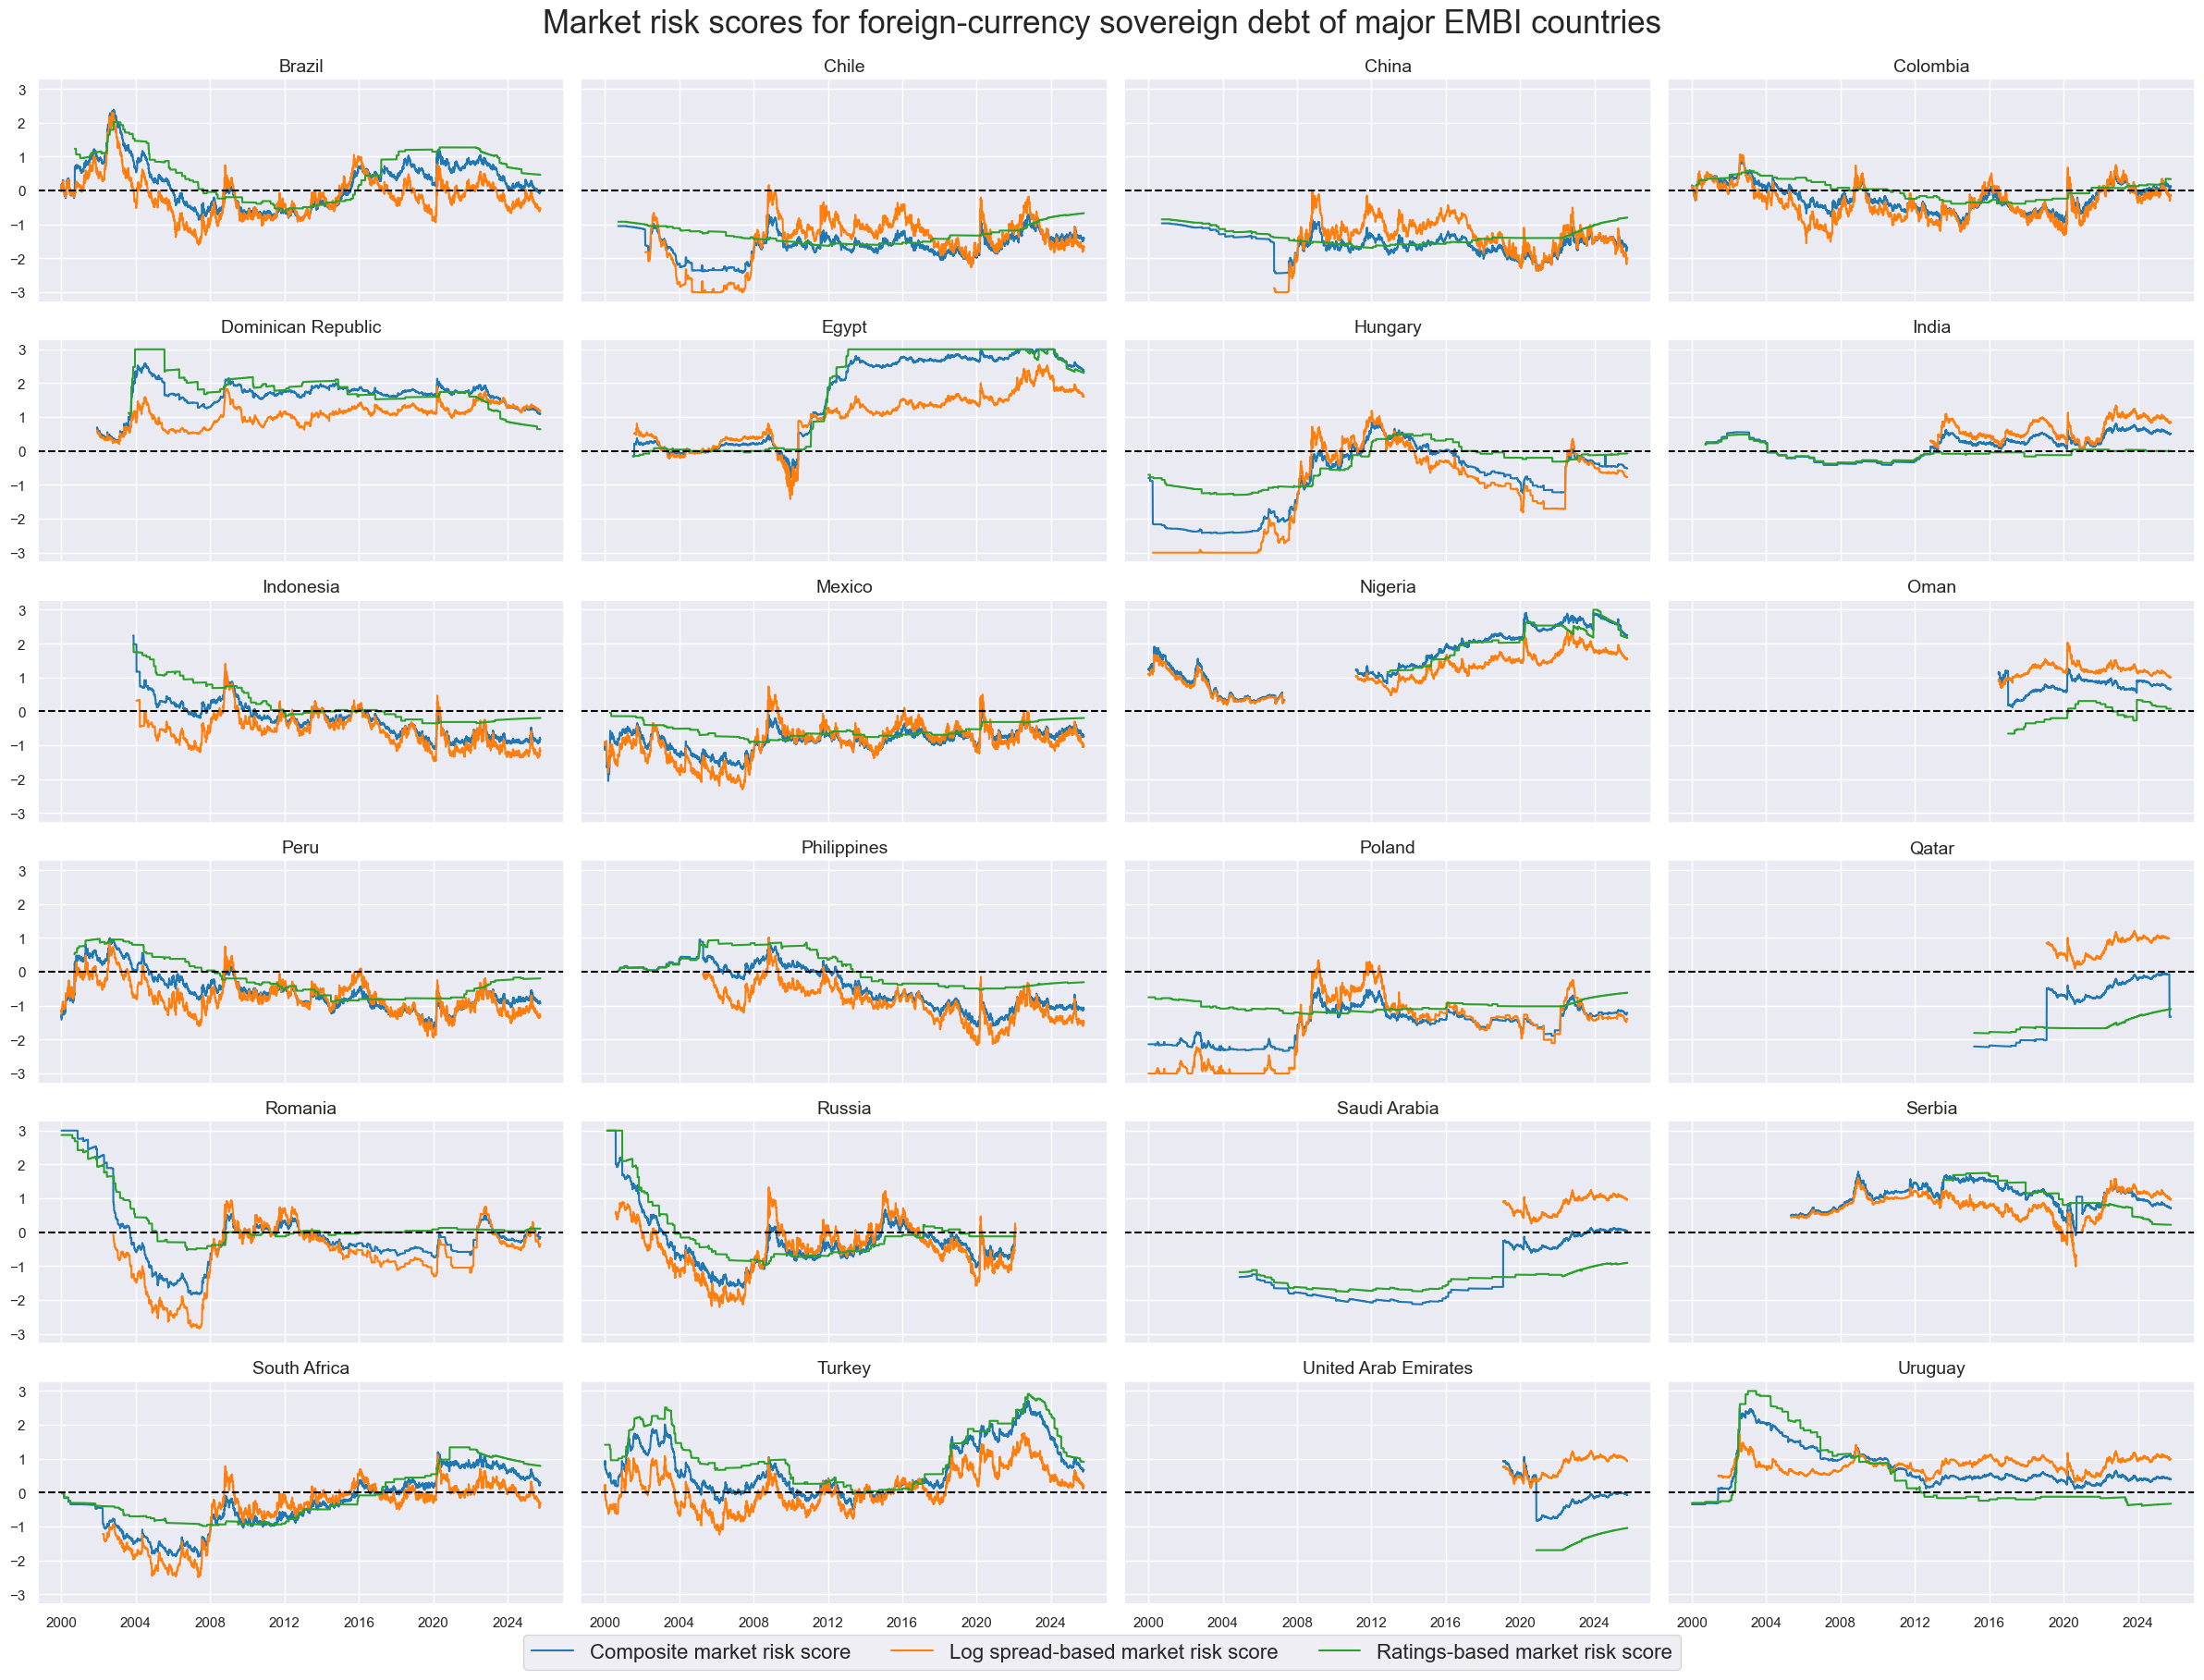
title='Market risk scores for foreign-currency sovereign debt of major EMBI countries',
title_fontsize=25,
legend_fontsize=16,
cid_labels=dict_countries,
aspect=2,
height=2,
blacklist=black_fc
)
Basic relationship visualizations #
Long-term relations #
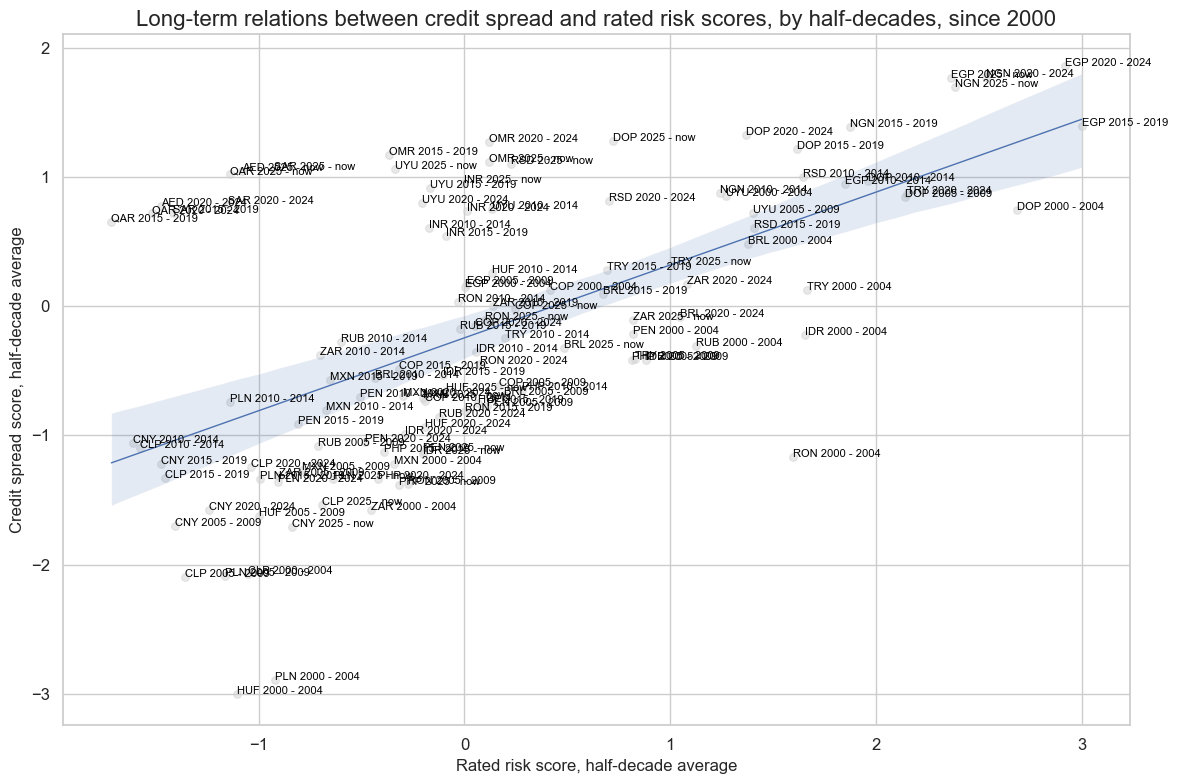
# Long-term ratings - spread relations

xcatx = ["LTFCRATING_INV_ZN", "CDS05YSPRD_LOG_ZN"]
cidx = cids_fc

cr = msp.CategoryRelations(
    dfx,
    xcats=xcatx,
    cids=cidx,
    years=5,
    lag=0,
    xcat_aggs=["mean", "mean"],
    blacklist=black_fc,
    start="2000-01-01",
)

cr.reg_scatter(
    labels=True,
    label_fontsize=12,
    title="Long-term relations between credit spread and rated risk scores, by half-decades, since 2000",
    title_fontsize=16,
    xlab="Rated risk score, half-decade average",
    ylab="Credit spread score, half-decade average",
)
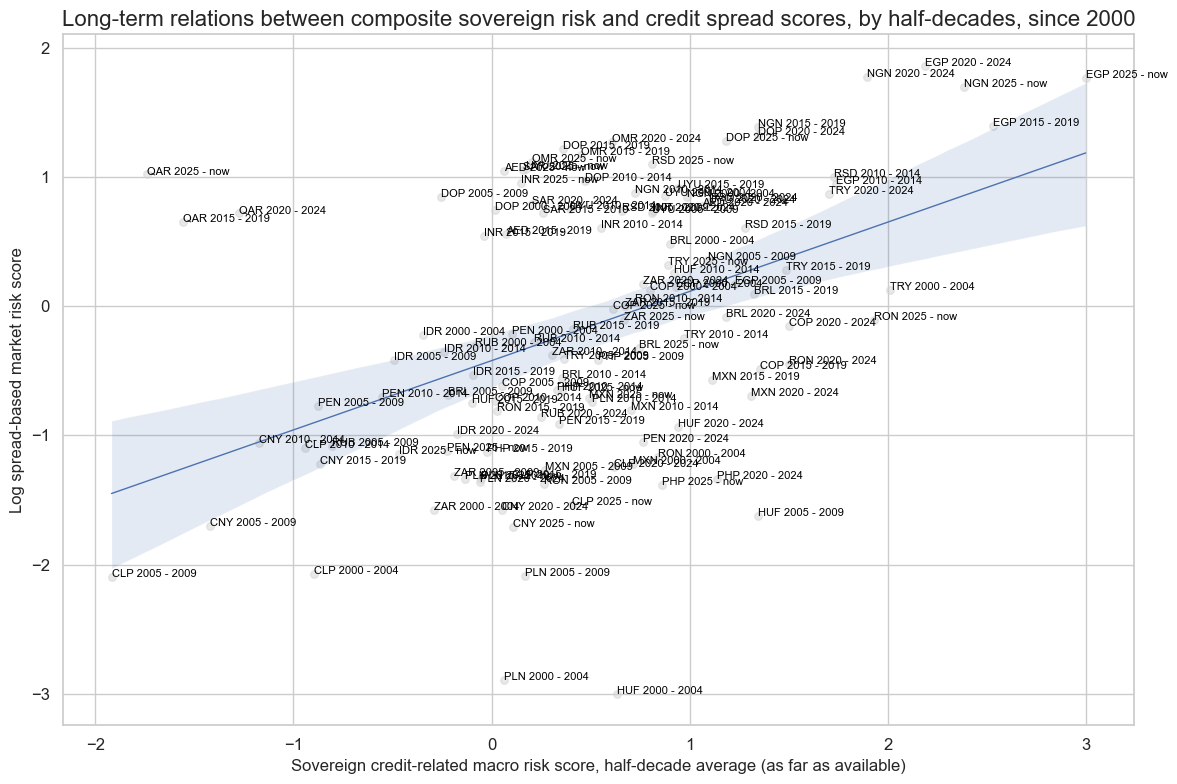
# Long-term macro risk - spread relations

xcatx = ["MACRORISK_EWS_ZN", "CDS05YSPRD_LOG_ZN"]
cidx = cids_fc

cr = msp.CategoryRelations(
    dfx,
    xcats=xcatx,
    cids=cidx,
    years=5,
    lag=0,
    xcat_aggs=["mean", "mean"],
    blacklist=black_fc,
    start="2000-01-01",
)

cr.reg_scatter(
    labels=True,
    label_fontsize=12,
    title="Long-term relations between composite sovereign risk and credit spread scores, by half-decades, since 2000",
    title_fontsize=16,
    xlab="Sovereign credit-related macro risk score, half-decade average (as far as available)",
    ylab=dict_labels['CDS05YSPRD_LOG_ZN'],
)
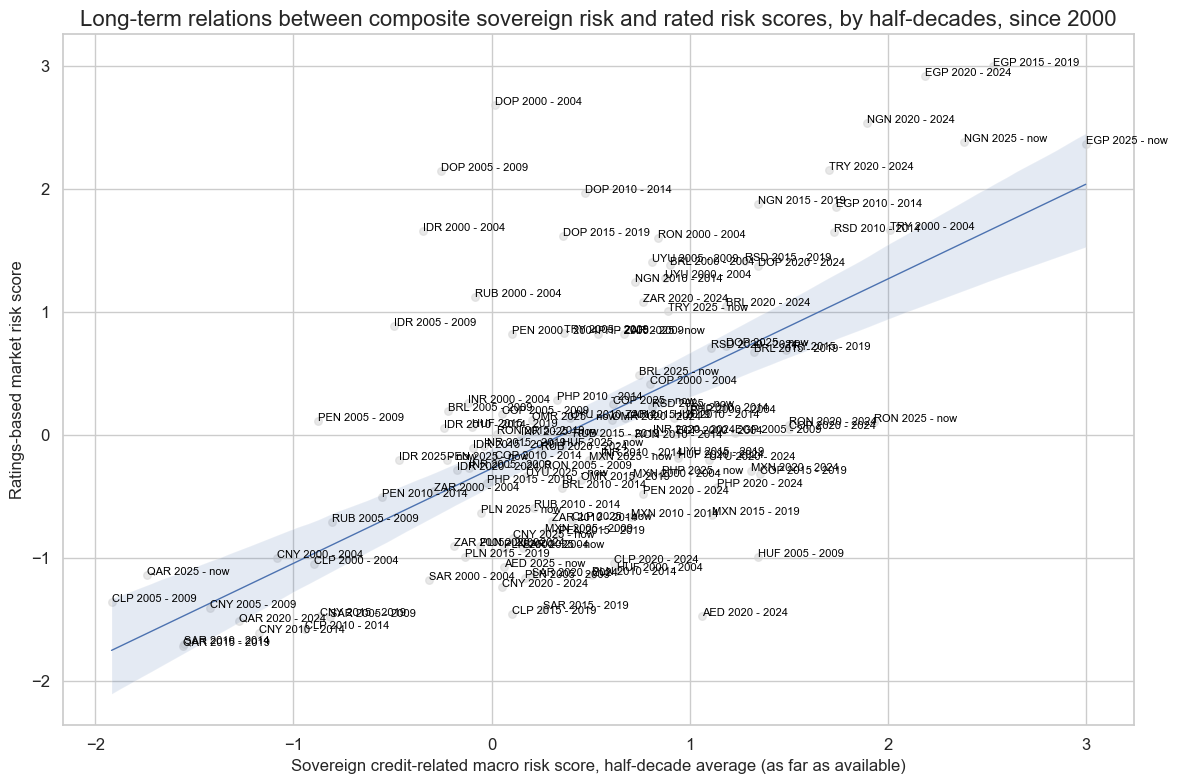
# Long-term macro risk - ratings relations

xcatx = ["MACRORISK_EWS_ZN", "LTFCRATING_INV_ZN"]
cidx = cids_fc

cr = msp.CategoryRelations(
    dfx,
    xcats=xcatx,
    cids=cidx,
    years=5,
    lag=0,
    xcat_aggs=["mean", "mean"],
    blacklist=black_fc,
    start="2000-01-01",
)

cr.reg_scatter(
    labels=True,
    label_fontsize=12,
    title="Long-term relations between composite sovereign risk and rated risk scores, by half-decades, since 2000",
    title_fontsize=16,
    xlab="Sovereign credit-related macro risk score, half-decade average (as far as available)",
    ylab=dict_labels['LTFCRATING_INV_ZN'],
)
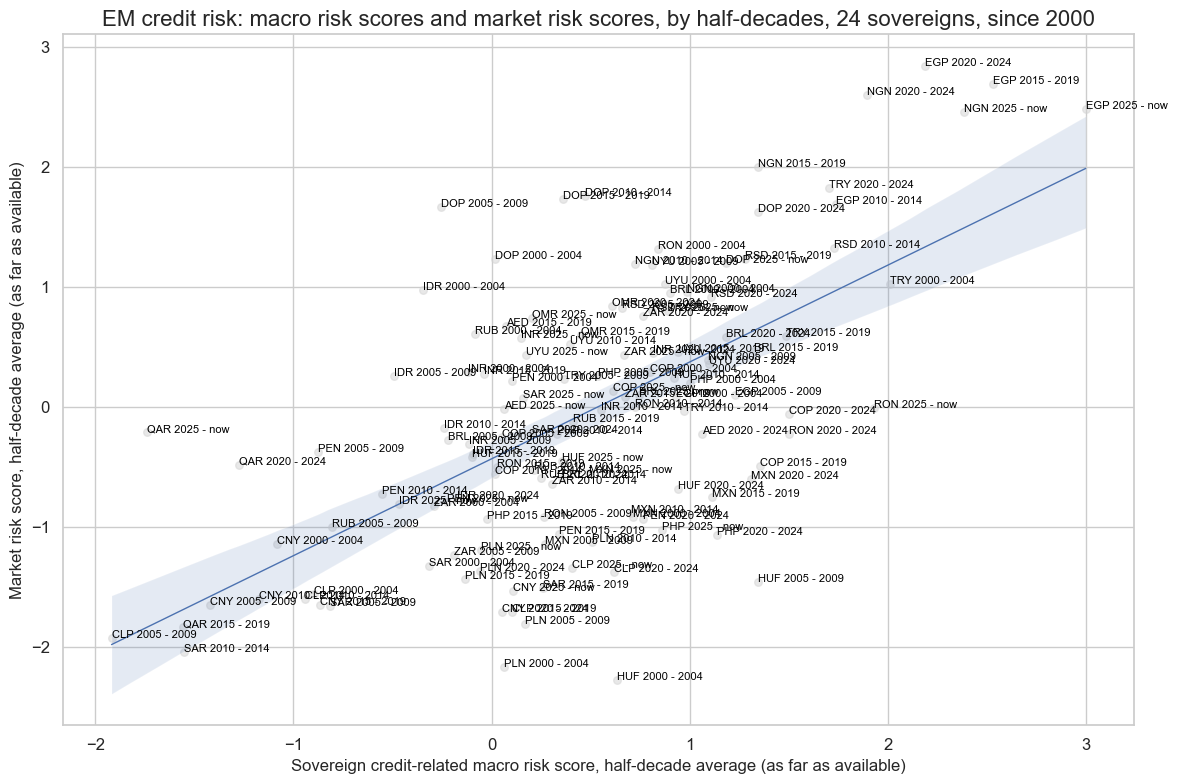
# Long-term macro risk - ratings relations

xcatx = ["MACRORISK_EWS_ZN", "MARKETRISK_ZN"]
cidx = cids_fc

cr = msp.CategoryRelations(
    dfx,
    xcats=xcatx,
    cids=cidx,
    years=5,
    lag=0,
    xcat_aggs=["mean", "mean"],
    blacklist=black_fc,
    start="2000-01-01",
)

cr.reg_scatter(
    labels=True,
    label_fontsize=12,
    title="EM credit risk: macro risk scores and market risk scores, by half-decades, 24 sovereigns, since 2000",
    title_fontsize=16,
    xlab="Sovereign credit-related macro risk score, half-decade average (as far as available)",
    ylab="Market risk score, half-decade average (as far as available)",
)
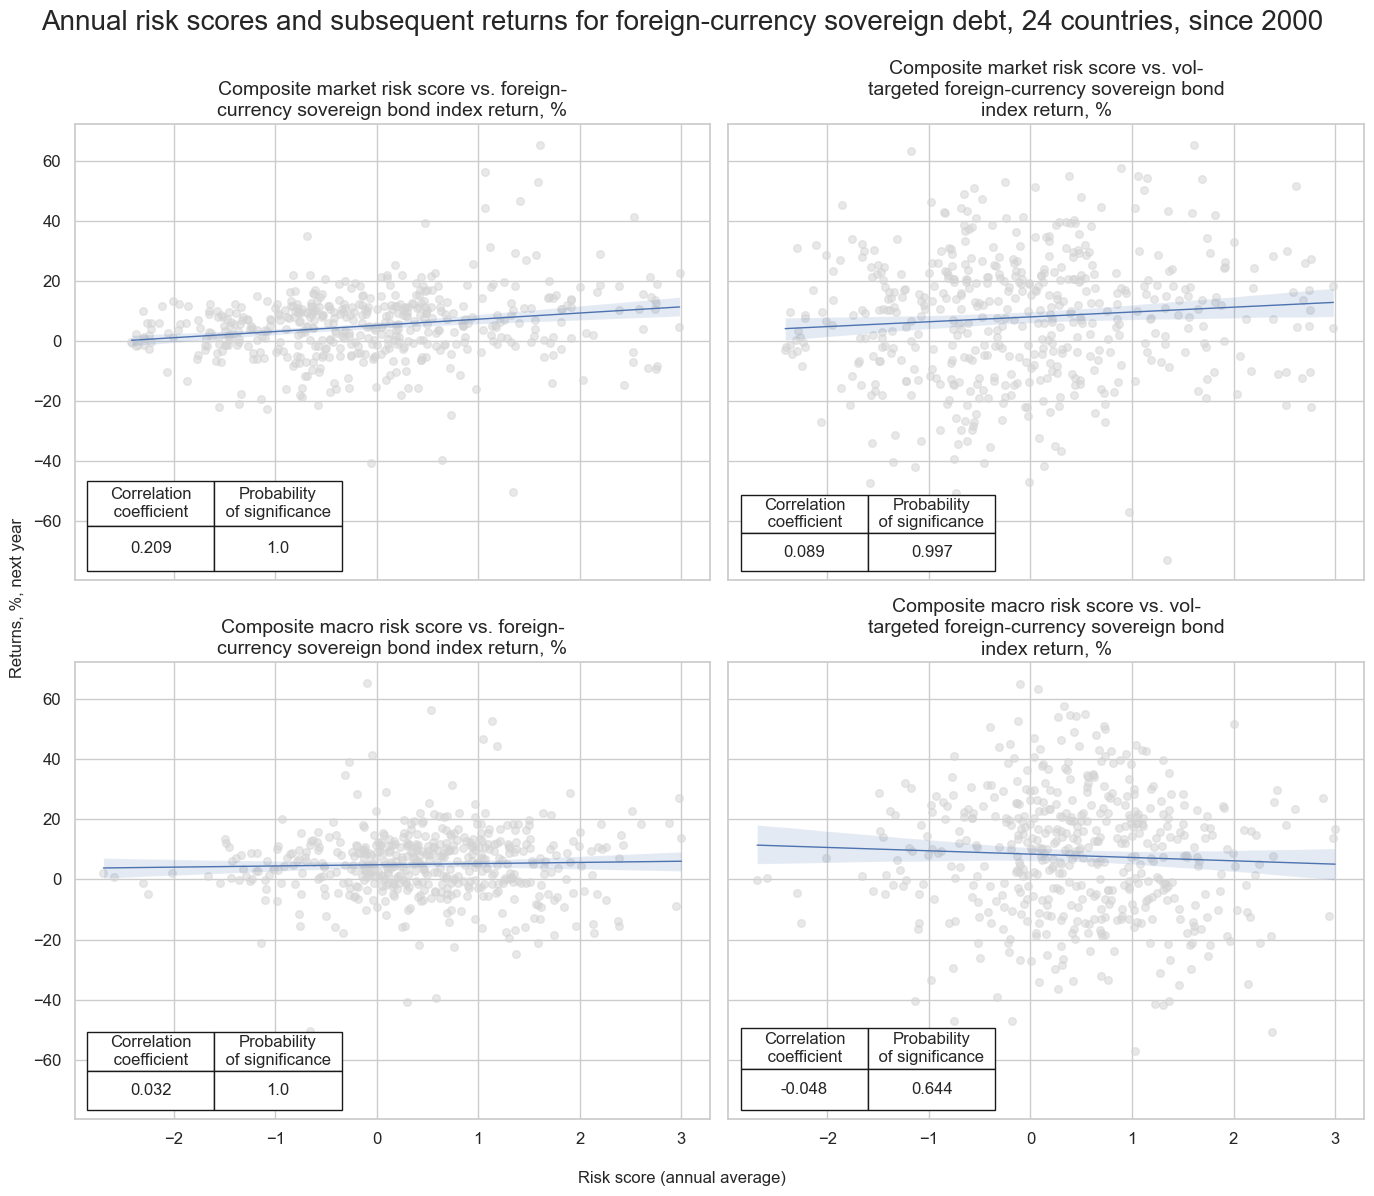
cidx = cids_fc

risks = ["MARKETRISK_ZN", "MACRORISK_EWS_ZN"]
returns = ["FCBIXR_NSA", "FCBIXR_VT10"]

dict_labels["FCBIXR_NSA"] = "Foreign-currency sovereign bond index return, %"
dict_labels["FCBIXR_VT10"] = "Vol-targeted foreign-currency sovereign bond index return, %"

all_relations = []
all_titles = []

for risk in risks:
    for ret in returns:
        cr = msp.CategoryRelations(
            dfx,
            xcats=[risk, ret],
            cids=cidx,
            freq="A",
            # years=10,
            lag=1,
            xcat_aggs=["mean", "sum"],
            blacklist=black_fc,
            start="2000-01-01",
        )
        all_relations.append(cr)
        risk_label = dict_labels[risk]
        ret_label = dict_labels[ret].lower()
        all_titles.append(risk_label + " vs. " + ret_label)

msv.multiple_reg_scatter(
    cat_rels=all_relations,
    title="Annual risk scores and subsequent returns for foreign-currency sovereign debt, 24 countries, since 2000",
    xlab="Risk score (annual average)",
    ylab="Returns, %, next year",
    ncol=2,
    nrow=2,
    figsize=(14, 12),
    prob_est="map",
    coef_box="lower left",
    subplot_titles=all_titles
)
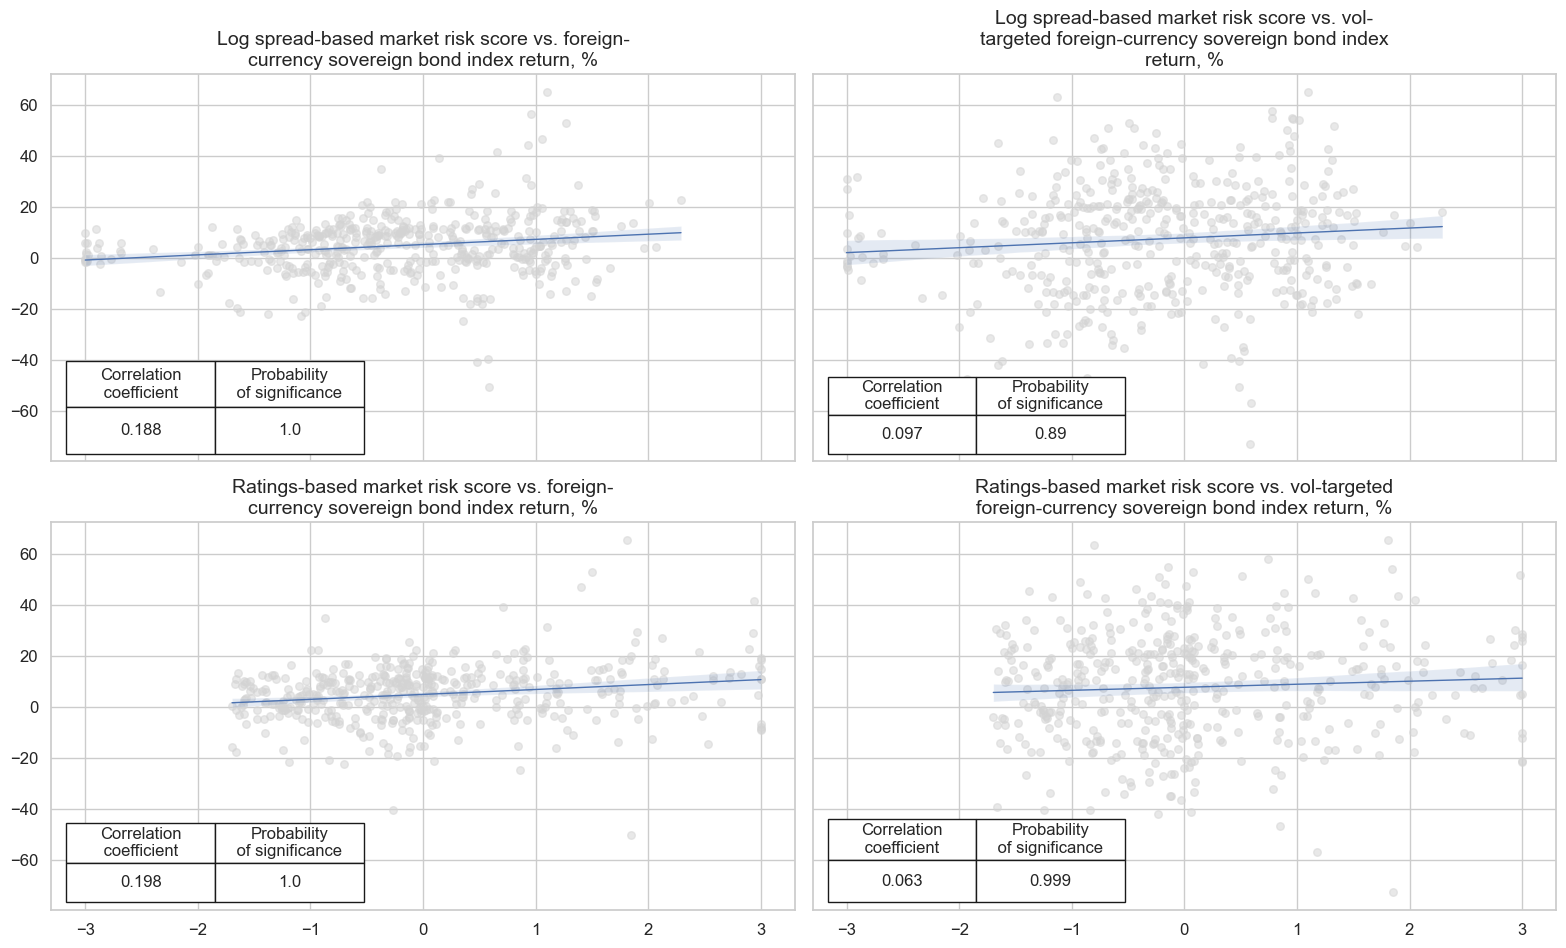
cidx = cids_fc

risks = ["CDS05YSPRD_LOG_ZN", "LTFCRATING_INV_ZN"]
returns = ["FCBIXR_NSA", "FCBIXR_VT10"]

all_relations = []
all_titles = []

for risk in risks:
    for ret in returns:
        cr = msp.CategoryRelations(
            dfx,
            xcats=[risk, ret],
            cids=cidx,
            freq="A",
            # years=10,
            lag=1,
            xcat_aggs=["mean", "sum"],
            blacklist=black_fc,
            start="2000-01-01",
        )
        all_relations.append(cr)
        risk_label = dict_labels[risk]
        ret_label = dict_labels[ret].lower()
        all_titles.append(risk_label + " vs. " + ret_label)

msv.multiple_reg_scatter(
    cat_rels=all_relations,
    title=None,
    xlab=None,
    ylab=None,
    ncol=2,
    nrow=2,
    figsize=(16, 10),
    prob_est="map",
    coef_box="lower left",
    subplot_titles=all_titles
)
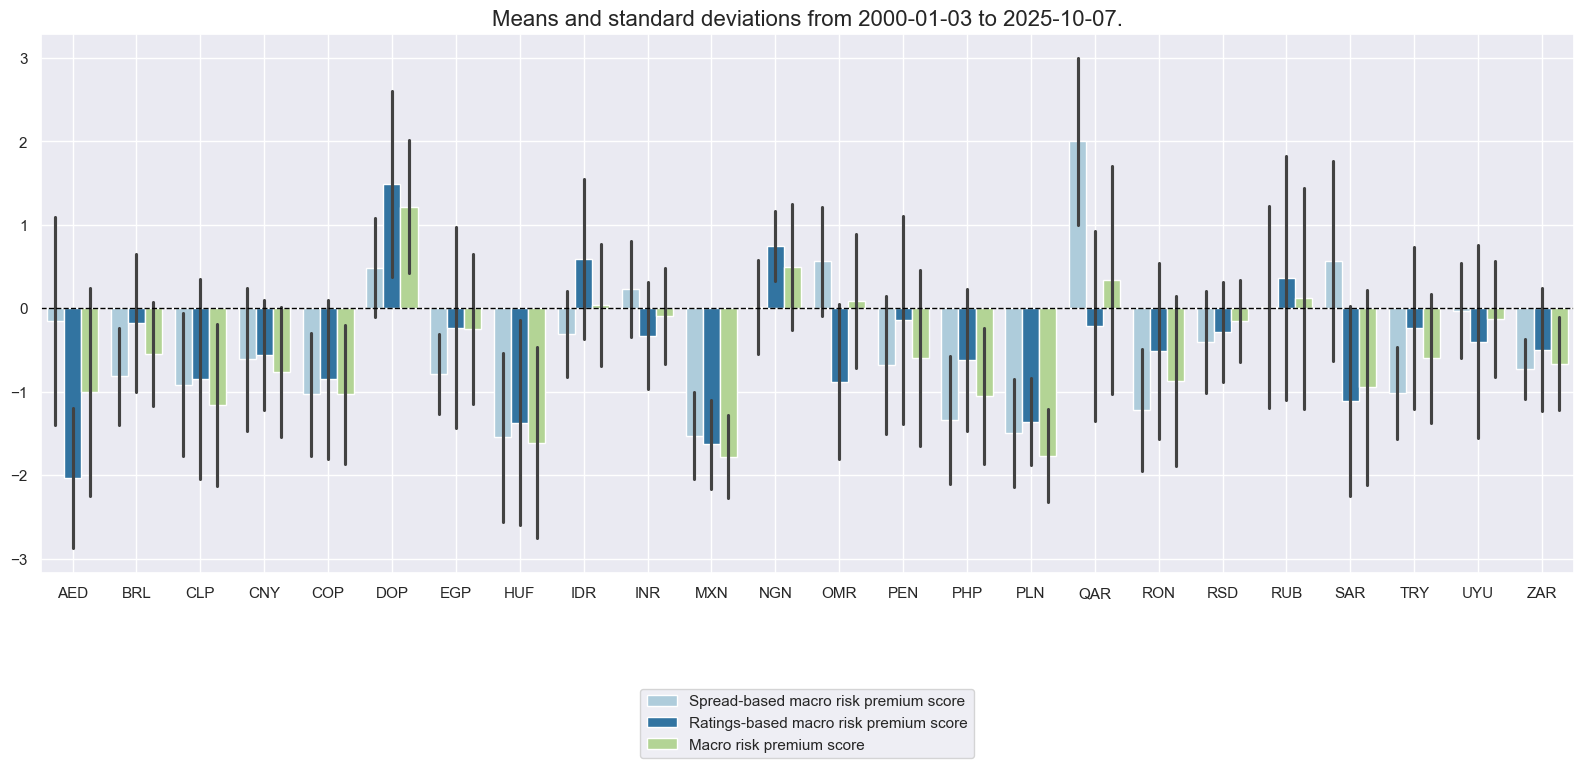
Macro risk premium scores #
Aggregate macro risk premium scores #
# Score differences
cidx = cids_fc
calcs = [
"MACROSPREAD_RPS = CDS05YSPRD_LOG_ZN - MACRORISK_EWS_ZN",
"MACRORATING_RPS = LTFCRATING_INV_ZN - MACRORISK_EWS_ZN",
"MACROALL_RPS = MARKETRISK_ZN - MACRORISK_EWS_ZN",
"MACROSPREAD_RPS_CWS = CDS05YSPRD_LOG_ZN - MACRORISK_CWS_ZN",
"MACRORATING_RPS_CWS = LTFCRATING_INV_ZN - MACRORISK_CWS_ZN",
"MACROALL_RPS_CWS = MARKETRISK_ZN - MACRORISK_CWS_ZN",
]
dfa = msp.panel_calculator(dfx, calcs=calcs, cids=cidx)
dfx = msm.update_df(dfx, dfa)
rps = list(dfa['xcat'].unique())
# Re-z-scoring the risk premium scores
for rp in rps:
dfa = msp.make_zn_scores(
dfx,
xcat=rp,
cids=cidx,
sequential=True,
min_obs=261 * 3,
neutral="zero",
pan_weight=1,
thresh=3,
postfix="_ZN",
est_freq="m",
)
dfx = msm.update_df(dfx, dfa)
dict_labels["MACROSPREAD_RPS_ZN"] = "Spread-based macro risk premium score"
dict_labels["MACRORATING_RPS_ZN"] = "Ratings-based macro risk premium score"
dict_labels["MACROALL_RPS_ZN"] = "Macro risk premium score"
dict_labels["MACROSPREAD_RPS_CWS_ZN"] = "Spread-based macro risk premium score, custom weights"
dict_labels["MACRORATING_RPS_CWS_ZN"] = "Ratings-based macro risk premium score, custom weights"
dict_labels["MACROALL_RPS_CWS_ZN"] = "Macro risk premium score, custom weights"
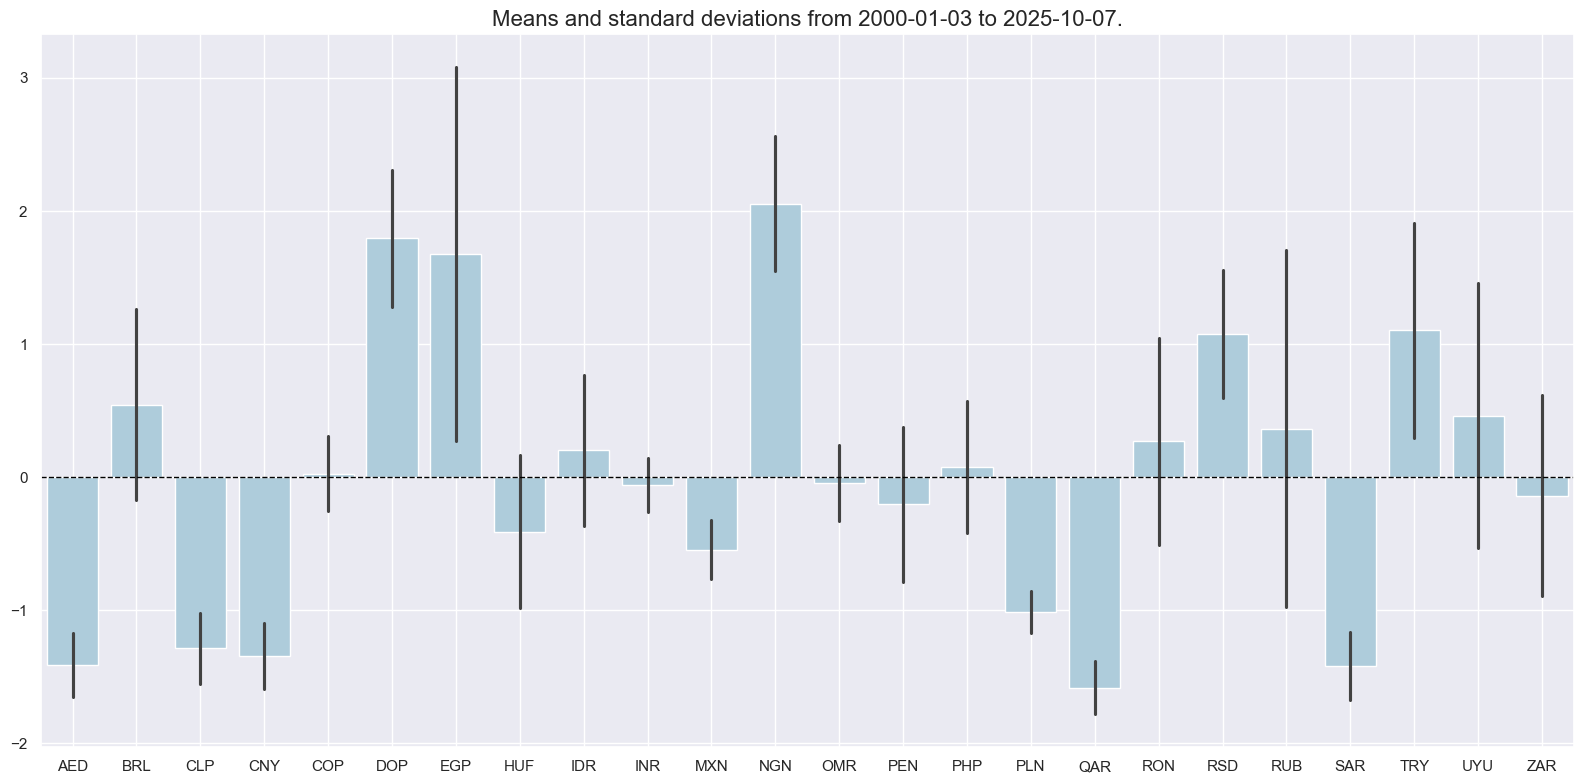
rpz = ["MACROSPREAD_RPS_ZN", "MACRORATING_RPS_ZN", "MACROALL_RPS_ZN",]
xrpz = rpz + [rp[:-3] + "_CWS_ZN" for rp in rpz]
xcatx = rpz
cidx = cids_fc
sdate = "2000-01-01"
msp.view_ranges(
dfx,
xcats=xcatx,
kind="bar",
sort_cids_by=None,
start=sdate,
xcat_labels=dict_labels,
)
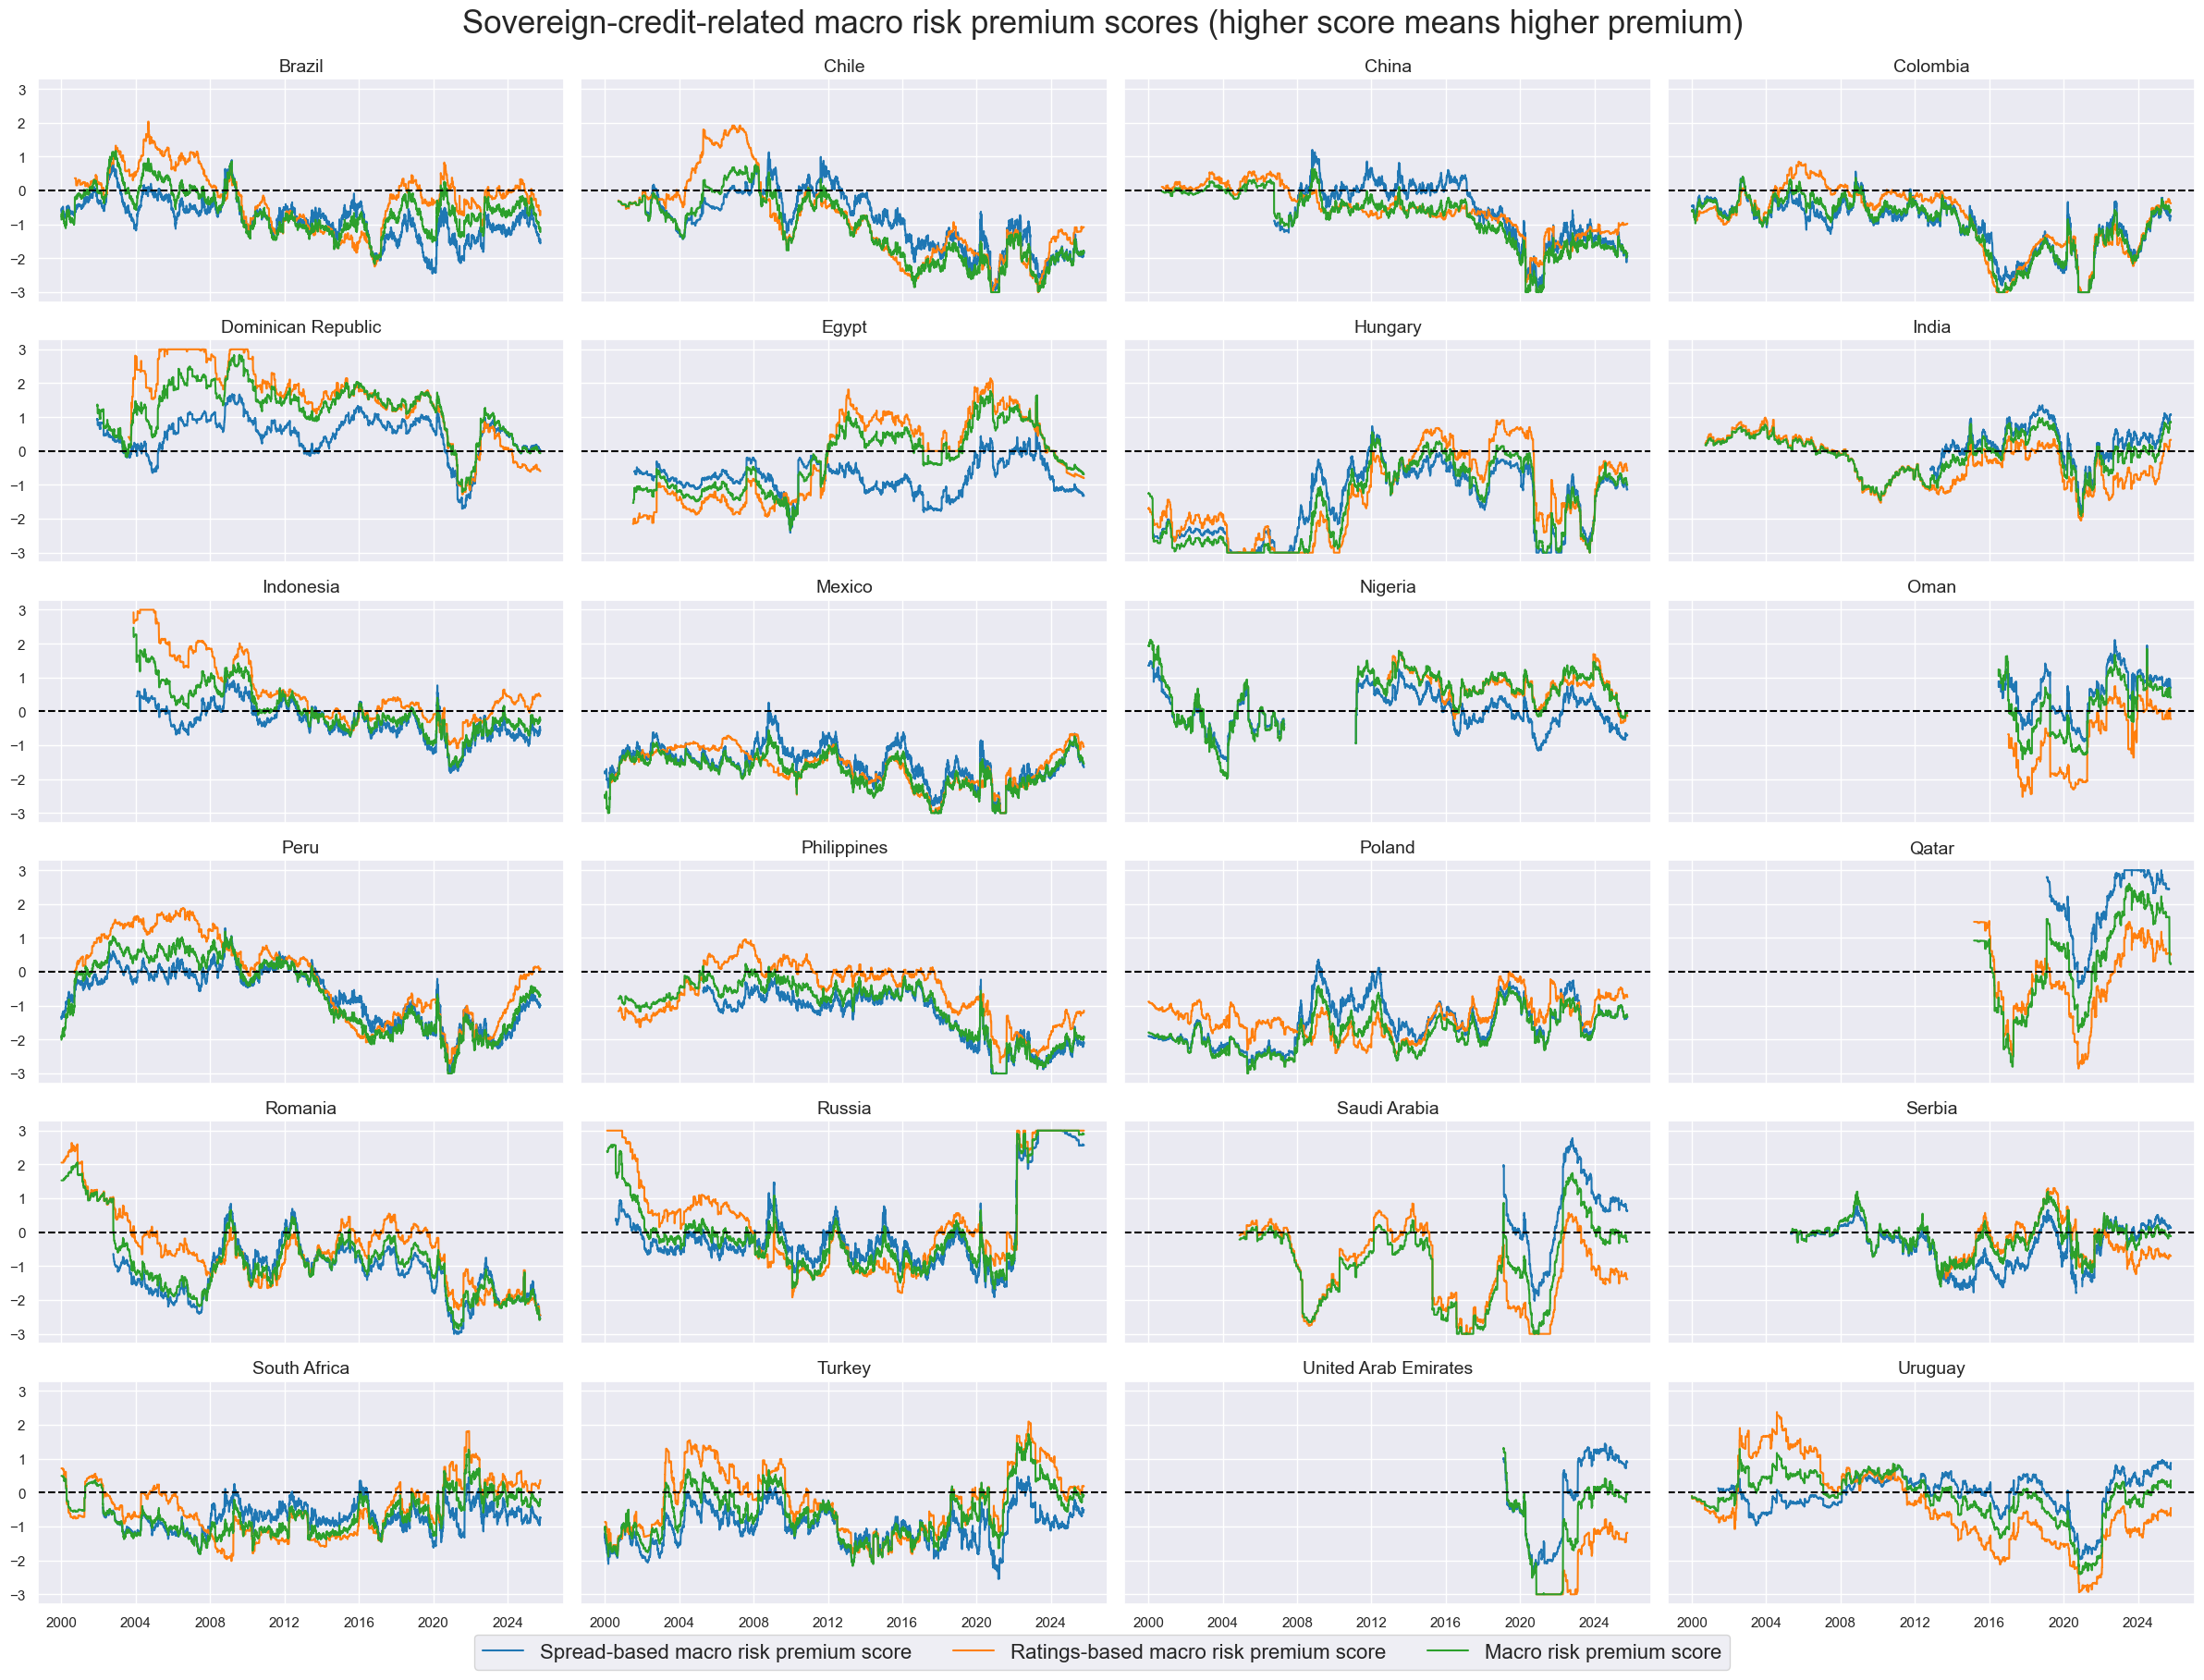
msp.view_timelines(
dfx,
xcats=xcatx,
cids=cidx,
ncol=4,
start=sdate,
same_y=True,
aspect=2,
xcat_labels=dict_labels,
cid_labels=dict_countries,
title="Sovereign-credit-related macro risk premium scores (higher score means higher premium)",
title_fontsize=25,
legend_fontsize=16,
height=2,
)
Conceptual macro risk premium scores #
# Conceptual risk premium scores
calcs = []
for macro in macroz:
calcs += f"{macro[:-3]}_RPS = MARKETRISK_ZN - {macro}",
dfa = msp.panel_calculator(dfx, calcs=calcs, cids=cidx)
dfx = msm.update_df(dfx, dfa)
crps = list(dfa['xcat'].unique())
# Re-z-scoring conceptual risk premium scores
for crp in crps:
dfa = msp.make_zn_scores(
dfx,
xcat=crp,
cids=cidx,
sequential=True,
min_obs=261 * 3,
neutral="zero",
pan_weight=1,
thresh=3,
postfix="_ZN",
est_freq="m",
)
dfx = msm.update_df(dfx, dfa)
crpz = [crp + "_ZN" for crp in crps]
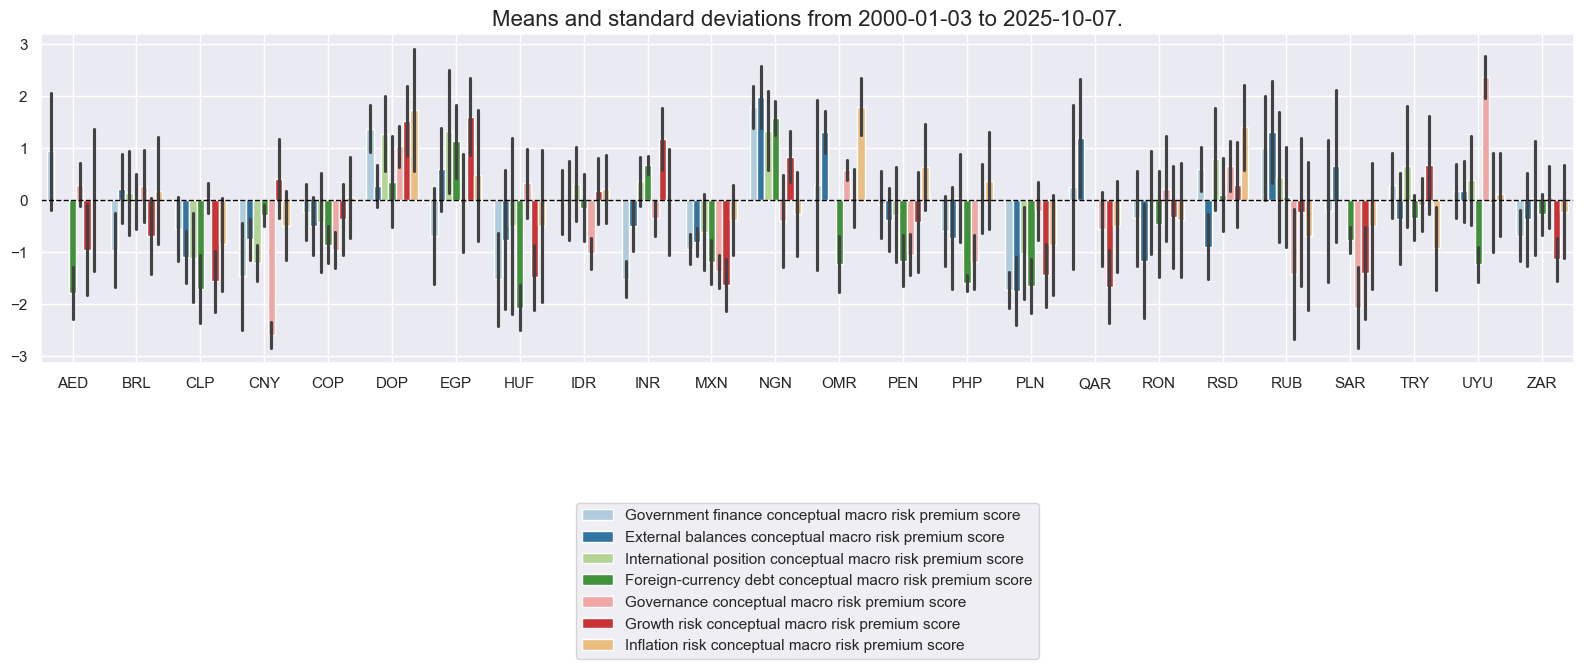
dict_labels['GFINRISK_RPS_ZN'] = 'Government finance conceptual macro risk premium score'
dict_labels['XBALRISK_RPS_ZN'] = 'External balances conceptual macro risk premium score'
dict_labels['XLIABRISK_RPS_ZN'] = 'International position conceptual macro risk premium score'
dict_labels['XDEBTRISK_RPS_ZN'] = 'Foreign-currency debt conceptual macro risk premium score'
dict_labels['GOVRISK_RPS_ZN'] = 'Governance conceptual macro risk premium score'
dict_labels['GROWTHRISK_RPS_ZN'] = 'Growth risk conceptual macro risk premium score'
dict_labels['INFLRISK_RPS_ZN'] = 'Inflation risk conceptual macro risk premium score'
xcatx = crpz
cidx = cids_fc
sdate = "2000-01-01"
msp.view_ranges(
dfx,
xcats=xcatx,
kind="bar",
sort_cids_by=None,
start=sdate,
xcat_labels=dict_labels,
)
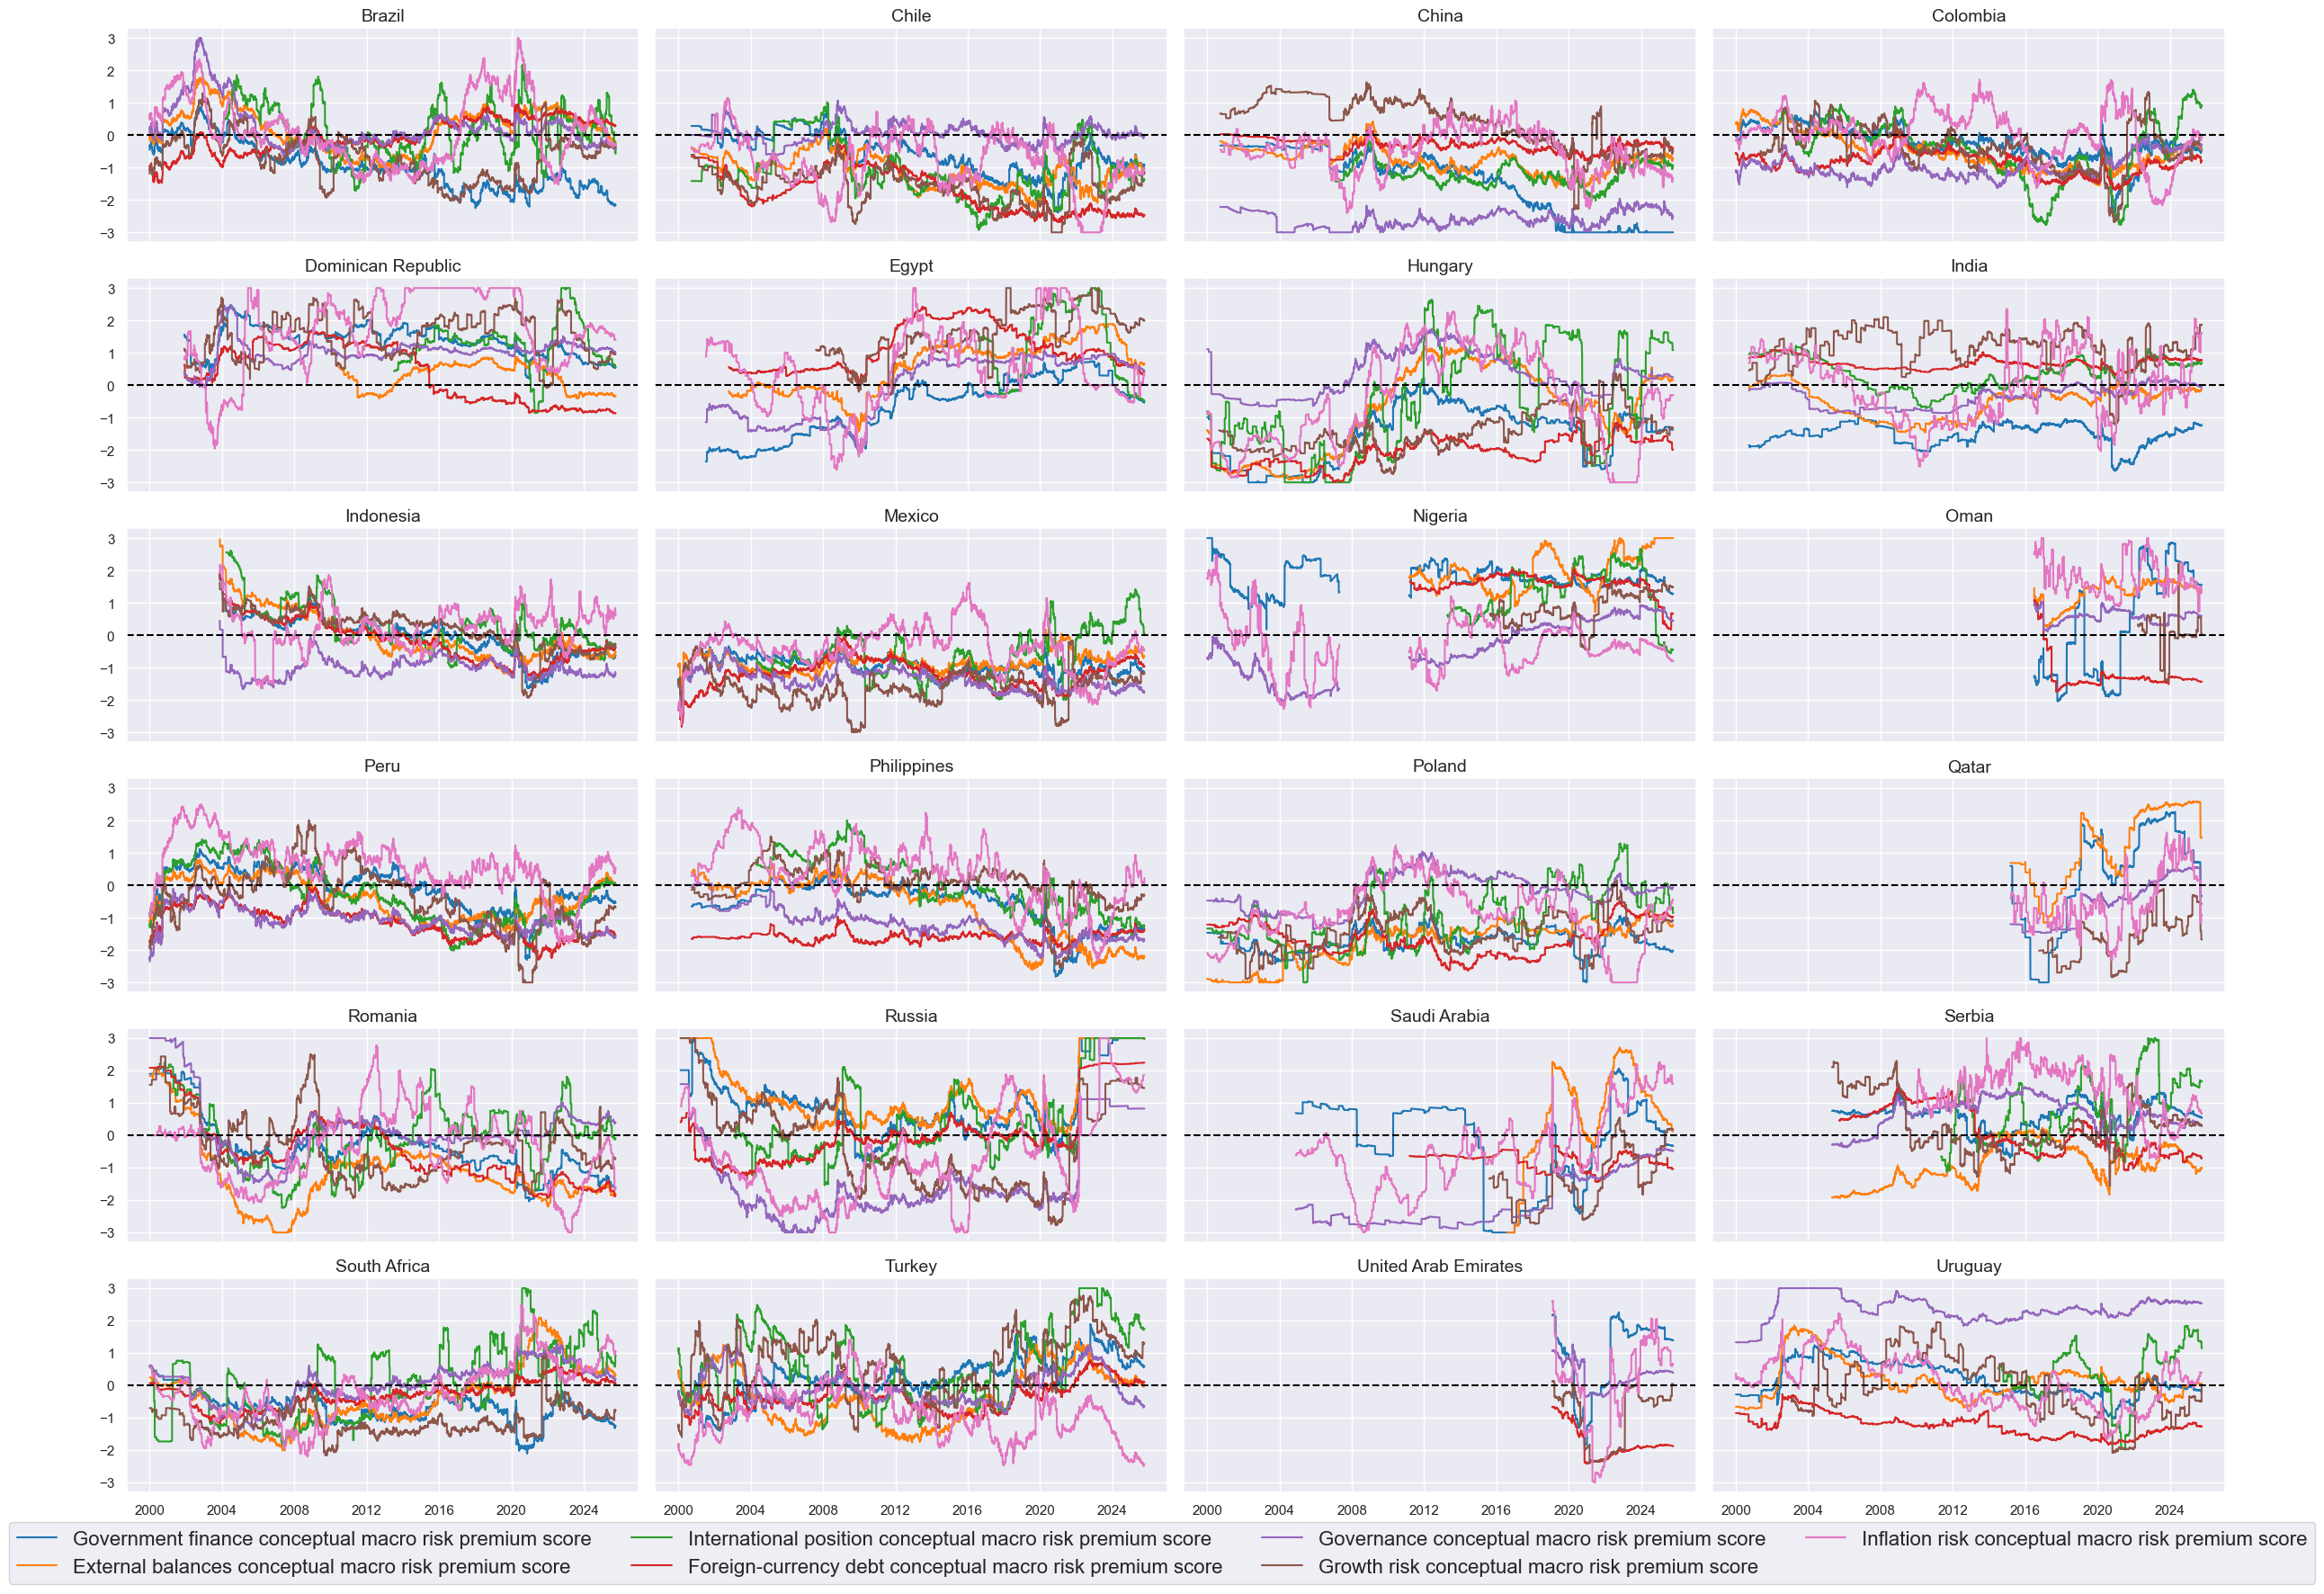
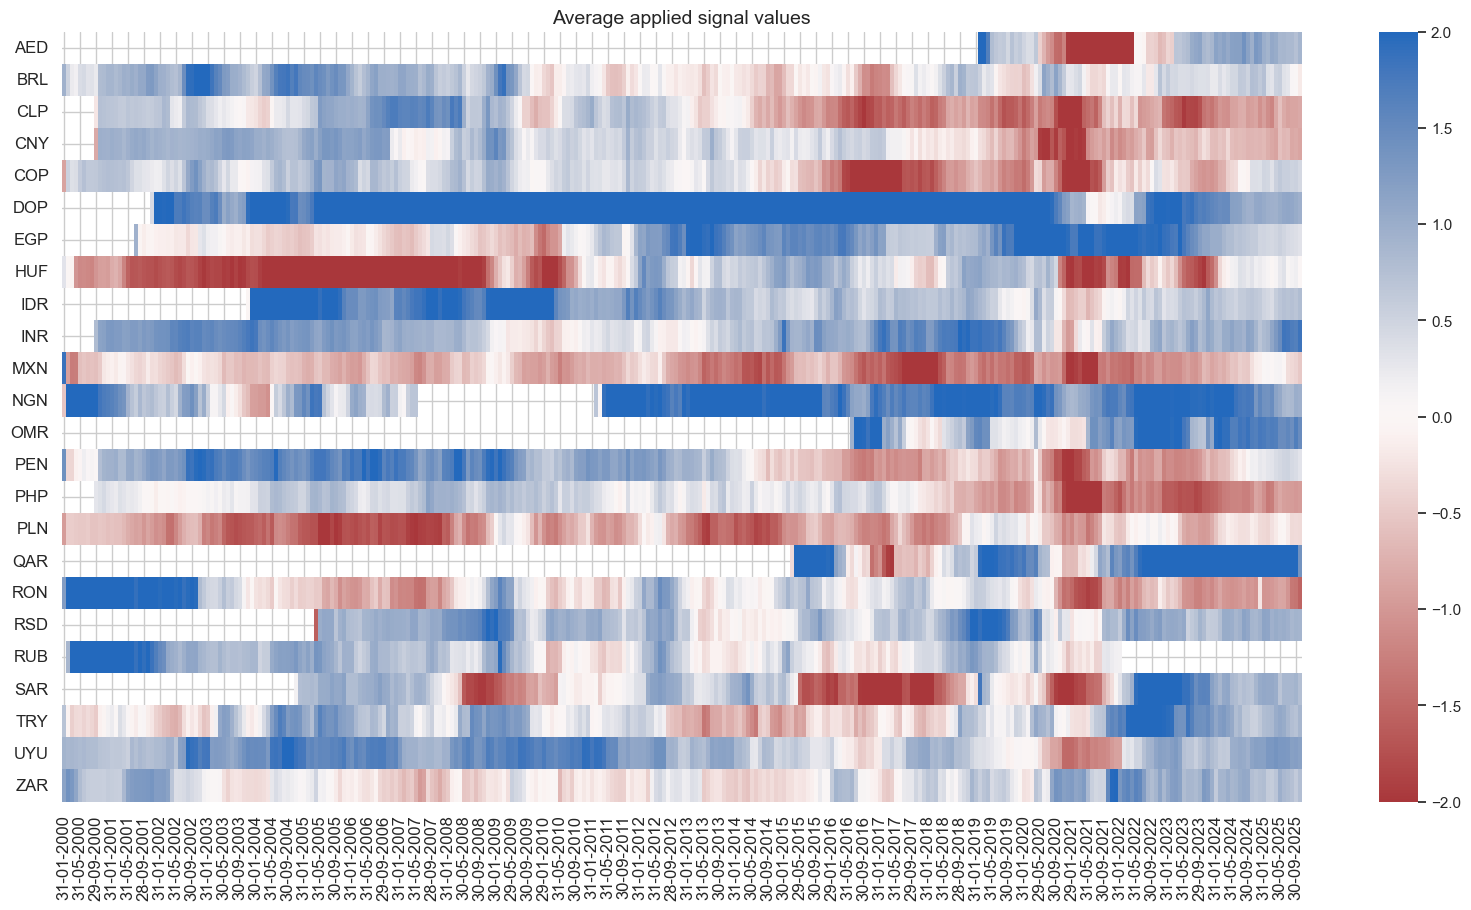
msp.view_timelines(
dfx,
xcats=xcatx,
cids=cidx,
ncol=4,
start=sdate,
same_y=True,
aspect=2,
xcat_labels=dict_labels,
cid_labels=dict_countries,
title=None,
title_fontsize=22,
legend_fontsize=16,
height=2,
)
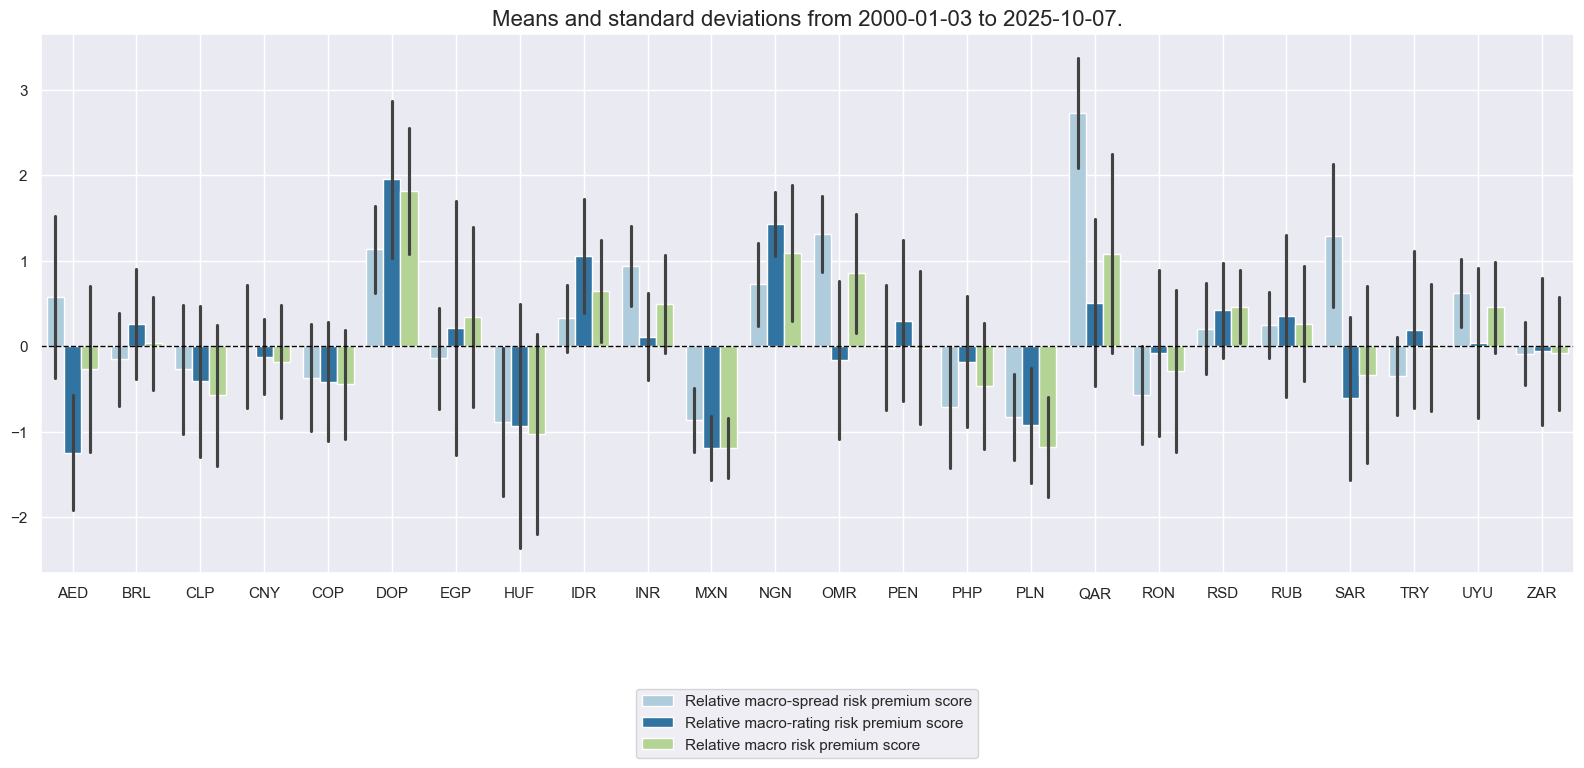
Relative aggregate macro risk premium scores #
cidx = cids_fc
xcatx = xrpz + ["MARKETRISK_ZN", "FCBIXR_NSA", "FCBIXR_VT10"]

dfa = msp.make_relative_value(
    df = dfx,
    xcats = xcatx,
    cids = cidx,
    start="2000-01-01",
    blacklist=black_fc,
    postfix="vEM",
)

dfx = msm.update_df(dfx, dfa)

xrpzr = [xcat + "vEM" for xcat in xrpz]

dict_labels["MACROSPREAD_RPS_ZNvEM"] = "Relative macro-spread risk premium score"
dict_labels["MACRORATING_RPS_ZNvEM"] = "Relative macro-rating risk premium score"
dict_labels["MACROALL_RPS_ZNvEM"] = "Relative macro risk premium score"

dict_labels["MARKETRISK_ZNvEM"] = "Relative market risk score"

dict_labels["MACROSPREAD_RPS_CWS_ZNvEM"] = "Relative macro-spread risk premium score, custom weights"
dict_labels["MACRORATING_RPS_CWS_ZNvEM"] = "Relative macro-rating risk premium score, custom weights"
dict_labels["MACROALL_RPS_CWS_ZNvEM"] = "Relative macro risk premium score, custom weights"
cidx = cids_fc
xcatx = [rp + "vEM" for rp in rpz]
sdate = "2000-01-01"
msp.view_ranges(
dfx,
xcats=xcatx,
kind="bar",
sort_cids_by=None,
start=sdate,
xcat_labels=dict_labels,
)
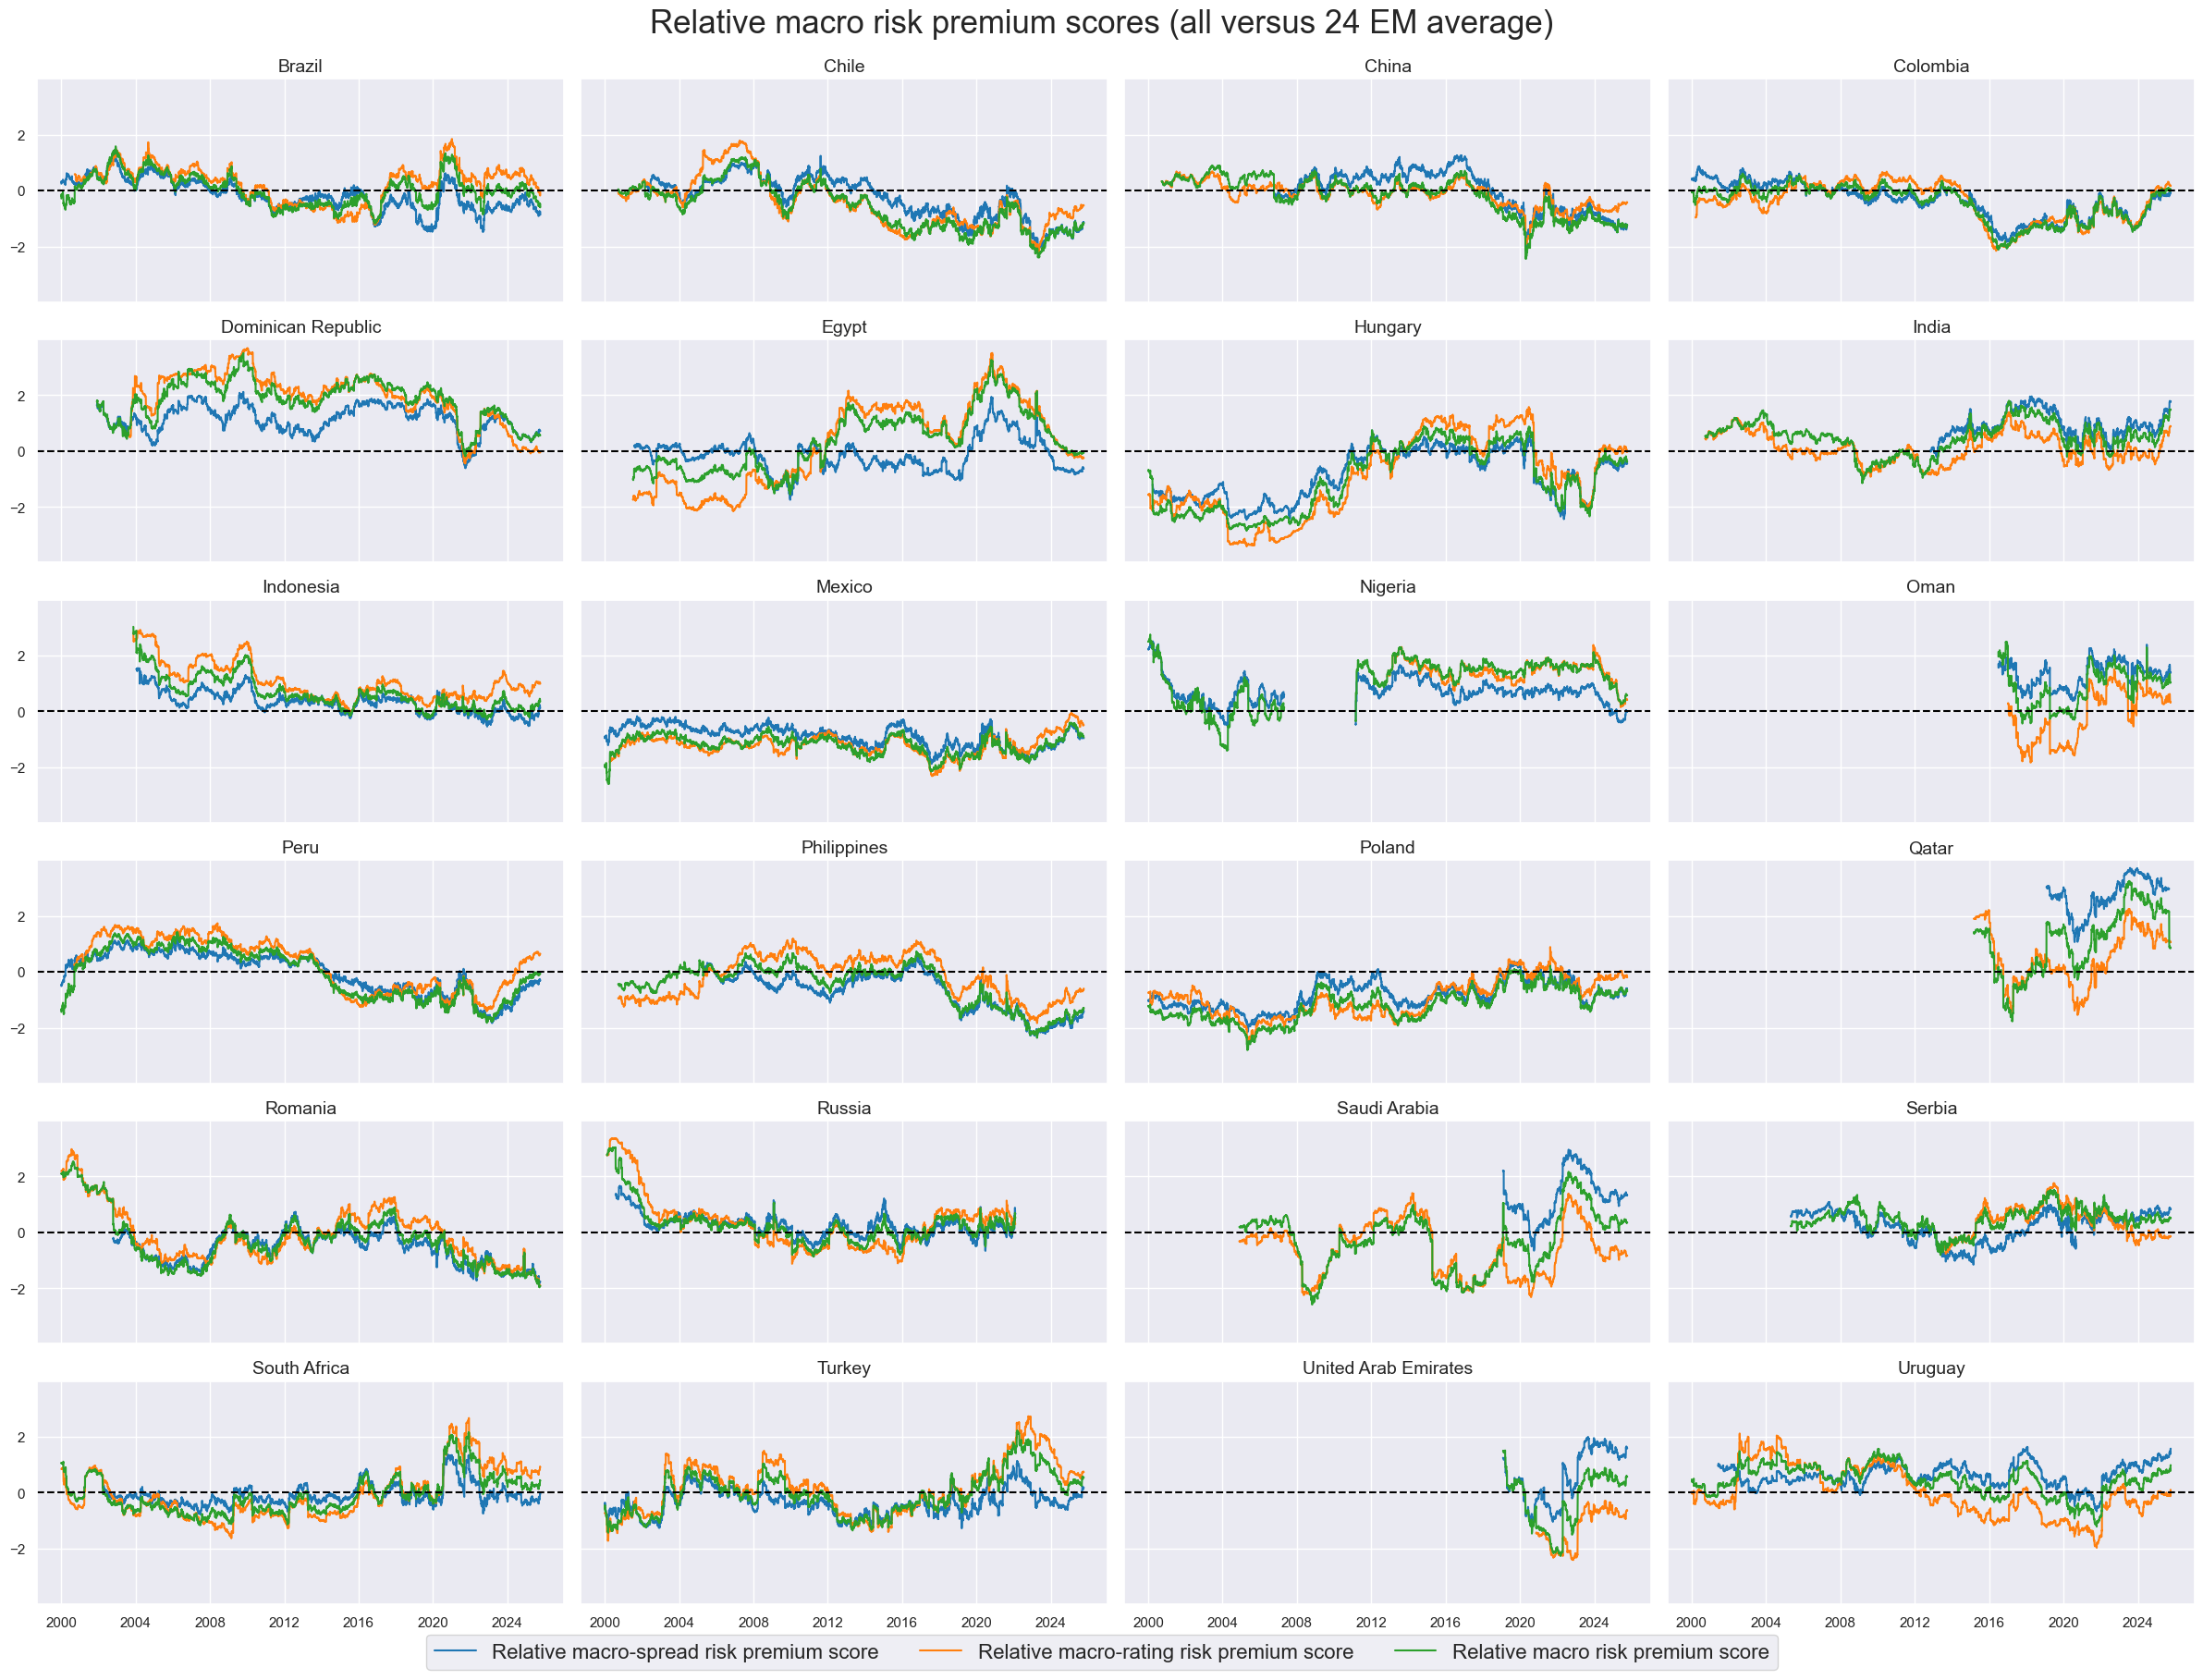
msp.view_timelines(
dfx,
xcats=xcatx,
cids=cidx,
ncol=4,
start=sdate,
same_y=True,
aspect=2,
xcat_labels=dict_labels,
cid_labels=dict_countries,
title="Relative macro risk premium scores (all versus 24 EM average)",
title_fontsize=25,
legend_fontsize=16,
height=2,
)
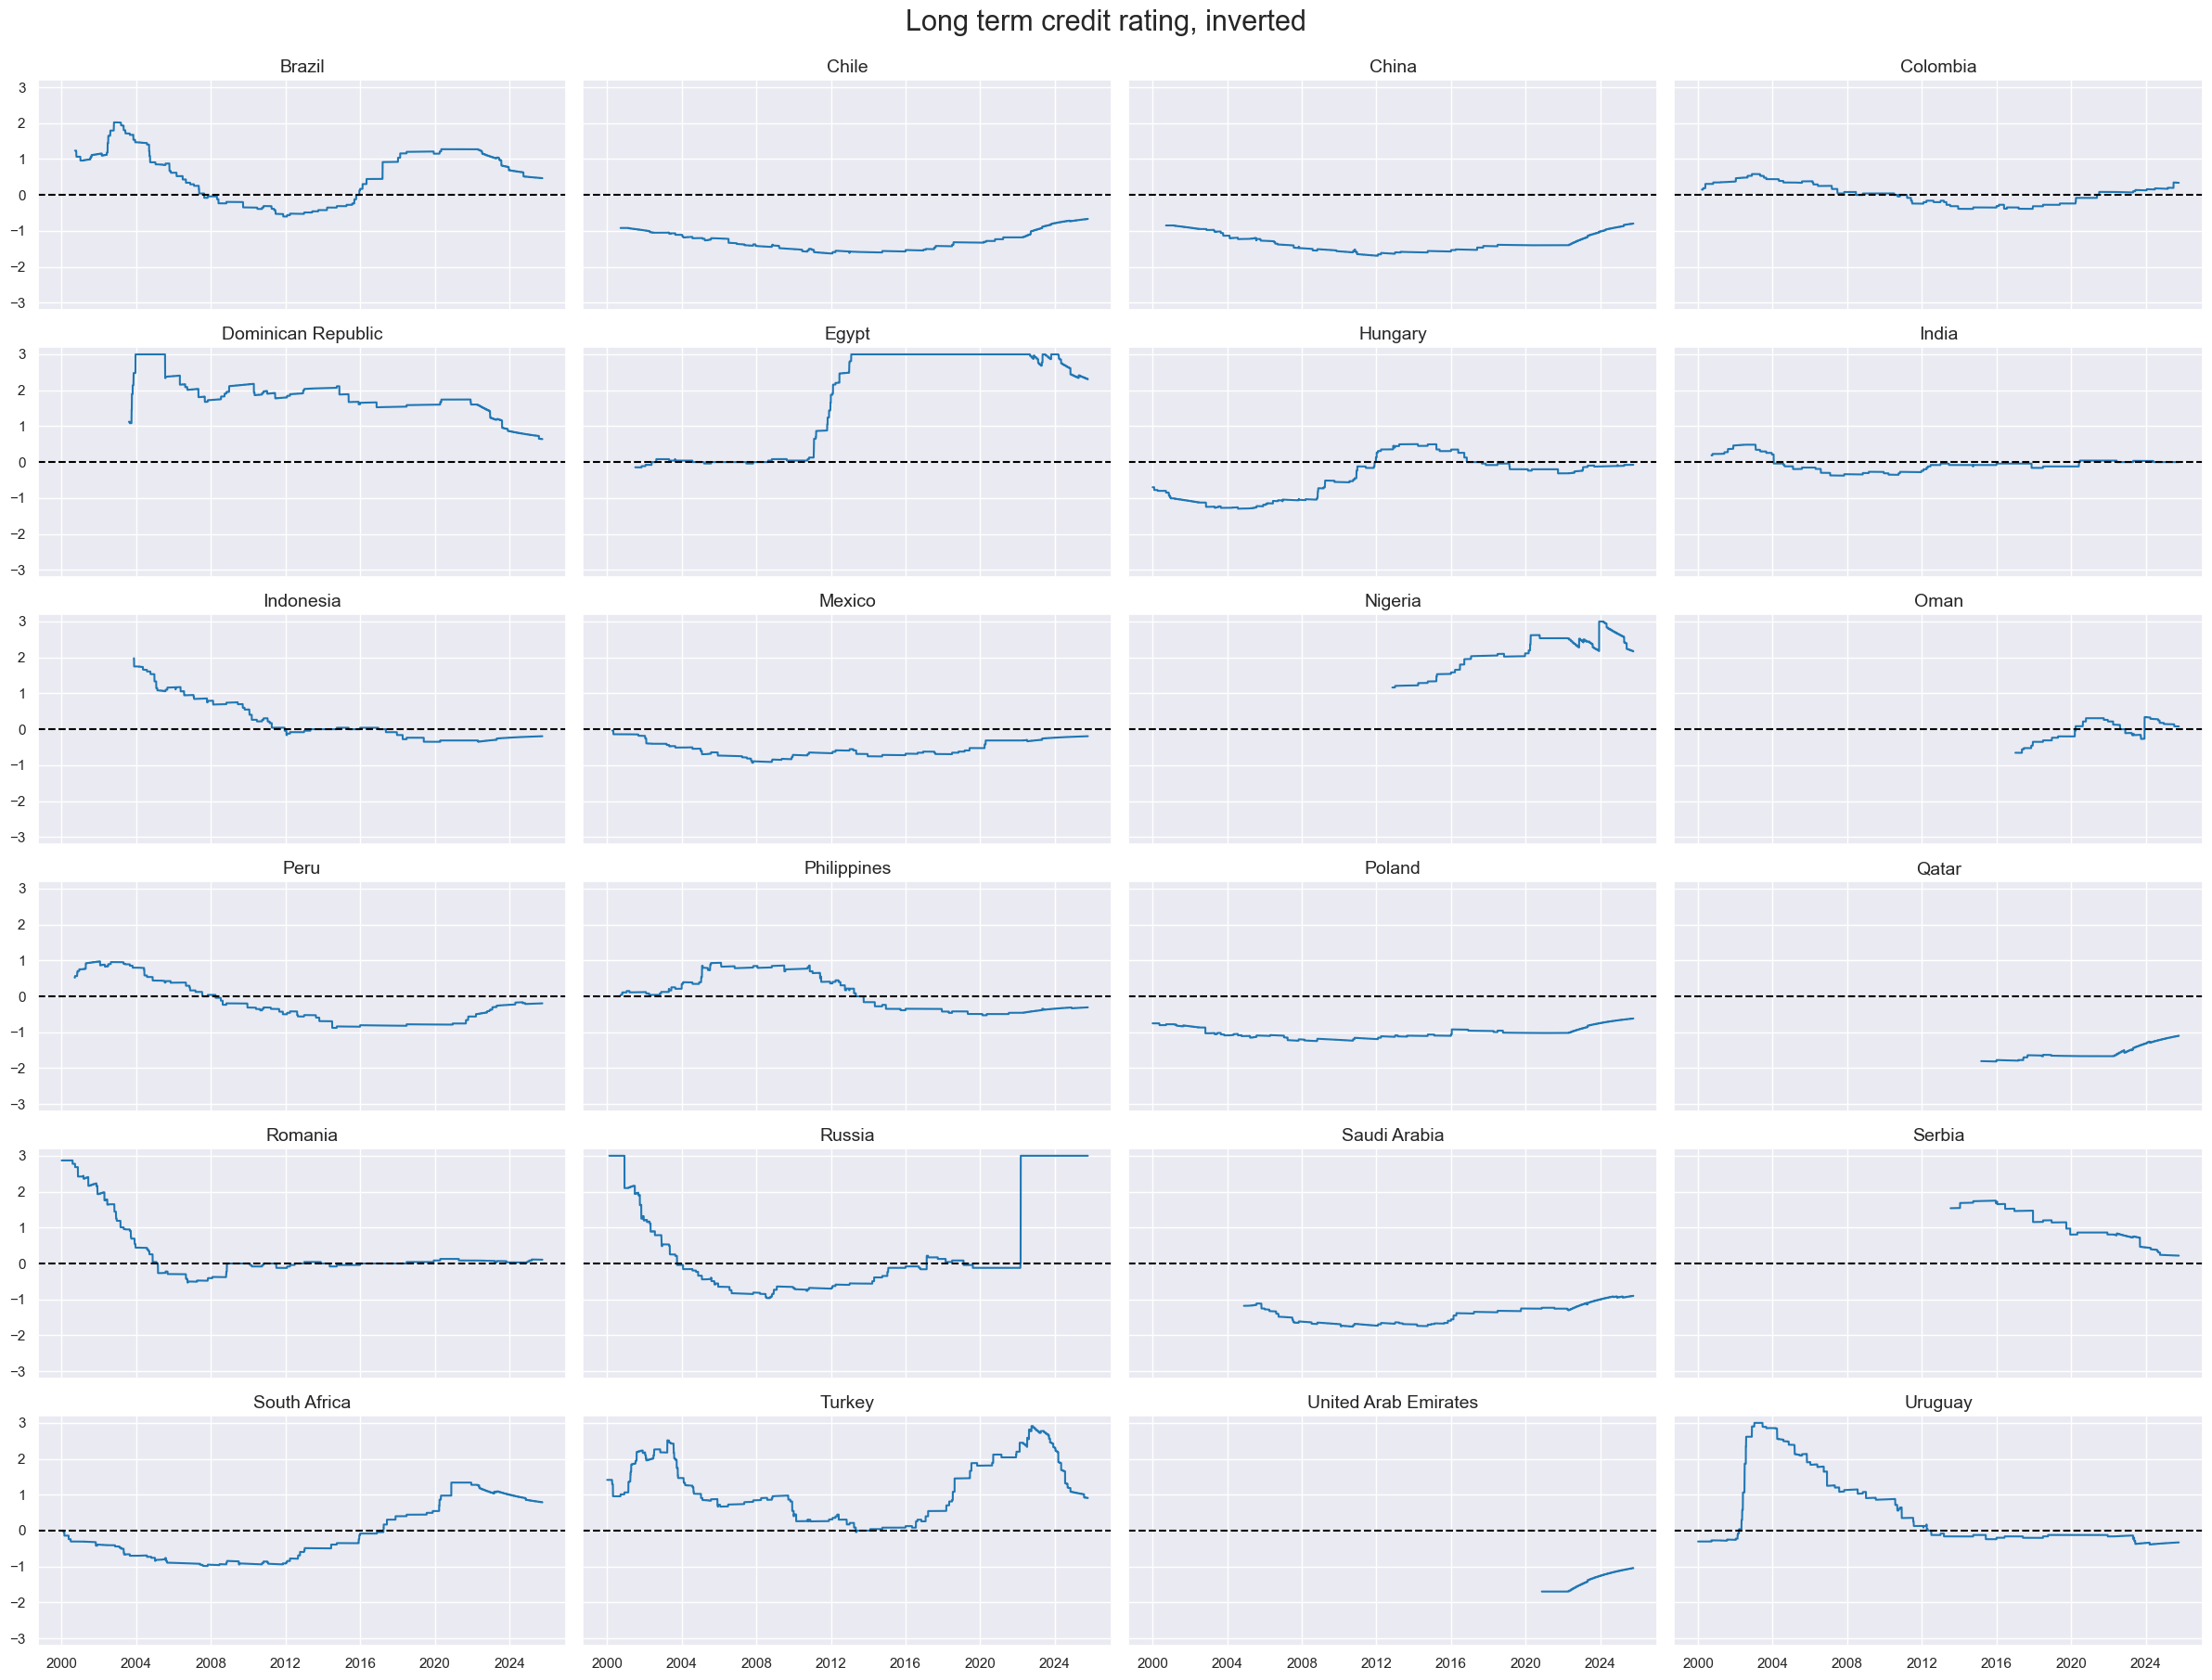
cidx = cids_fc
xcatx = ["LTFCRATING_INV_ZN"]
sdate = "2000-01-01"

msp.view_ranges(
    dfx,
    xcats=xcatx,
    kind="bar",
    sort_cids_by=None,
    start=sdate,
)

msp.view_timelines(
    dfx,
    xcats=xcatx,
    cids=cidx,
    ncol=4,
    start=sdate,
    same_y=True,
    cid_labels=dict_countries,
    aspect=2,
    title='Long term credit rating, inverted',
    title_fontsize=22,
    legend_fontsize=16,
    height=2,
)
Value checks #
Composite directional signals #
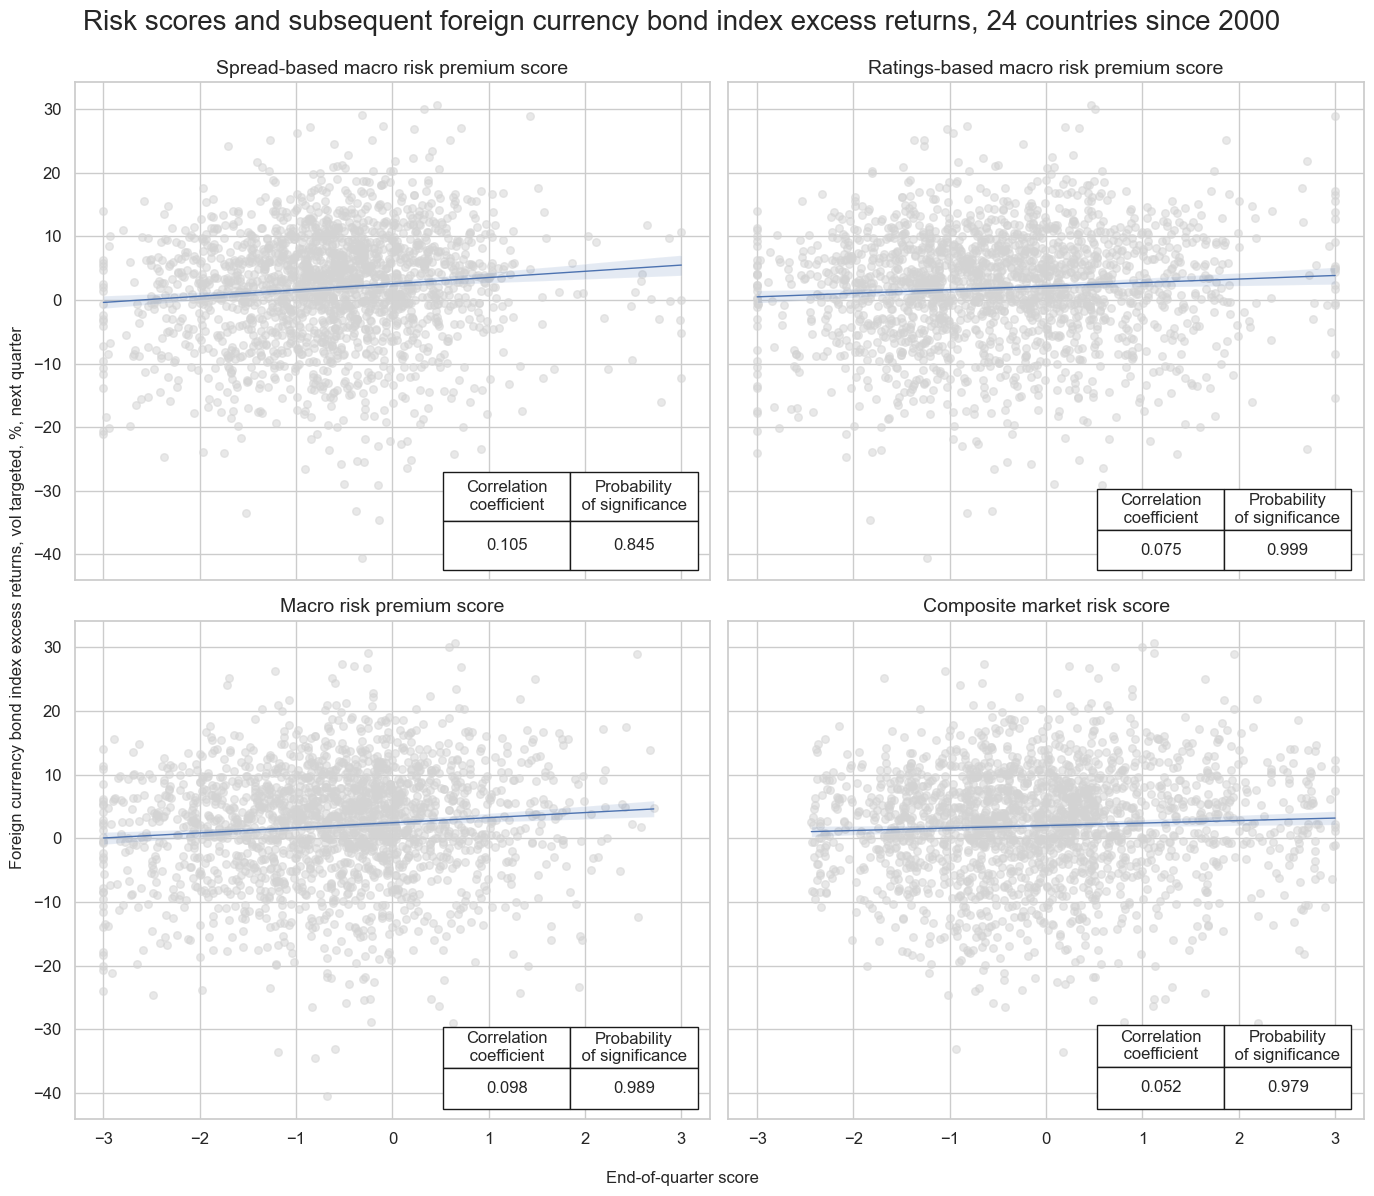
Specs and panel test #
dict_dir = {
    "sigs": ['MACROSPREAD_RPS_ZN','MACRORATING_RPS_ZN', 'MACROALL_RPS_ZN', 'MARKETRISK_ZN'],
    "targs": ["FCBIXR_VT10", "FCBIXR_NSA"],
    "cidx": cids_fc,
    "start": "2000-01-01",
    "black": black_fc,
}
dix = dict_dir

sigs = dix['sigs']
ret = dix["targs"][0]
cidx = dix["cidx"]
start = dix["start"]
black = dix["black"]

catregs = {}
for sig in sigs:
    catregs[sig] = msp.CategoryRelations(
        dfx,
        xcats=[sig, ret],
        cids=cidx,
        freq="Q",
        lag=1,
        xcat_aggs=["last", "sum"],
        start=start,
        blacklist=black,
    )

msv.multiple_reg_scatter(
    cat_rels=[v for k, v in catregs.items()],
    ncol=2,
    nrow=2,
    figsize=(14, 12),
    title="Risk scores and subsequent foreign currency bond index excess returns, 24 countries since 2000",
    title_fontsize=20,
    xlab="End-of-quarter score",
    ylab="Foreign currency bond index excess returns, vol targeted, %, next quarter",
    coef_box="lower right",
    prob_est="map",
    single_chart=True,
    subplot_titles=[dict_labels[key] for key in sigs]
)
dix = dict_dir
sig = dix["sigs"][2]
ret = dix["targs"][0]
cidx = dix["cidx"]
start = dix["start"]
black = dix["black"]
cr = msp.CategoryRelations(
dfx,
xcats=[sig, ret],
cids=cidx,
freq="Q",
years=None,
lag=1,
xcat_aggs=["last", "sum"], # period mean adds stability
start=start,
blacklist=black,
)
cr.reg_scatter(
title="Macro risk premia and subsequent foreign currency bond index excess returns, 24 countries since 2000",
labels=False,
xlab="Sovereign credit macro risk premium score, end of quarter",
ylab="Foreign currency bond index excess returns, vol targeted, %, next quarter",
coef_box="lower right",
prob_est="map",
separator=2013,
size=(10, 8),
)
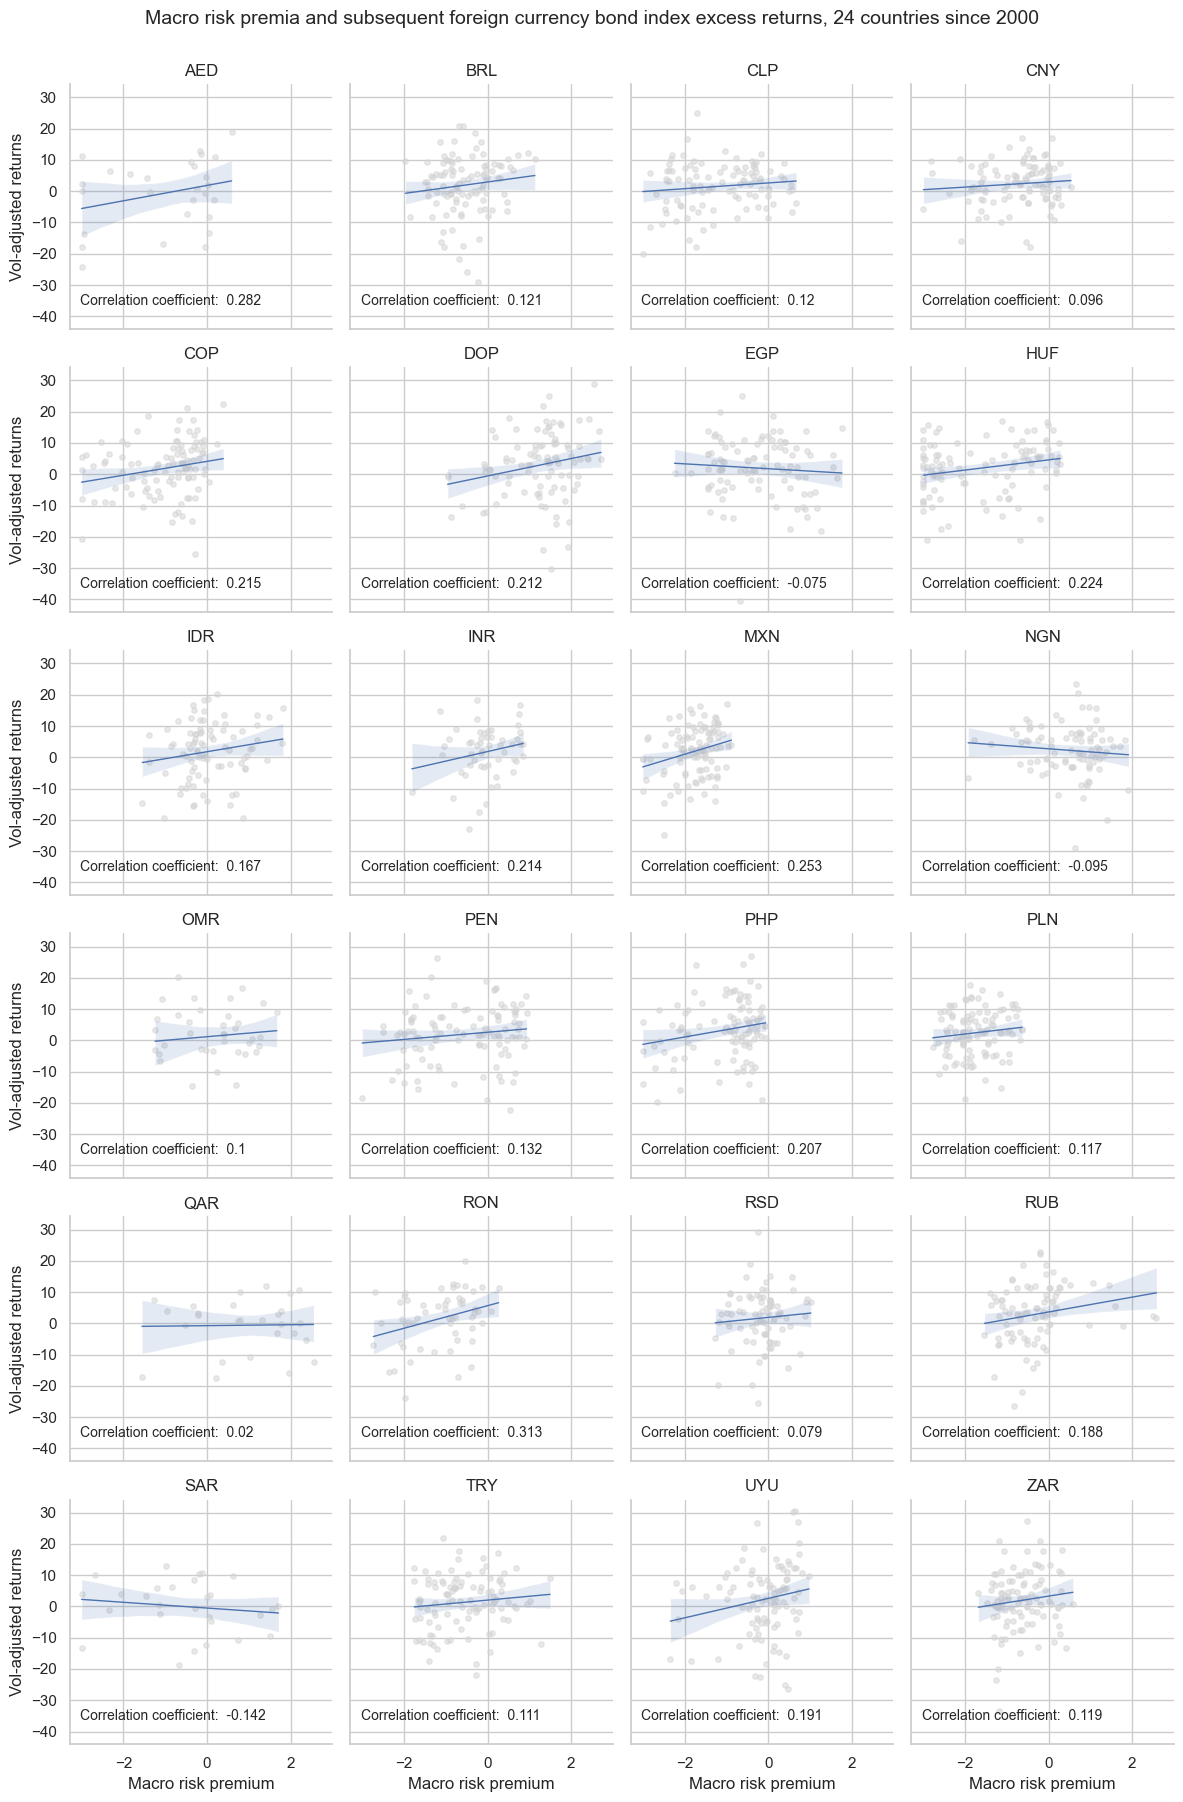
cr.reg_scatter(
title="Macro risk premia and subsequent foreign currency bond index excess returns, 24 countries since 2000",
labels=False,
xlab="Macro risk premium",
ylab="Vol-adjusted returns",
coef_box="lower right",
prob_est="pool",
separator="cids",
)
Accuracy and correlation check #
dix = dict_dir

sigs = dix['sigs']
ret = dix["targs"][0]
cidx = dix["cidx"]
start = dix["start"]
black = dix["black"]

srr = mss.SignalReturnRelations(
    dfx,
    rets=ret,
    cids=cidx,
    sigs=sigs,
    # cosp=True,
    freqs="M",
    agg_sigs=["last"],  # for stability
    start=start,
)

dix["srr"] = srr
dix = dict_dir
srr = dix["srr"]

tbl=srr.multiple_relations_table(signal_name_dict=dict_labels).round(3)
display(tbl.transpose())
| Return | Vol-targeted foreign-currency sovereign bond index return, % | |||
|---|---|---|---|---|
| Signal | Composite market risk score | Spread-based macro risk premium score | Ratings-based macro risk premium score | Macro risk premium score |
| Frequency | M | M | M | M |
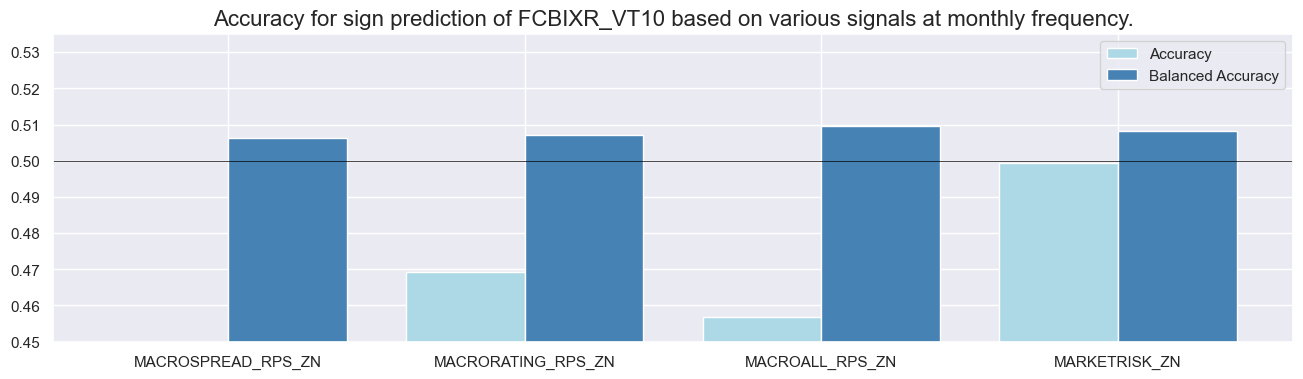
| Aggregation | last | last | last | last |
| accuracy | 0.499 | 0.445 | 0.469 | 0.457 |
| bal_accuracy | 0.508 | 0.506 | 0.507 | 0.510 |
| pos_sigr | 0.463 | 0.246 | 0.341 | 0.284 |
| pos_retr | 0.618 | 0.617 | 0.617 | 0.618 |
| pos_prec | 0.627 | 0.626 | 0.626 | 0.632 |
| neg_prec | 0.390 | 0.386 | 0.388 | 0.387 |
| pearson | 0.018 | 0.037 | 0.032 | 0.038 |
| pearson_pval | 0.169 | 0.005 | 0.015 | 0.003 |
| kendall | 0.023 | 0.041 | 0.026 | 0.034 |
| kendall_pval | 0.007 | 0.000 | 0.004 | 0.000 |
| auc | 0.509 | 0.505 | 0.507 | 0.508 |
dix = dict_dir
srr = dix["srr"]
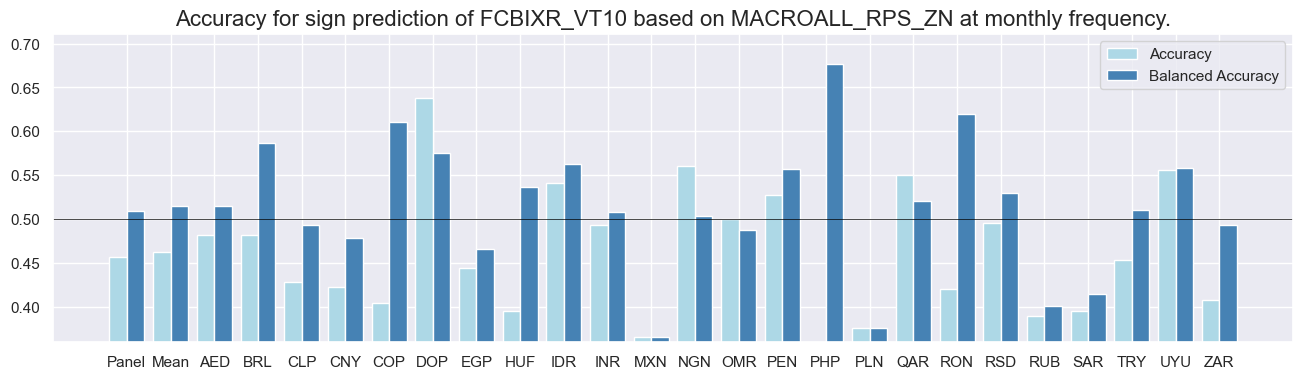
srr.accuracy_bars(type='cross_section', sigs="MACROALL_RPS_ZN", size=(16, 4))
srr.accuracy_bars(type='signals', size=(16, 4))
dix = dict_dir
srr = dix["srr"]
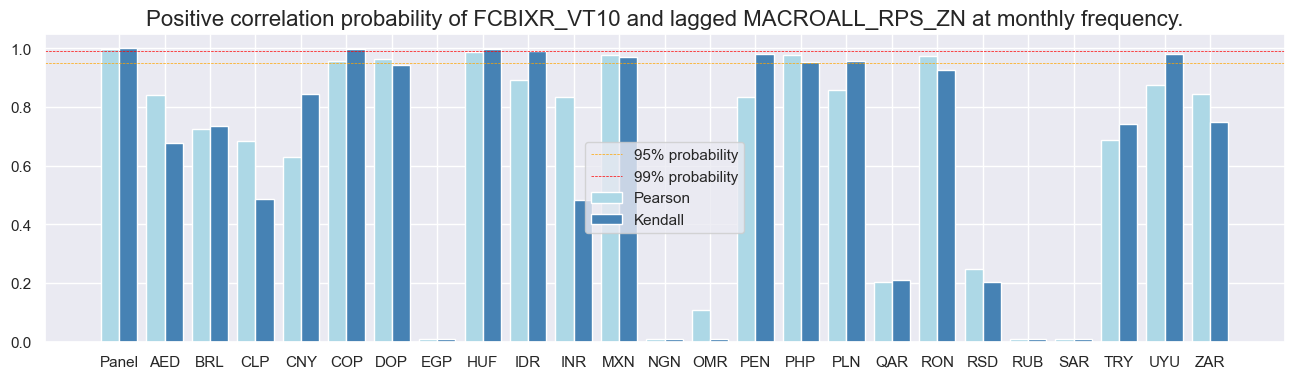
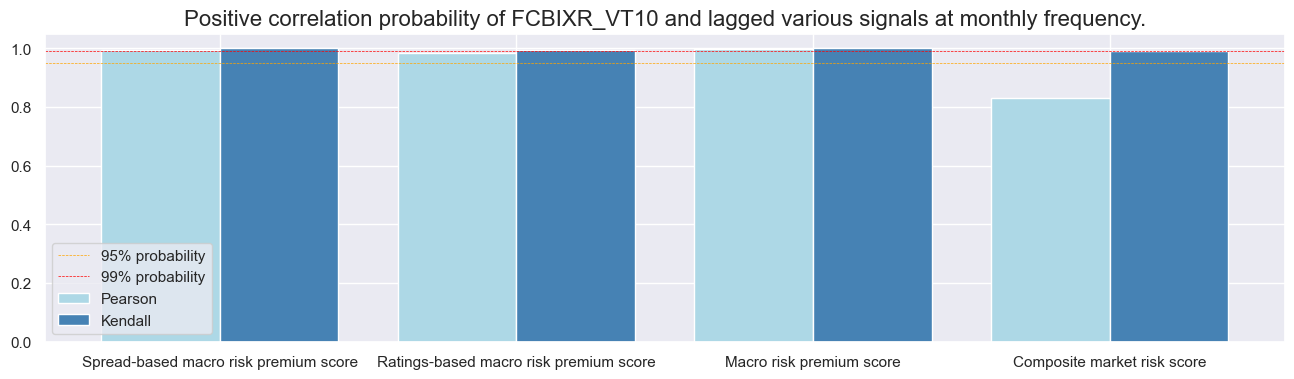
srr.correlation_bars(type='cross_section', sigs="MACROALL_RPS_ZN", size=(16, 4))
srr.correlation_bars(type='signals', size=(16, 4), x_labels=dict_labels)
Naive PnLs #
dix = dict_dir

sigs = dix['sigs']
ret = dix["targs"][0]
cidx = dix["cidx"]
start = dix["start"]
black = dix["black"]

rt = ret.split('_')[-1]  # 'NSA' or 'VT10'

pnls = msn.NaivePnL(
    df=dfx,
    ret=ret,
    sigs=sigs,
    cids=cidx,
    start=start,
    blacklist=black,
    bms=bms,
)
for sig in sigs:
    for bias in [0, 1]:
        pnls.make_pnl(
            sig=sig,
            sig_op="zn_score_pan",
            thresh=2,
            sig_add = bias,
            rebal_freq="monthly",
            neutral="zero",
            pnl_name=sig + "_PNL" + rt + str(bias),
            rebal_slip=1,
            vol_scale=10,
    )
pnls.make_long_pnl(vol_scale=10, label="Long only")

dix["pnls_"+rt.lower()] = pnls
dix = dict_dir
rt = "VT10"
bias = 1
pnls = dix["pnls_"+rt.lower()]
sigs = ["MACROALL_RPS_ZN", "MARKETRISK_ZN"]
strats = [sig + "_PNL" + rt + str(bias) for sig in sigs]
pnl_labels = {
"MACROALL_RPS_ZN_PNL" + rt + str(bias): "Macro risk premium score with long bias",
"MARKETRISK_ZN_PNL" + rt + str(bias): "Market risk score with long bias",
"Long only": "Long only risk parity",
}
pnls.plot_pnls(
title="Naive PnL for risk-premia and benchmark strategies, 24 EM sovereigns, vol-targeted positions",
pnl_cats=strats + ["Long only"],
xcat_labels=pnl_labels,
title_fontsize=14,
)
display(pnls.evaluate_pnls(pnl_cats=strats + ["Long only"]).round(3))
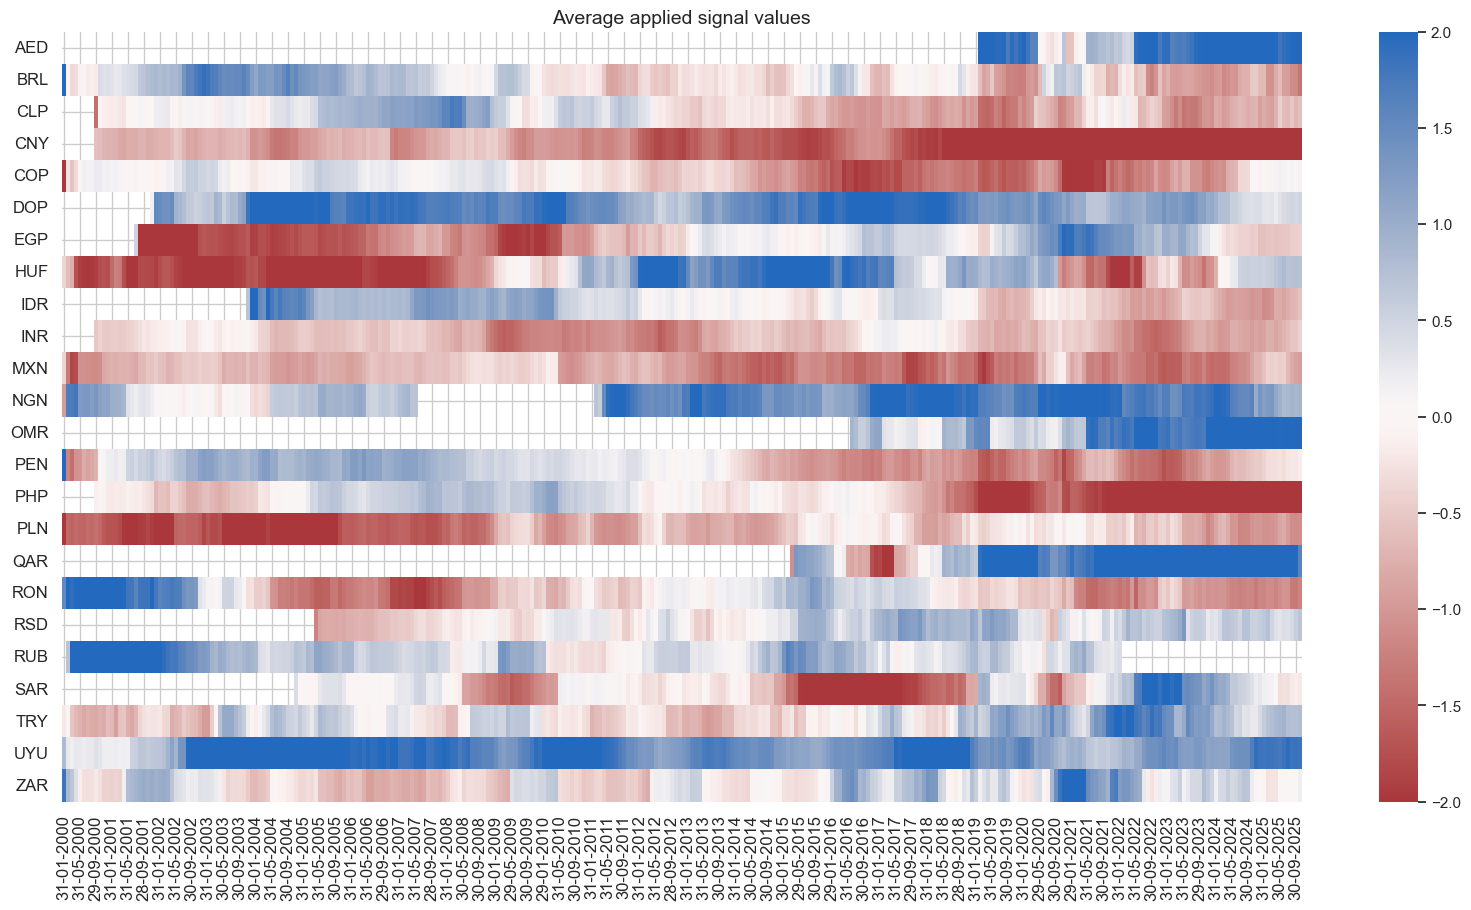
pnls.signal_heatmap(pnl_name=f"MACROALL_RPS_ZN_PNL" + rt + str(bias), figsize=(20, 10))
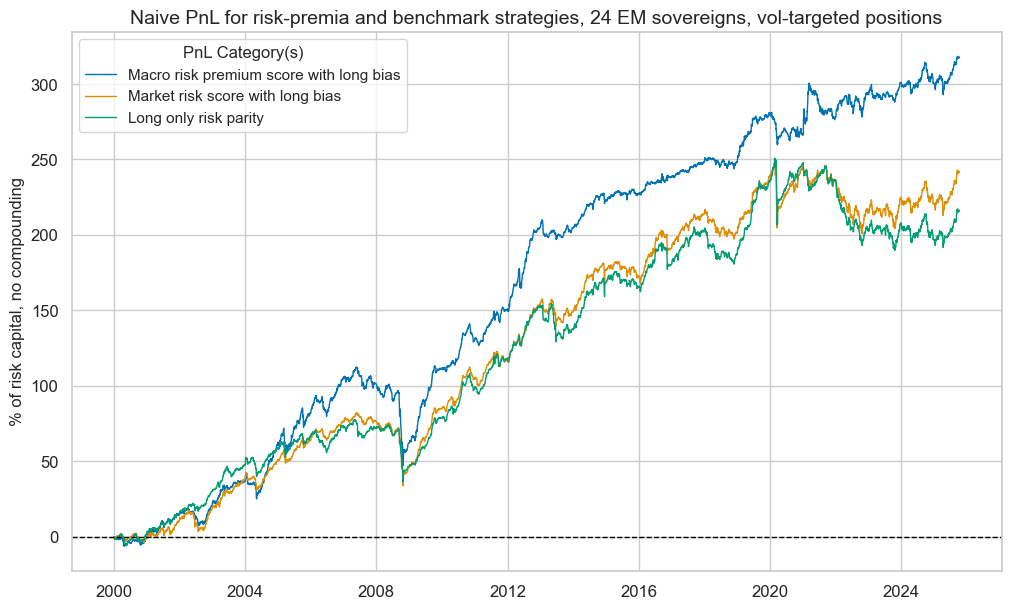
| xcat | MACROALL_RPS_ZN_PNLVT101 | MARKETRISK_ZN_PNLVT101 | Long only |
|---|---|---|---|
| Return % | 12.333653 | 9.384737 | 8.383397 |
| St. Dev. % | 10.0 | 10.0 | 10.0 |
| Sharpe Ratio | 1.233365 | 0.938474 | 0.83834 |
| Sortino Ratio | 1.759661 | 1.263331 | 1.111366 |
| Max 21-Day Draw % | -36.948827 | -41.336808 | -42.62663 |
| Max 6-Month Draw % | -53.182929 | -41.268487 | -37.303719 |
| Peak to Trough Draw % | -65.259735 | -48.568348 | -61.090769 |
| Top 5% Monthly PnL Share | 0.486058 | 0.551428 | 0.638043 |
| USD_EQXR_NSA correl | 0.193814 | 0.293867 | 0.214447 |
| UHY_CRXR_NSA correl | 0.23257 | 0.350609 | 0.272986 |
| UIG_CRXR_NSA correl | 0.232801 | 0.331488 | 0.252681 |
| Traded Months | 310 | 310 | 310 |
dix = dict_dir

sigs = dix['sigs']
ret = dix["targs"][1]
cidx = dix["cidx"]
start = dix["start"]
black = dix["black"]

rt = ret.split('_')[-1]  # 'NSA' or 'VT10'

pnls = msn.NaivePnL(
    df=dfx,
    ret=ret,
    sigs=sigs,
    cids=cidx,
    start=start,
    blacklist=black,
    bms=bms,
)
for sig in sigs:
    for bias in [0, 1]:
        pnls.make_pnl(
            sig=sig,
            sig_op="zn_score_pan",
            thresh=2,
            sig_add = bias,
            rebal_freq="monthly",
            neutral="zero",
            pnl_name=sig + "_PNL" + rt + str(bias),
            rebal_slip=1,
            vol_scale=10,
    )
pnls.make_long_pnl(vol_scale=10, label="Long only")

dix["pnls_"+rt.lower()] = pnls
dix = dict_dir
rt = "NSA"
bias = 1
pnls = dix["pnls_"+rt.lower()]

sigs = ["MACROALL_RPS_ZN", "MARKETRISK_ZN"]
strats = [sig + "_PNL" + rt + str(bias) for sig in sigs]

pnl_labels = {
    "MACROALL_RPS_ZN_PNL" + rt + str(bias): "Macro risk premium score with long bias",
    "MARKETRISK_ZN_PNL" + rt + str(bias): "Market risk score with long bias",
    "Long only": "Long only risk parity",
}

pnls.plot_pnls(
    title="Naive PnL for risk-premia and benchmark strategies, 24 EM sovereigns, nominal positions",
    pnl_cats=strats + ["Long only"],
    xcat_labels=pnl_labels,
    title_fontsize=14,
)
display(pnls.evaluate_pnls(pnl_cats=strats + ["Long only"], label_dict=pnl_labels).round(3))
pnls.signal_heatmap(pnl_name=f"MACROALL_RPS_ZN_PNL" + rt + str(bias), figsize=(20, 10))
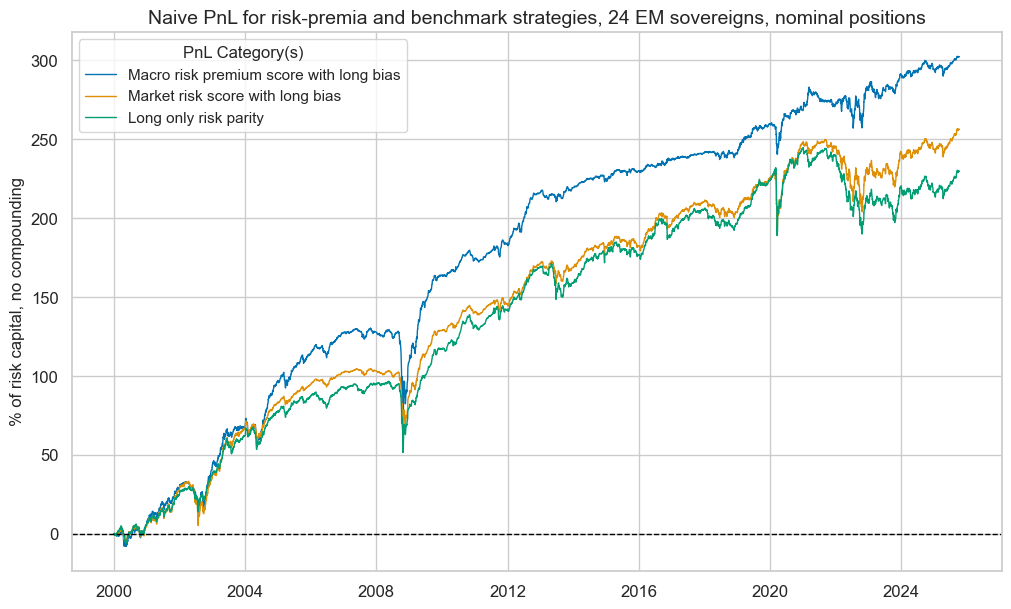
| xcat | Macro risk premium score with long bias | Market risk score with long bias | Long only risk parity |
|---|---|---|---|
| Return % | 11.738645 | 9.951539 | 8.919248 |
| St. Dev. % | 10.0 | 10.0 | 10.0 |
| Sharpe Ratio | 1.173864 | 0.995154 | 0.891925 |
| Sortino Ratio | 1.686354 | 1.38463 | 1.20689 |
| Max 21-Day Draw % | -48.652744 | -37.587981 | -41.008912 |
| Max 6-Month Draw % | -56.262944 | -42.508518 | -44.463699 |
| Peak to Trough Draw % | -57.506774 | -45.765632 | -54.792592 |
| Top 5% Monthly PnL Share | 0.545323 | 0.579061 | 0.575225 |
| USD_EQXR_NSA correl | 0.236981 | 0.309005 | 0.270692 |
| UHY_CRXR_NSA correl | 0.291181 | 0.379333 | 0.343562 |
| UIG_CRXR_NSA correl | 0.322025 | 0.377098 | 0.330492 |
| Traded Months | 310 | 310 | 310 |
Conceptual directional signals #
Specs and panel test #
dict_cds = {
    "sigs": crpz + ['MARKETRISK_ZN'],
    "targs": ["FCBIXR_VT10", "FCBIXR_NSA"],
    "cidx": cids_fc,
    "start": "2000-01-01",
    "black": black_fc,
}
dix = dict_cds

sigs = dix['sigs']
ret = dix["targs"][0]
cidx = dix["cidx"]
start = dix["start"]
black = dix["black"]

catregs = {}
for sig in sigs:
    catregs[sig] = msp.CategoryRelations(
        dfx,
        xcats=[sig, ret],
        cids=cidx,
        freq="Q",
        lag=1,
        xcat_aggs=["mean", "sum"],
        start=start,
        blacklist=black,
    )

msv.multiple_reg_scatter(
    cat_rels=[v for k, v in catregs.items()],
    ncol=2,
    nrow=4,
    figsize=(14, 24),
    title="Spread-based premium scores and sovereign bond index returns, 24 EMBI countries, since 2000 or inception",
    title_fontsize=20,
    xlab="End-of-quarter score",
    ylab="Foreign currency bond index excess returns, vol targeted, %, next quarter",
    coef_box="lower right",
    prob_est="map",
    single_chart=True,
    subplot_titles=[dict_labels[key] for key in sigs]
)
XBALRISK_RPS_ZN misses: ['AED'].
XLIABRISK_RPS_ZN misses: ['AED', 'OMR', 'QAR', 'SAR'].
XDEBTRISK_RPS_ZN misses: ['QAR'].
Accuracy and correlation check #
dix = dict_cds

sigs = dix['sigs']
ret = dix["targs"][0]
cidx = dix["cidx"]
start = dix["start"]
black = dix["black"]

srr = mss.SignalReturnRelations(
    dfx,
    rets=ret,
    cids=cidx,
    sigs=sigs,
    # cosp=True,
    freqs="M",
    agg_sigs=["mean"],  # for stability
    start=start,
)

dix["srr"] = srr
dix = dict_cds
srr = dix["srr"]

tbl=srr.multiple_relations_table(signal_name_dict=dict_labels).round(3)
display(tbl.transpose())
| Return | Vol-targeted foreign-currency sovereign bond index return, % | |||||||
|---|---|---|---|---|---|---|---|---|
| Signal | Composite market risk score | Government finance conceptual macro risk premium score | External balances conceptual macro risk premium score | International position conceptual macro risk premium score | Foreign-currency debt conceptual macro risk premium score | Governance conceptual macro risk premium score | Growth risk conceptual macro risk premium score | Inflation risk conceptual macro risk premium score |
| Frequency | M | M | M | M | M | M | M | M |
| Aggregation | mean | mean | mean | mean | mean | mean | mean | mean |
| accuracy | 0.499 | 0.477 | 0.480 | 0.512 | 0.439 | 0.469 | 0.480 | 0.509 |
| bal_accuracy | 0.508 | 0.502 | 0.509 | 0.519 | 0.499 | 0.491 | 0.504 | 0.513 |
| pos_sigr | 0.460 | 0.392 | 0.381 | 0.469 | 0.245 | 0.404 | 0.400 | 0.482 |
| pos_retr | 0.618 | 0.618 | 0.618 | 0.615 | 0.619 | 0.618 | 0.618 | 0.619 |
| pos_prec | 0.627 | 0.620 | 0.629 | 0.635 | 0.617 | 0.607 | 0.623 | 0.633 |
| neg_prec | 0.390 | 0.384 | 0.388 | 0.403 | 0.381 | 0.375 | 0.385 | 0.394 |
| pearson | 0.020 | 0.021 | 0.008 | 0.032 | 0.017 | 0.019 | 0.009 | 0.052 |
| pearson_pval | 0.120 | 0.100 | 0.552 | 0.030 | 0.191 | 0.149 | 0.479 | 0.000 |
| kendall | 0.024 | 0.023 | 0.020 | 0.028 | 0.018 | 0.011 | 0.010 | 0.030 |
| kendall_pval | 0.006 | 0.007 | 0.021 | 0.004 | 0.038 | 0.220 | 0.269 | 0.001 |
| auc | 0.509 | 0.502 | 0.509 | 0.520 | 0.499 | 0.491 | 0.504 | 0.514 |
dix = dict_cds
srr = dix["srr"]
sig = dix['sigs'][0]
srr.accuracy_bars(type='cross_section', sigs=sig, size=(16, 4))
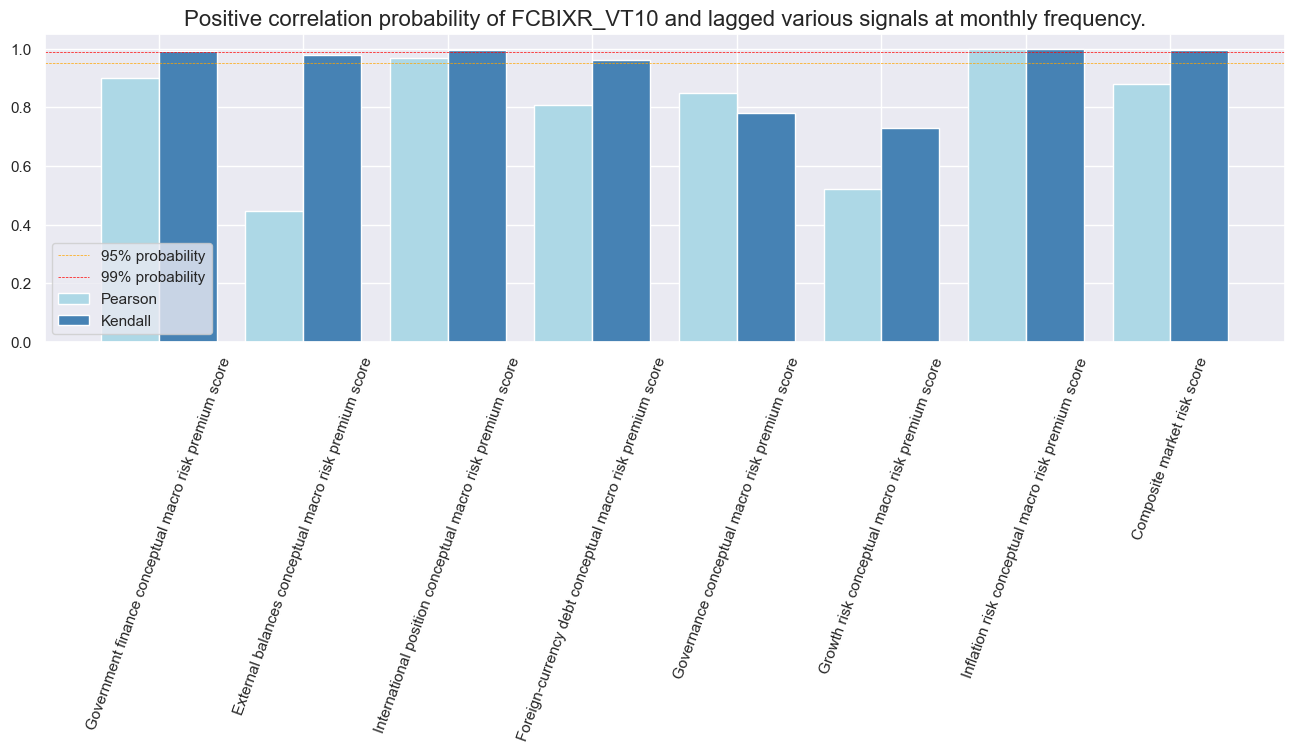
srr.accuracy_bars(type='signals', size=(16, 4), x_labels=dict_labels, x_labels_rotate= 60)
dix = dict_cds
srr = dix["srr"]

sig = dix['sigs'][0]
srr.correlation_bars(type='cross_section', sigs=sig, size=(16, 4))
srr.correlation_bars(type='signals', size=(16, 4), x_labels=dict_labels,x_labels_rotate=70 )
Naive PnLs #
dix = dict_cds

sigs = dix['sigs']
ret = dix["targs"][0]
cidx = dix["cidx"]
start = dix["start"]
black = dix["black"]

rt = ret.split('_')[-1]  # 'NSA' or 'VT10'

pnls = msn.NaivePnL(
    df=dfx,
    ret=ret,
    sigs=sigs,
    cids=cidx,
    start=start,
    blacklist=black,
    bms=bms,
)
for sig in sigs:
    for bias in [0, 1]:
        pnls.make_pnl(
            sig=sig,
            sig_op="zn_score_pan",
            thresh=2,
            sig_add = bias,
            rebal_freq="monthly",
            neutral="zero",
            pnl_name=sig + "_PNL" + rt + str(bias),
            rebal_slip=1,
            vol_scale=10,
    )
pnls.make_long_pnl(vol_scale=10, label="Long only")

dix["pnls_"+rt.lower()] = pnls
dix = dict_cds
rt = "VT10"
bias = 1
pnls = dix["pnls_"+rt.lower()]

sigs = dix["sigs"]
strats = [sig + "_PNL" + rt + str(bias) for sig in sigs]

pnl_labels = {
    'GFINRISK_RPS_ZN_PNLVT101': "Government finance conceptual macro risk premium score",
    'XBALRISK_RPS_ZN_PNLVT101': "External balances conceptual macro risk premium score",
    'XLIABRISK_RPS_ZN_PNLVT101': "International position conceptual macro risk premium score",
    'XDEBTRISK_RPS_ZN_PNLVT101': "Foreign-currency debt conceptual macro risk premium score",
    'GOVRISK_RPS_ZN_PNLVT101': "Governance conceptual macro risk premium score",
    'GROWTHRISK_RPS_ZN_PNLVT101': "Growth risk conceptual macro risk premium score",
    'INFLRISK_RPS_ZN_PNLVT101': "Inflation risk conceptual macro risk premium score",
    'MARKETRISK_ZN_PNLVT101': "Market risk score",
    'Long only': 'Long only'
}

pnls.plot_pnls(
    title=None,
    pnl_cats=strats + ["Long only"],
    xcat_labels=pnl_labels,
    title_fontsize=14,
)
display(pnls.evaluate_pnls(pnl_cats=strats + ["Long only"], label_dict=pnl_labels).round(3))
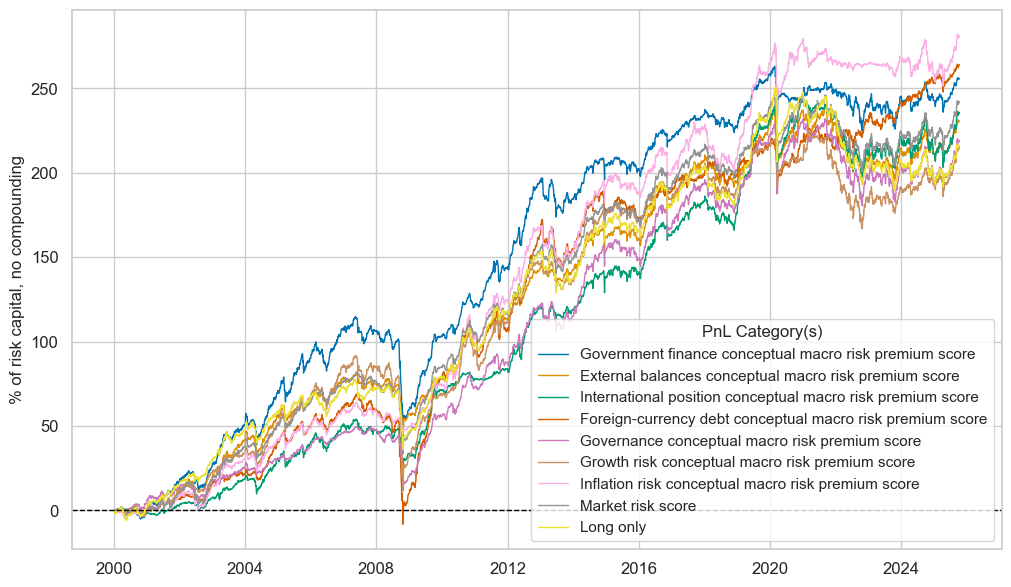
| xcat | Government finance conceptual macro risk premium score | External balances conceptual macro risk premium score | International position conceptual macro risk premium score | Foreign-currency debt conceptual macro risk premium score | Governance conceptual macro risk premium score | Growth risk conceptual macro risk premium score | Inflation risk conceptual macro risk premium score | Market risk score | Long only |
|---|---|---|---|---|---|---|---|---|---|
| Return % | 9.929059 | 8.951204 | 9.140968 | 10.242257 | 8.49312 | 8.339227 | 10.903117 | 9.384737 | 8.383397 |
| St. Dev. % | 10.0 | 10.0 | 10.0 | 10.0 | 10.0 | 10.0 | 10.0 | 10.0 | 10.0 |
| Sharpe Ratio | 0.992906 | 0.89512 | 0.914097 | 1.024226 | 0.849312 | 0.833923 | 1.090312 | 0.938474 | 0.83834 |
| Sortino Ratio | 1.34647 | 1.21005 | 1.27657 | 1.381157 | 1.149815 | 1.105958 | 1.467989 | 1.263331 | 1.111366 |
| Max 21-Day Draw % | -40.605329 | -42.675469 | -42.480516 | -45.156854 | -41.711754 | -47.790588 | -46.38385 | -41.336808 | -42.62663 |
| Max 6-Month Draw % | -61.967732 | -33.16776 | -30.587129 | -63.82036 | -33.200363 | -73.957651 | -29.500378 | -41.268487 | -37.303719 |
| Peak to Trough Draw % | -70.769889 | -45.823099 | -49.814614 | -77.245021 | -51.293927 | -79.820654 | -47.798014 | -48.568348 | -61.090769 |
| Top 5% Monthly PnL Share | 0.519017 | 0.523186 | 0.621111 | 0.547607 | 0.645092 | 0.59604 | 0.551331 | 0.551428 | 0.638043 |
| USD_EQXR_NSA correl | 0.269451 | 0.282644 | 0.26938 | 0.236014 | 0.239701 | 0.212726 | 0.217736 | 0.293867 | 0.214447 |
| UHY_CRXR_NSA correl | 0.330119 | 0.340167 | 0.316901 | 0.286146 | 0.291566 | 0.25569 | 0.290602 | 0.350609 | 0.272986 |
| UIG_CRXR_NSA correl | 0.330768 | 0.31865 | 0.296862 | 0.307085 | 0.256351 | 0.255951 | 0.261547 | 0.331488 | 0.252681 |
| Traded Months | 310 | 310 | 310 | 310 | 310 | 310 | 310 | 310 | 310 |
Composite relative signals #
Specs and panel test #
dict_rel = {
    "sigs": ['MACROSPREAD_RPS_ZNvEM','MACRORATING_RPS_ZNvEM', 'MACROALL_RPS_ZNvEM', 'MARKETRISK_ZNvEM'],
    "targs": ["FCBIXR_VT10vEM", "FCBIXR_NSAvEM"],
    "cidx": cids_fc,
    "start": "2000-01-01",
    "black": black_fc,
}
dix = dict_rel

sigs = dix['sigs']
ret = dix["targs"][0]
cidx = dix["cidx"]
start = dix["start"]
black = dix["black"]

catregs = {}
for sig in sigs:
    catregs[sig] = msp.CategoryRelations(
        dfx,
        xcats=[sig, ret],
        cids=cidx,
        freq="Q",
        lag=1,
        xcat_aggs=["mean", "sum"],
        start=start,
        blacklist=black,
    )

msv.multiple_reg_scatter(
    cat_rels=[v for k, v in catregs.items()],
    ncol=2,
    nrow=2,
    figsize=(14, 12),
    title="Relative risk scores and subsequent relative excess returns, 24 EM sovereigns since 2000",
    title_fontsize=20,
    xlab="End-of-quarter score",
    ylab="Foreign currency bond index relative excess returns, vol targeted, %, next quarter",
    coef_box="lower right",
    prob_est="map",
    single_chart=True,
    subplot_titles=[dict_labels[key] for key in sigs]
)
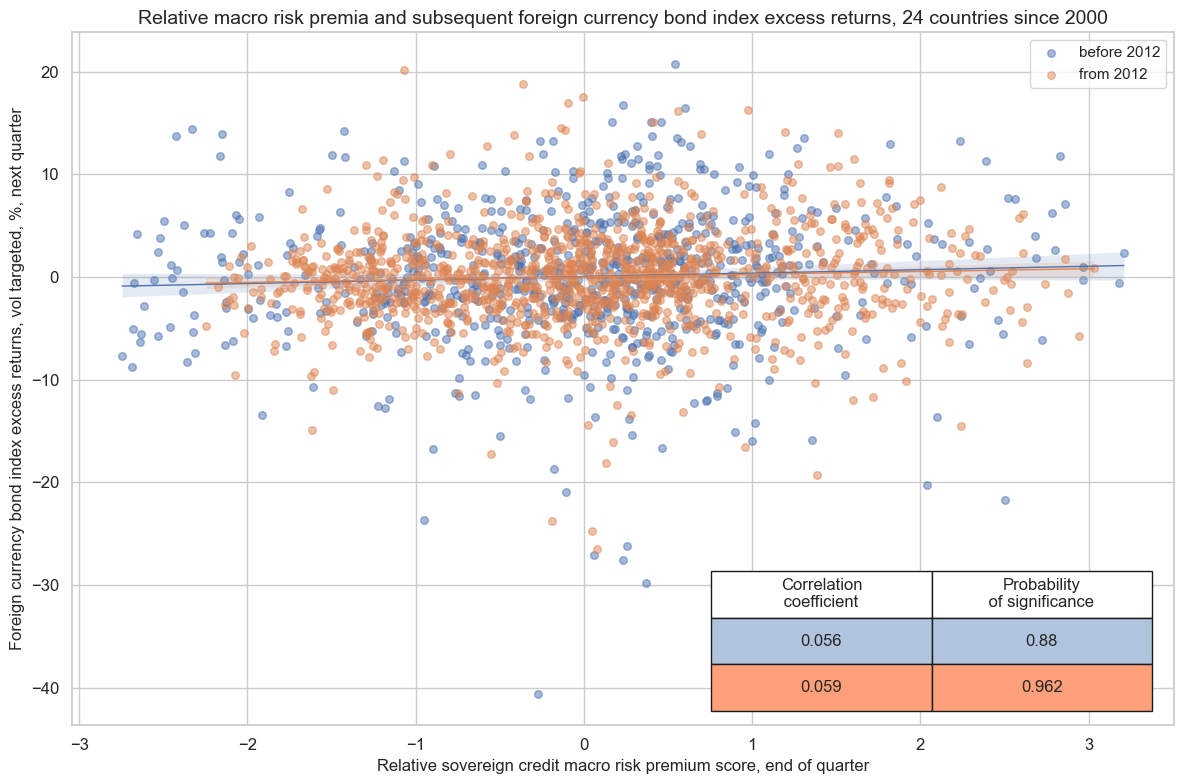
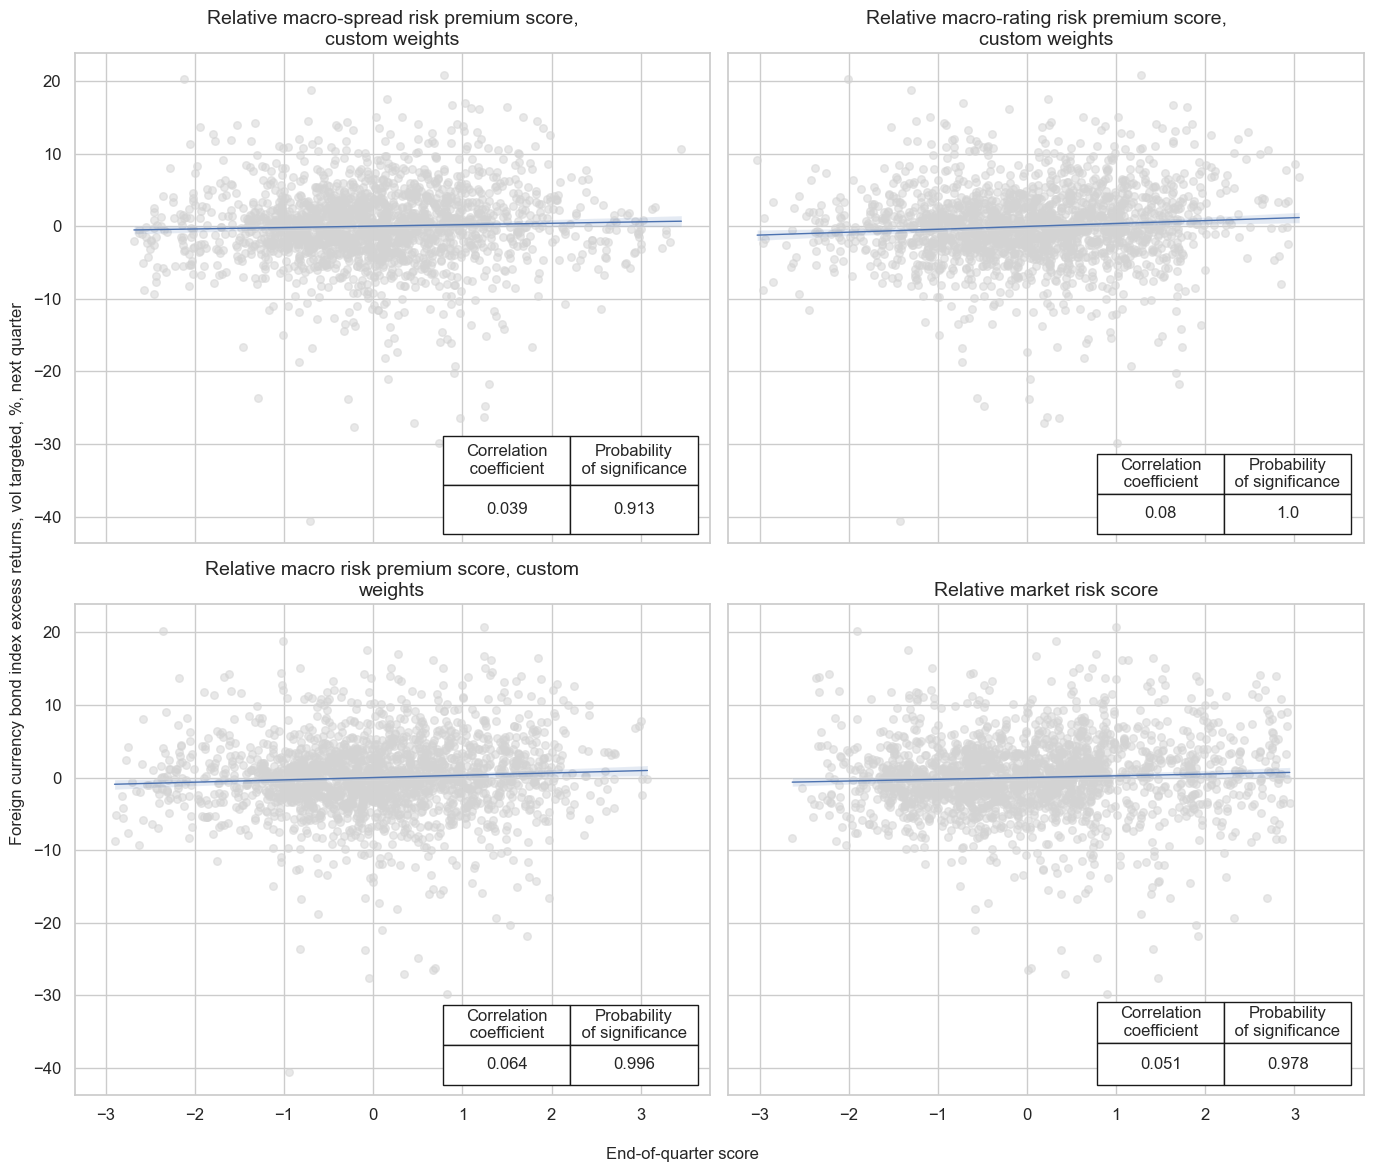
dix = dict_rel

sig = dix["sigs"][2]
ret = dix["targs"][0]
cidx = dix["cidx"]
start = dix["start"]
black = dix["black"]

cr = msp.CategoryRelations(
    dfx,
    xcats=[sig, ret],
    cids=cidx,
    freq="Q",
    years=None,
    lag=1,
    xcat_aggs=["mean", "sum"],  # period mean adds stability
    start=start,
    blacklist=black,
)

cr.reg_scatter(
    title="Relative macro risk premia and subsequent foreign currency bond index excess returns, 24 countries since 2000",
    labels=False,
    xlab="Relative sovereign credit macro risk premium score, end of quarter",
    ylab="Foreign currency bond index excess returns, vol targeted, %, next quarter",
    coef_box="lower right",
    prob_est="map",
    separator=2012,
    size=(12, 8),
)

cr.reg_scatter(
    title="Relative macro risk premia and subsequent foreign currency bond index excess returns, 24 countries since 2000",
    labels=False,
    xlab="Relative macro risk premium",
    ylab="Returns",
    coef_box="lower right",
    prob_est="pool",
    separator="cids",
)
Accuracy and correlation check #
dix = dict_rel

sigs = dix['sigs']
ret = dix["targs"][0]
cidx = dix["cidx"]
start = dix["start"]
black = dix["black"]

srr = mss.SignalReturnRelations(
    dfx,
    rets=ret,
    cids=cidx,
    sigs=sigs,
    # cosp=True,
    freqs="M",
    agg_sigs=["mean"],  # for stability
    start=start,
)

dix["srr"] = srr
dix = dict_rel
srr = dix["srr"]

tbl=srr.multiple_relations_table(signal_name_dict=dict_labels, return_name_dict={'FCBIXR_VT10vEM': 'Relative foreign currency bond index returns, volatility adjusted'}).round(3)
display(tbl.transpose())
| Return | Relative foreign currency bond index returns, volatility adjusted | |||
|---|---|---|---|---|
| Signal | Relative macro-spread risk premium score | Relative macro-rating risk premium score | Relative macro risk premium score | Relative market risk score |
| Frequency | M | M | M | M |
| Aggregation | mean | mean | mean | mean |
| accuracy | 0.522 | 0.524 | 0.524 | 0.531 |
| bal_accuracy | 0.522 | 0.524 | 0.524 | 0.531 |
| pos_sigr | 0.495 | 0.496 | 0.519 | 0.491 |
| pos_retr | 0.501 | 0.499 | 0.500 | 0.500 |
| pos_prec | 0.523 | 0.523 | 0.523 | 0.532 |
| neg_prec | 0.521 | 0.525 | 0.525 | 0.531 |
| pearson | 0.013 | 0.046 | 0.030 | 0.028 |
| pearson_pval | 0.325 | 0.000 | 0.019 | 0.033 |
| kendall | 0.024 | 0.038 | 0.034 | 0.040 |
| kendall_pval | 0.006 | 0.000 | 0.000 | 0.000 |
| auc | 0.522 | 0.524 | 0.524 | 0.531 |
dix = dict_rel
srr = dix["srr"]
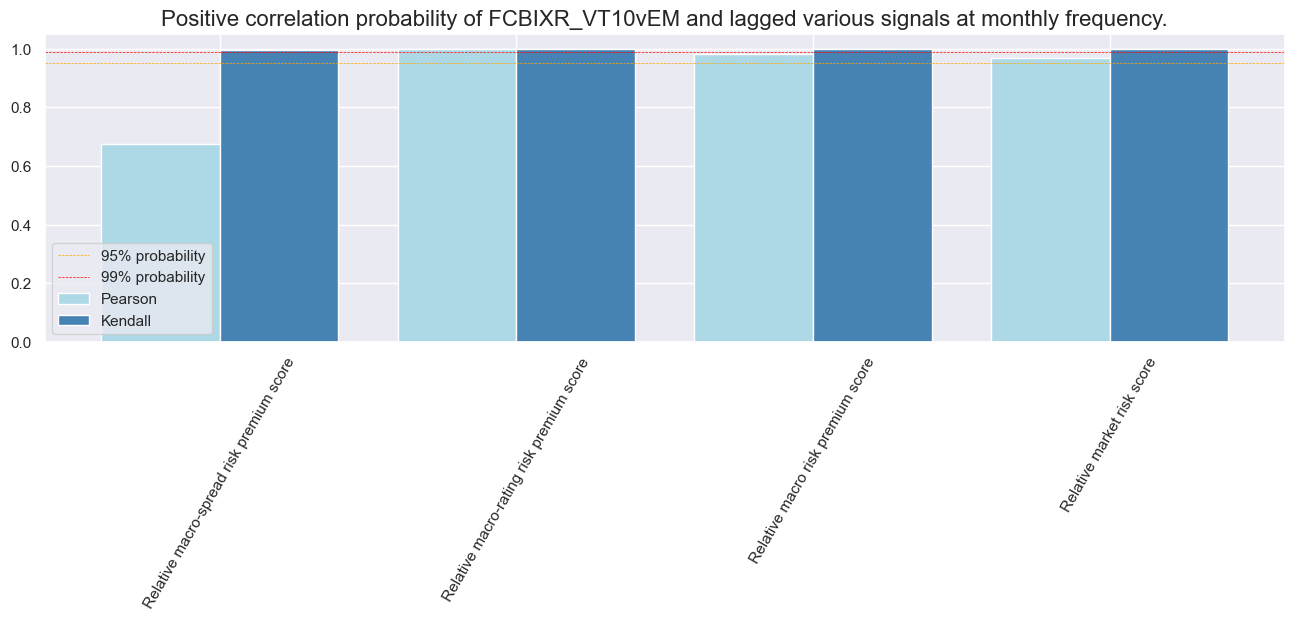
srr.accuracy_bars(type='cross_section', sigs="MACROALL_RPS_ZNvEM", size=(16, 4))
srr.accuracy_bars(type='signals', size=(16, 4), x_labels=dict_labels, x_labels_rotate= 60)
dix = dict_rel
srr = dix["srr"]

srr.correlation_bars(type='cross_section', sigs="MACROALL_RPS_ZNvEM", size=(16, 4))
srr.correlation_bars(type='signals', size=(16, 4),x_labels=dict_labels, x_labels_rotate= 60)
Naive PnLs #
dix = dict_rel

sigs = dix["sigs"]
ret = dix["targs"][0]
cidx = dix["cidx"]
start = dix["start"]
black = dix["black"]

pnls = msn.NaivePnL(
    df=dfx,
    ret=ret,
    sigs=sigs,
    cids=cidx,
    start=start,
    blacklist=black,
    bms=bms,
)
for sig in sigs:
    pnls.make_pnl(
        sig=sig,
        sig_op="zn_score_pan",
        thresh=2,
        sig_add=0,
        rebal_freq="monthly",
        neutral="zero",
        pnl_name=sig + "_PNL",
        rebal_slip=1,
        vol_scale=10,
    )

dix["pnls"] = pnls
dix = dict_rel
bias = 0
pnls = dix["pnls"]
sigs = dix["sigs"]
sigs = ["MACROSPREAD_RPS_ZNvEM", "MACRORATING_RPS_ZNvEM", "MACROALL_RPS_ZNvEM"]
strats = [sig + "_PNL" for sig in sigs]
pnl_labels = {
"MACROSPREAD_RPS_ZNvEM_PNL": "Spread-based relative macro risk premium score",
"MACRORATING_RPS_ZNvEM_PNL": "Ratings-based relative macro risk premium score",
"MACROALL_RPS_ZNvEM_PNL": "Composite relative macro risk premium score",
}
pnls.plot_pnls(
title="Naive PnL for relative risk-premia strategies, 24 EM sovereigns, 7-factor macro risk",
pnl_cats=strats,
xcat_labels=pnl_labels,
title_fontsize=14,
)
display(pnls.evaluate_pnls(pnl_cats=strats).round(3))
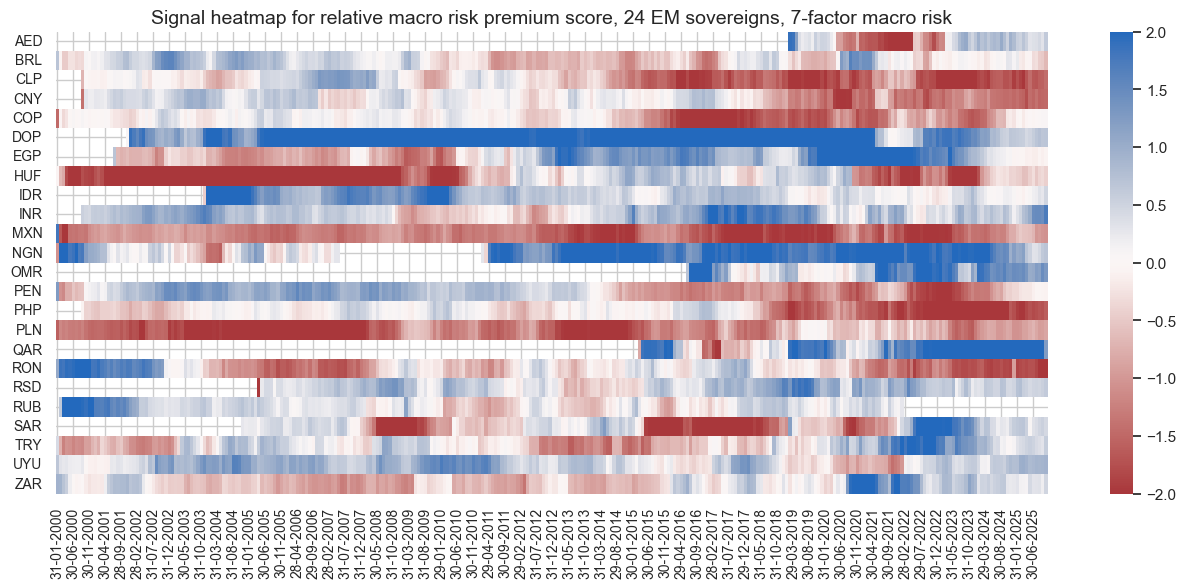
pnls.signal_heatmap(
pnl_name=f"MACROALL_RPS_ZNvEM_PNL",
figsize=(16, 6),
title="Signal heatmap for relative macro risk premium score, 24 EM sovereigns, 7-factor macro risk",
tick_fontsize=10,
)
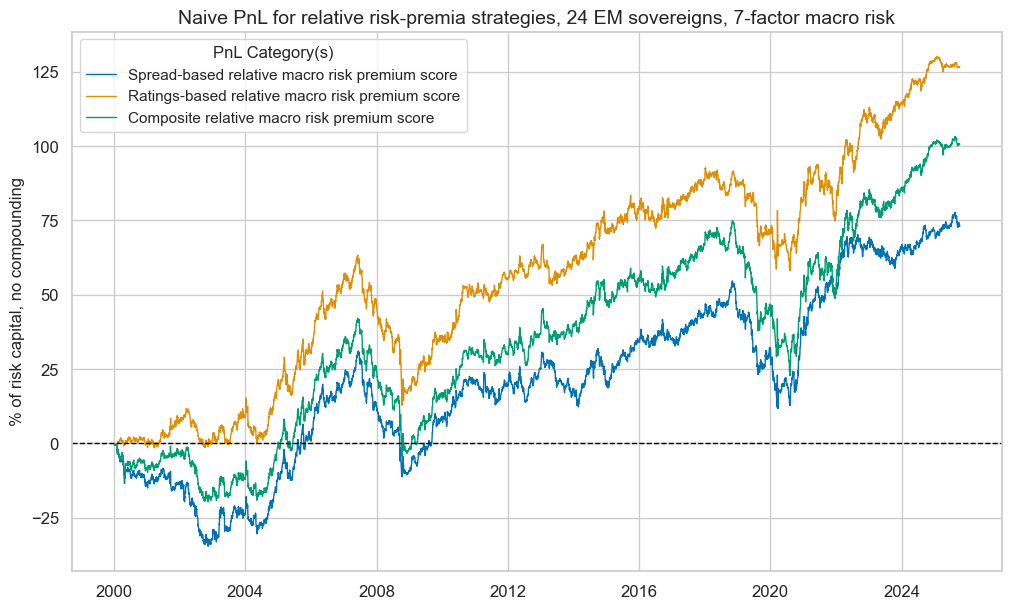
| xcat | MACROSPREAD_RPS_ZNvEM_PNL | MACRORATING_RPS_ZNvEM_PNL | MACROALL_RPS_ZNvEM_PNL |
|---|---|---|---|
| Return % | 2.85097 | 4.924128 | 3.911683 |
| St. Dev. % | 10.0 | 10.0 | 10.0 |
| Sharpe Ratio | 0.285097 | 0.492413 | 0.391168 |
| Sortino Ratio | 0.40235 | 0.700547 | 0.558566 |
| Max 21-Day Draw % | -14.175922 | -21.497406 | -17.49862 |
| Max 6-Month Draw % | -20.068812 | -29.107512 | -26.46807 |
| Peak to Trough Draw % | -42.919465 | -50.510186 | -52.197174 |
| Top 5% Monthly PnL Share | 1.41464 | 0.864924 | 1.115109 |
| USD_EQXR_NSA correl | 0.01609 | 0.092667 | 0.092628 |
| UHY_CRXR_NSA correl | 0.013723 | 0.089713 | 0.092908 |
| UIG_CRXR_NSA correl | -0.008139 | 0.091003 | 0.085331 |
| Traded Months | 310 | 310 | 310 |
Conceptual relative signals #
Specs and panel test #
dict_crs = {
    "sigs": crpzr + ["MARKETRISK_ZNvEM"],
    "targs": ["FCBIXR_VT10vEM", "FCBIXR_NSAvEM"],
    "cidx": cids_fc,
    "start": "2000-01-01",
    "black": black_fc,
}
dix = dict_crs
sigs = dix['sigs']
ret = dix["targs"][0]
cidx = dix["cidx"]
start = dix["start"]
black = dix["black"]
catregs = {}
for sig in sigs:
catregs[sig] = msp.CategoryRelations(
dfx,
xcats=[sig, ret],
cids=cidx,
freq="Q",
lag=1,
xcat_aggs=["mean", "sum"],
start=start,
blacklist=black,
)
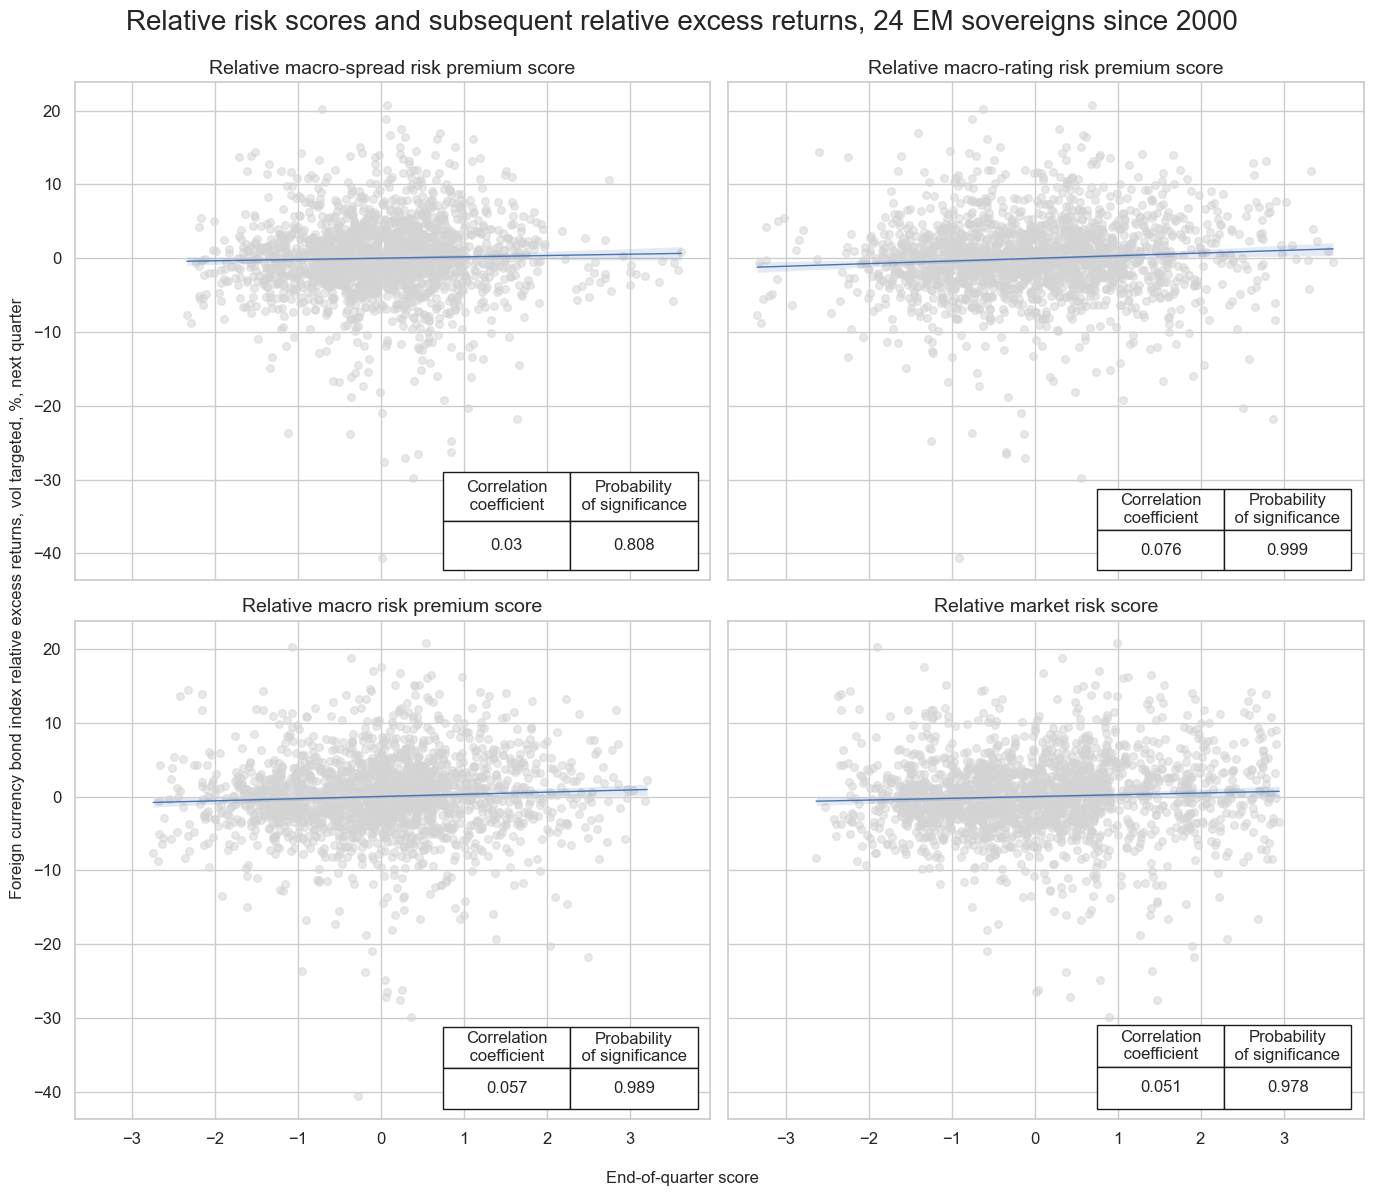
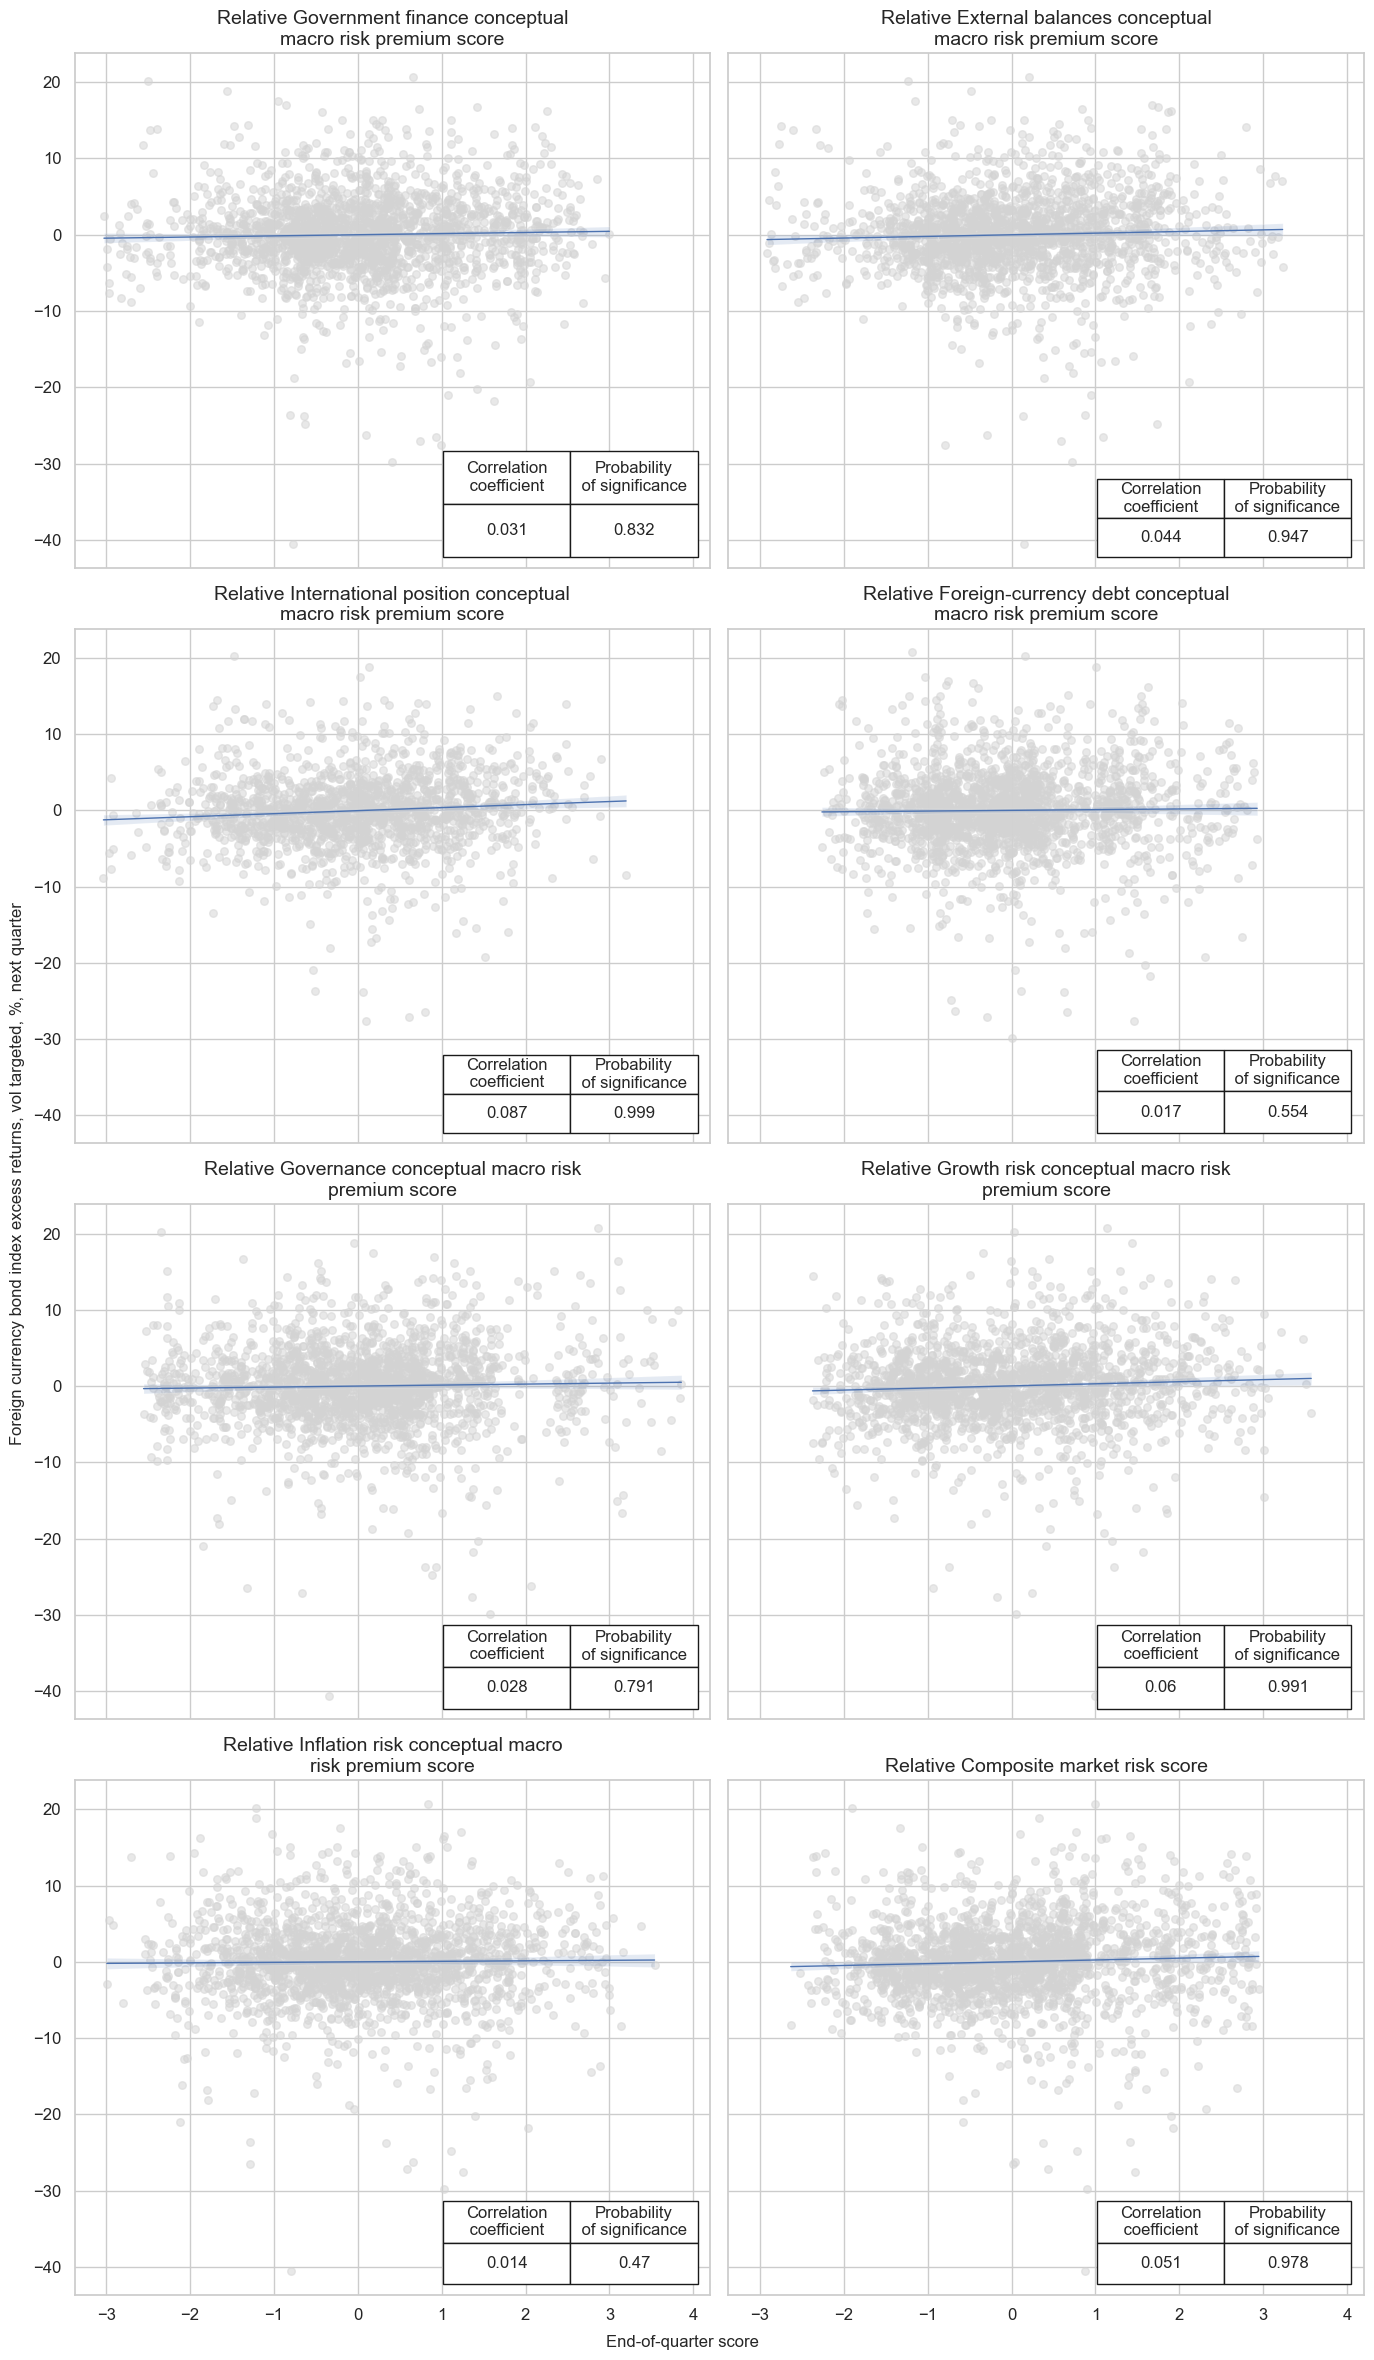
msv.multiple_reg_scatter(
cat_rels=[v for k, v in catregs.items()],
ncol=2,
nrow=4,
figsize=(14, 24),
title=None,
title_fontsize=20,
xlab="End-of-quarter score",
ylab="Foreign currency bond index excess returns, vol targeted, %, next quarter",
coef_box="lower right",
prob_est="map",
single_chart=True,
subplot_titles=['Relative ' + dict_labels[key[:-3]] for key in sigs]
)
XBALRISK_RPS_ZNvEM misses: ['AED'].
XLIABRISK_RPS_ZNvEM misses: ['AED', 'OMR', 'QAR', 'SAR'].
XDEBTRISK_RPS_ZNvEM misses: ['QAR'].
Accuracy and correlation check #
dix = dict_crs

sigs = dix['sigs']
ret = dix["targs"][0]
cidx = dix["cidx"]
start = dix["start"]
black = dix["black"]

srr = mss.SignalReturnRelations(
    dfx,
    rets=ret,
    cids=cidx,
    sigs=sigs,
    # cosp=True,
    freqs="M",
    agg_sigs=["mean"],  # for stability
    start=start,
)

dix["srr"] = srr
dix = dict_crs
srr = dix["srr"]
tbl=srr.multiple_relations_table(signal_name_dict=dict_labels,return_name_dict={'FCBIXR_VT10vEM': 'Relative foreign currency bond index returns, volatility adjusted'}).round(3)
display(tbl.transpose())
| Return | Relative foreign currency bond index returns, volatility adjusted | |||||||
|---|---|---|---|---|---|---|---|---|
| Signal | Relative market risk score | Relative government finance conceptual macro risk premium score | Relative governance conceptual macro risk premium score | Relative growth risk conceptual macro risk premium score | Relative inflation risk conceptual macro risk premium score | Relative external balances conceptual macro risk premium score | Relative foreign-currency debt conceptual macro risk premium score | Relative international position conceptual macro risk premium score |
| Frequency | M | M | M | M | M | M | M | M |
| Aggregation | mean | mean | mean | mean | mean | mean | mean | mean |
| accuracy | 0.531 | 0.517 | 0.514 | 0.523 | 0.511 | 0.526 | 0.516 | 0.538 |
| bal_accuracy | 0.531 | 0.517 | 0.514 | 0.523 | 0.511 | 0.526 | 0.516 | 0.538 |
| pos_sigr | 0.491 | 0.499 | 0.526 | 0.464 | 0.499 | 0.478 | 0.443 | 0.503 |
| pos_retr | 0.500 | 0.500 | 0.500 | 0.499 | 0.500 | 0.500 | 0.500 | 0.499 |
| pos_prec | 0.532 | 0.516 | 0.513 | 0.524 | 0.511 | 0.527 | 0.518 | 0.536 |
| neg_prec | 0.531 | 0.517 | 0.515 | 0.522 | 0.511 | 0.525 | 0.514 | 0.539 |
| pearson | 0.028 | 0.018 | 0.015 | 0.031 | 0.006 | 0.024 | 0.010 | 0.048 |
| pearson_pval | 0.033 | 0.162 | 0.263 | 0.020 | 0.656 | 0.067 | 0.459 | 0.001 |
| kendall | 0.040 | 0.021 | 0.015 | 0.031 | 0.010 | 0.038 | 0.021 | 0.052 |
| kendall_pval | 0.000 | 0.016 | 0.087 | 0.001 | 0.266 | 0.000 | 0.019 | 0.000 |
| auc | 0.531 | 0.517 | 0.514 | 0.523 | 0.511 | 0.526 | 0.516 | 0.538 |
Naive PnLs #
dix = dict_crs

sigs = dix["sigs"]
ret = dix["targs"][0]
cidx = dix["cidx"]
start = dix["start"]
black = dix["black"]

pnls = msn.NaivePnL(
    df=dfx,
    ret=ret,
    sigs=sigs,
    cids=cidx,
    start=start,
    blacklist=black,
    bms=bms,
)
for sig in sigs:
    pnls.make_pnl(
        sig=sig,
        sig_op="zn_score_pan",
        thresh=2,
        sig_add=0,
        rebal_freq="monthly",
        neutral="zero",
        pnl_name=sig + "_PNL",
        rebal_slip=1,
        vol_scale=10,
    )

dix["pnls"] = pnls
dix = dict_crs
bias = 0
pnls = dix["pnls"]

sigs = dix["sigs"]
strats = [sig + "_PNL" for sig in sigs]

pnl_labels = {}

for sig in sigs:
    pnl_labels[sig+'_PNL'] = dict_labels[sig]


pnls.plot_pnls(
    title=None,
    pnl_cats=strats,
    xcat_labels=pnl_labels,
    title_fontsize=14,
)
display(pnls.evaluate_pnls(pnl_cats=strats, label_dict=pnl_labels).round(3))
| xcat | Relative government finance conceptual macro risk premium score | Relative external balances conceptual macro risk premium score | Relative international position conceptual macro risk premium score | Relative foreign-currency debt conceptual macro risk premium score | Relative governance conceptual macro risk premium score | Relative growth risk conceptual macro risk premium score | Relative inflation risk conceptual macro risk premium score | Relative market risk score |
|---|---|---|---|---|---|---|---|---|
| Return % | 2.106655 | 3.160868 | 3.882276 | 1.119823 | 1.845979 | 3.600833 | 0.191546 | 2.710152 |
| St. Dev. % | 10.0 | 10.0 | 10.0 | 10.0 | 10.0 | 10.0 | 10.0 | 10.0 |
| Sharpe Ratio | 0.210665 | 0.316087 | 0.388228 | 0.111982 | 0.184598 | 0.360083 | 0.019155 | 0.271015 |
| Sortino Ratio | 0.294044 | 0.437454 | 0.546861 | 0.156018 | 0.254129 | 0.51125 | 0.026118 | 0.372464 |
| Max 21-Day Draw % | -19.353328 | -28.310894 | -19.565234 | -14.332308 | -20.370113 | -15.093317 | -29.022986 | -26.110161 |
| Max 6-Month Draw % | -28.78673 | -34.452508 | -40.396441 | -26.722603 | -30.934568 | -26.488762 | -33.644246 | -35.981852 |
| Peak to Trough Draw % | -51.969973 | -61.97568 | -67.76123 | -91.263668 | -58.099982 | -58.759869 | -55.034756 | -70.526359 |
| Top 5% Monthly PnL Share | 1.805904 | 1.263641 | 1.064154 | 4.855727 | 2.316327 | 1.351537 | 21.752808 | 1.675891 |
| USD_EQXR_NSA correl | 0.197769 | 0.221707 | 0.187073 | 0.0858 | 0.107756 | 0.053456 | 0.182138 | 0.253044 |
| UHY_CRXR_NSA correl | 0.221728 | 0.234707 | 0.186206 | 0.072473 | 0.108713 | 0.031207 | 0.203561 | 0.262543 |
| UIG_CRXR_NSA correl | 0.231347 | 0.229641 | 0.185297 | 0.087198 | 0.049224 | 0.018265 | 0.208044 | 0.24806 |
| Traded Months | 310 | 310 | 310 | 310 | 310 | 310 | 310 | 310 |
Customized directional signals #
Specs and panel test #
dict_dirc = {
    "sigs": ['MACROSPREAD_RPS_CWS_ZN','MACRORATING_RPS_CWS_ZN', 'MACROALL_RPS_CWS_ZN', 'MARKETRISK_ZN'],
    "targs": ["FCBIXR_VT10", "FCBIXR_NSA"],
    "cidx": cids_fc,
    "start": "2000-01-01",
    "black": black_fc,
}
dix = dict_dirc

sigs = dix['sigs']
ret = dix["targs"][0]
cidx = dix["cidx"]
start = dix["start"]
black = dix["black"]

catregs = {}
for sig in sigs:
    catregs[sig] = msp.CategoryRelations(
        dfx,
        xcats=[sig, ret],
        cids=cidx,
        freq="Q",
        lag=1,
        xcat_aggs=["last", "sum"],
        start=start,
        blacklist=black,
    )

msv.multiple_reg_scatter(
    cat_rels=[v for k, v in catregs.items()],
    ncol=2,
    nrow=2,
    figsize=(14, 12),
    title=None,
    title_fontsize=20,
    xlab="End-of-quarter score",
    ylab="Foreign currency bond index excess returns, vol targeted, %, next quarter",
    coef_box="lower right",
    prob_est="map",
    single_chart=True,
    subplot_titles=[dict_labels[key] for key in sigs]
)
Accuracy and correlation check #
dix = dict_dirc

sigs = dix['sigs']
ret = dix["targs"][0]
cidx = dix["cidx"]
start = dix["start"]
black = dix["black"]

srr = mss.SignalReturnRelations(
    dfx,
    rets=ret,
    cids=cidx,
    sigs=sigs,
    # cosp=True,
    freqs="M",
    agg_sigs=["last"],  # for stability
    start=start,
)

dix["srr"] = srr
dix = dict_dirc
srr = dix["srr"]

tbl=srr.multiple_relations_table(signal_name_dict=dict_labels,return_name_dict={'FCBIXR_VT10vEM': 'Relative foreign currency bond index returns, volatility adjusted'}).round(3)
display(tbl.transpose())
| Return | Vol-targeted foreign-currency sovereign bond index return, % | |||
|---|---|---|---|---|
| Signal | Composite market risk score | Spread-based macro risk premium score, custom weights | Ratings-based macro risk premium score, custom weights | Macro risk premium score, custom weights |
| Frequency | M | M | M | M |
| Aggregation | last | last | last | last |
| accuracy | 0.499 | 0.470 | 0.496 | 0.482 |
| bal_accuracy | 0.508 | 0.512 | 0.512 | 0.511 |
| pos_sigr | 0.463 | 0.329 | 0.433 | 0.379 |
| pos_retr | 0.618 | 0.617 | 0.616 | 0.618 |
| pos_prec | 0.627 | 0.633 | 0.630 | 0.631 |
| neg_prec | 0.390 | 0.391 | 0.394 | 0.390 |
| pearson | 0.018 | 0.026 | 0.021 | 0.028 |
| pearson_pval | 0.169 | 0.049 | 0.110 | 0.030 |
| kendall | 0.023 | 0.038 | 0.020 | 0.032 |
| kendall_pval | 0.007 | 0.000 | 0.023 | 0.000 |
| auc | 0.509 | 0.511 | 0.512 | 0.511 |
Naive PnLs #
dix = dict_dirc

sigs = dix['sigs']
ret = dix["targs"][0]
cidx = dix["cidx"]
start = dix["start"]
black = dix["black"]

rt = ret.split('_')[-1]  # 'NSA' or 'VT10'

pnls = msn.NaivePnL(
    df=dfx,
    ret=ret,
    sigs=sigs,
    cids=cidx,
    start=start,
    blacklist=black,
    bms=bms,
)
for sig in sigs:
    for bias in [0, 1]:
        pnls.make_pnl(
            sig=sig,
            sig_op="zn_score_pan",
            thresh=2,
            sig_add = bias,
            rebal_freq="monthly",
            neutral="zero",
            pnl_name=sig + "_PNL" + rt + str(bias),
            rebal_slip=1,
            vol_scale=10,
    )
pnls.make_long_pnl(vol_scale=10, label="Long only")

dix["pnls_"+rt.lower()] = pnls
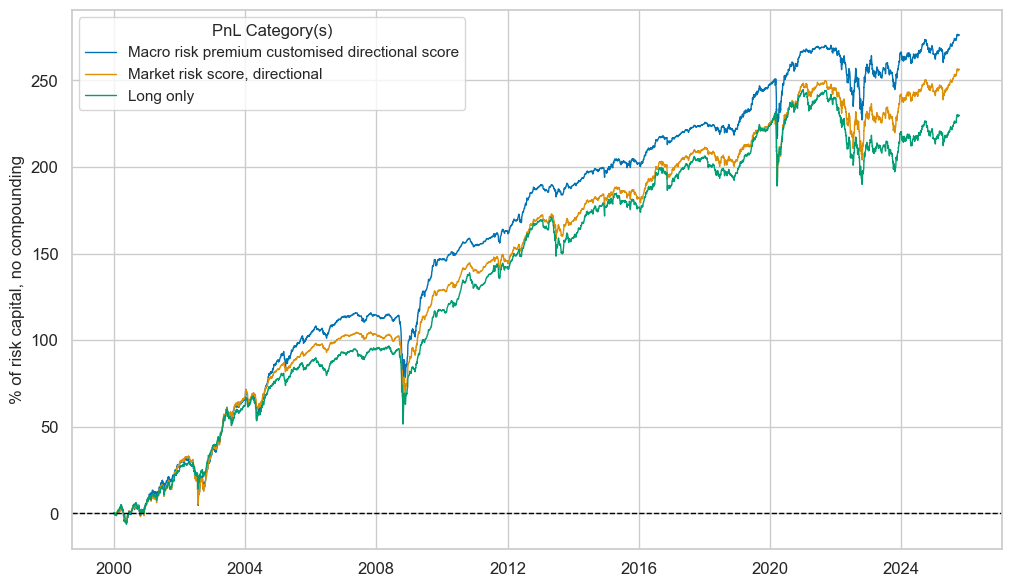
dix = dict_dirc
rt = "VT10"
bias = 1
pnls = dix["pnls_"+rt.lower()]

sigs = ["MACROALL_RPS_CWS_ZN", "MARKETRISK_ZN"]
strats = [sig + "_PNL" + rt + str(bias) for sig in sigs]

pnl_labels = {
    'MACROALL_RPS_CWS_ZN_PNLVT101': 'Macro risk premium customised directional score, vol targeted returns',
    'MARKETRISK_ZN_PNLVT101': 'Market risk score, directional, vol targeted returns',
    'Long only': 'Long only'
}

pnls.plot_pnls(
    title=None,
    pnl_cats=strats + ["Long only"],
    xcat_labels=pnl_labels,
    title_fontsize=14,
)
display(pnls.evaluate_pnls(pnl_cats=strats + ["Long only"], label_dict=pnl_labels).round(3))
pnls.signal_heatmap(pnl_name=f"MACROALL_RPS_CWS_ZN_PNL" + rt + str(bias), figsize=(20, 10))
| xcat | Macro risk premium customised directional score, vol targeted returns | Market risk score, directional, vol targeted returns | Long only |
|---|---|---|---|
| Return % | 10.807954 | 9.384737 | 8.383397 |
| St. Dev. % | 10.0 | 10.0 | 10.0 |
| Sharpe Ratio | 1.080795 | 0.938474 | 0.83834 |
| Sortino Ratio | 1.485976 | 1.263331 | 1.111366 |
| Max 21-Day Draw % | -37.929869 | -41.336808 | -42.62663 |
| Max 6-Month Draw % | -45.54727 | -41.268487 | -37.303719 |
| Peak to Trough Draw % | -54.280597 | -48.568348 | -61.090769 |
| Top 5% Monthly PnL Share | 0.498032 | 0.551428 | 0.638043 |
| USD_EQXR_NSA correl | 0.26957 | 0.293867 | 0.214447 |
| UHY_CRXR_NSA correl | 0.324261 | 0.350609 | 0.272986 |
| UIG_CRXR_NSA correl | 0.300414 | 0.331488 | 0.252681 |
| Traded Months | 310 | 310 | 310 |
dix = dict_dirc

sigs = dix['sigs']
ret = dix["targs"][1]
cidx = dix["cidx"]
start = dix["start"]
black = dix["black"]

rt = ret.split('_')[-1]  # 'NSA' or 'VT10'

pnls = msn.NaivePnL(
    df=dfx,
    ret=ret,
    sigs=sigs,
    cids=cidx,
    start=start,
    blacklist=black,
    bms=bms,
)
for sig in sigs:
    for bias in [0, 1]:
        pnls.make_pnl(
            sig=sig,
            sig_op="zn_score_pan",
            thresh=2,
            sig_add = bias,
            rebal_freq="monthly",
            neutral="zero",
            pnl_name=sig + "_PNL" + rt + str(bias),
            rebal_slip=1,
            vol_scale=10,
    )
pnls.make_long_pnl(vol_scale=10, label="Long only")

dix["pnls_"+rt.lower()] = pnls
dix = dict_dirc
rt = "NSA"
bias = 1
pnls = dix["pnls_"+rt.lower()]

sigs = ["MACROALL_RPS_CWS_ZN", "MARKETRISK_ZN"]
strats = [sig + "_PNL" + rt + str(bias) for sig in sigs]

pnl_labels = {
    'MACROALL_RPS_CWS_ZN_PNLNSA1': 'Macro risk premium customised directional score',
    'MARKETRISK_ZN_PNLNSA1': 'Market risk score, directional',
    'Long only': 'Long only'
}
pnls.plot_pnls(
    title=None,
    pnl_cats=strats + ["Long only"],
    xcat_labels=pnl_labels,
    title_fontsize=14,
)
display(pnls.evaluate_pnls(pnl_cats=strats + ["Long only"], label_dict=pnl_labels).round(3))
pnls.signal_heatmap(pnl_name=f"MACROALL_RPS_CWS_ZN_PNL" + rt + str(bias), figsize=(20, 10))
| xcat | Macro risk premium customised directional score | Market risk score, directional | Long only |
|---|---|---|---|
| Return % | 10.726041 | 9.951539 | 8.919248 |
| St. Dev. % | 10.0 | 10.0 | 10.0 |
| Sharpe Ratio | 1.072604 | 0.995154 | 0.891925 |
| Sortino Ratio | 1.509869 | 1.38463 | 1.20689 |
| Max 21-Day Draw % | -40.635779 | -37.587981 | -41.008912 |
| Max 6-Month Draw % | -46.048023 | -42.508518 | -44.463699 |
| Peak to Trough Draw % | -46.929152 | -45.765632 | -54.792592 |
| Top 5% Monthly PnL Share | 0.556905 | 0.579061 | 0.575225 |
| USD_EQXR_NSA correl | 0.285138 | 0.309005 | 0.270692 |
| UHY_CRXR_NSA correl | 0.353811 | 0.379333 | 0.343562 |
| UIG_CRXR_NSA correl | 0.35394 | 0.377098 | 0.330492 |
| Traded Months | 310 | 310 | 310 |
Customized relative signals #
Specs and panel test #
dict_relc = {
    "sigs": ['MACROSPREAD_RPS_CWS_ZNvEM','MACRORATING_RPS_CWS_ZNvEM', 'MACROALL_RPS_CWS_ZNvEM', 'MARKETRISK_ZNvEM'],
    "targs": ["FCBIXR_VT10vEM", "FCBIXR_NSAvEM"],
    "cidx": cids_fc,
    "start": "2000-01-01",
    "black": black_fc,
}
dix = dict_relc

sigs = dix['sigs']
ret = dix["targs"][0]
cidx = dix["cidx"]
start = dix["start"]
black = dix["black"]

catregs = {}
for sig in sigs:
    catregs[sig] = msp.CategoryRelations(
        dfx,
        xcats=[sig, ret],
        cids=cidx,
        freq="Q",
        lag=1,
        xcat_aggs=["mean", "sum"],
        start=start,
        blacklist=black,
    )

msv.multiple_reg_scatter(
    cat_rels=[v for k, v in catregs.items()],
    ncol=2,
    nrow=2,
    figsize=(14, 12),
    title=None,
    title_fontsize=20,
    xlab="End-of-quarter score",
    ylab="Foreign currency bond index excess returns, vol targeted, %, next quarter",
    coef_box="lower right",
    prob_est="map",
    single_chart=True,
    subplot_titles=[dict_labels[key] for key in sigs]
)
Accuracy and correlation check #
dix = dict_relc

sigs = dix['sigs']
ret = dix["targs"][0]
cidx = dix["cidx"]
start = dix["start"]
black = dix["black"]

srr = mss.SignalReturnRelations(
    dfx,
    rets=ret,
    cids=cidx,
    sigs=sigs,
    # cosp=True,
    freqs="M",
    agg_sigs=["mean"],  # for stability
    start=start,
)

dix["srr"] = srr
dix = dict_relc
srr = dix["srr"]

tbl=srr.multiple_relations_table(signal_name_dict=dict_labels,return_name_dict={'FCBIXR_VT10vEM': 'Relative foreign currency bond index returns, volatility adjusted'}).round(3)
display(tbl.transpose())
| Return | Relative foreign currency bond index returns, volatility adjusted | |||
|---|---|---|---|---|
| Signal | Relative market risk score | Relative macro-spread risk premium score, custom weights | Relative macro-rating risk premium score, custom weights | Relative macro risk premium score, custom weights |
| Frequency | M | M | M | M |
| Aggregation | mean | mean | mean | mean |
| accuracy | 0.531 | 0.528 | 0.527 | 0.534 |
| bal_accuracy | 0.531 | 0.528 | 0.527 | 0.534 |
| pos_sigr | 0.491 | 0.486 | 0.519 | 0.502 |
| pos_retr | 0.500 | 0.501 | 0.499 | 0.500 |
| pos_prec | 0.532 | 0.529 | 0.525 | 0.533 |
| neg_prec | 0.531 | 0.526 | 0.529 | 0.534 |
| pearson | 0.028 | 0.021 | 0.049 | 0.037 |
| pearson_pval | 0.033 | 0.107 | 0.000 | 0.004 |
| kendall | 0.040 | 0.028 | 0.041 | 0.037 |
| kendall_pval | 0.000 | 0.001 | 0.000 | 0.000 |
| auc | 0.531 | 0.528 | 0.527 | 0.534 |
Naive PnLs #
dix = dict_relc

sigs = dix["sigs"]
ret = dix["targs"][0]
cidx = dix["cidx"]
start = dix["start"]
black = dix["black"]

pnls = msn.NaivePnL(
    df=dfx,
    ret=ret,
    sigs=sigs,
    cids=cidx,
    start=start,
    blacklist=black,
    bms=bms,
)
for sig in sigs:
    pnls.make_pnl(
        sig=sig,
        sig_op="zn_score_pan",
        thresh=2,
        sig_add=0,
        rebal_freq="monthly",
        neutral="zero",
        pnl_name=sig + "_PNL",
        rebal_slip=1,
        vol_scale=10,
    )

dix["pnls"] = pnls
dix = dict_relc
bias = 0
pnls = dix["pnls"]
sigs = dix["sigs"]

sigs = ["MACROSPREAD_RPS_CWS_ZNvEM", "MACRORATING_RPS_CWS_ZNvEM", "MACROALL_RPS_CWS_ZNvEM"]
strats = [sig + "_PNL" for sig in sigs]

pnl_labels = {
    "MACROSPREAD_RPS_CWS_ZNvEM_PNL": "Spread-based relative macro risk premium score",
    "MACRORATING_RPS_CWS_ZNvEM_PNL": "Ratings-based relative macro risk premium score",
    "MACROALL_RPS_CWS_ZNvEM_PNL": "Composite relative macro risk premium score",
}

pnls.plot_pnls(
    title="Naive PnL for relative risk-premia strategies, 24 EM sovereigns, 4-factor macro risk",
    pnl_cats=strats,
    xcat_labels=pnl_labels,
    title_fontsize=14,
)
display(pnls.evaluate_pnls(pnl_cats=strats,label_dict=pnl_labels).round(3))
pnls.signal_heatmap(pnl_name=f"MACROALL_RPS_CWS_ZNvEM_PNL", figsize=(20, 10))
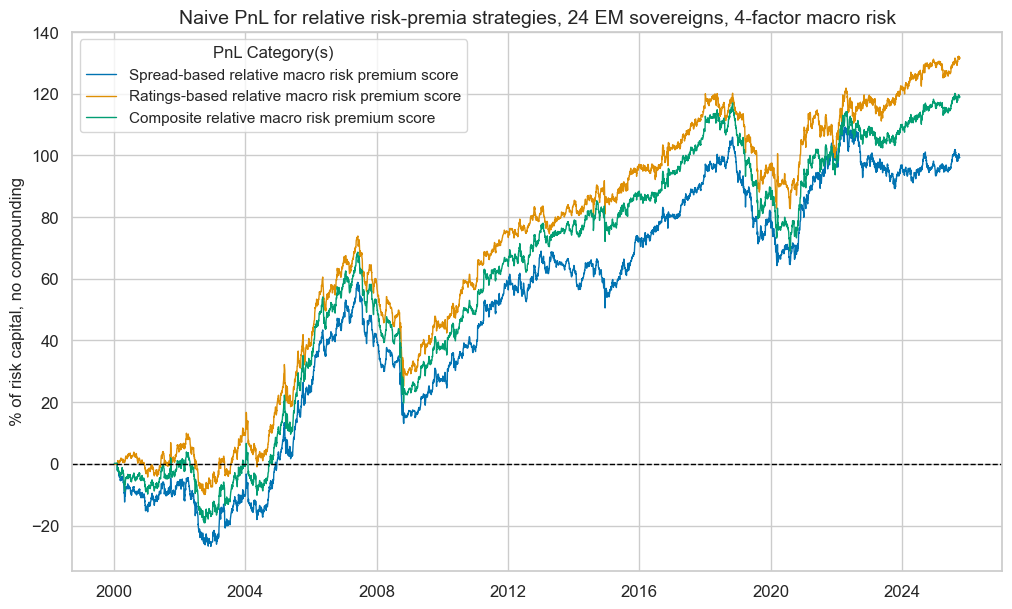
| xcat | Spread-based relative macro risk premium score | Ratings-based relative macro risk premium score | Composite relative macro risk premium score |
|---|---|---|---|
| Return % | 3.857335 | 5.105409 | 4.617518 |
| St. Dev. % | 10.0 | 10.0 | 10.0 |
| Sharpe Ratio | 0.385734 | 0.510541 | 0.461752 |
| Sortino Ratio | 0.541948 | 0.721108 | 0.650045 |
| Max 21-Day Draw % | -16.301815 | -19.993943 | -18.754173 |
| Max 6-Month Draw % | -23.856189 | -27.901447 | -27.140909 |
| Peak to Trough Draw % | -45.723035 | -48.676369 | -48.951314 |
| Top 5% Monthly PnL Share | 1.06615 | 0.812975 | 0.893534 |
| USD_EQXR_NSA correl | 0.120726 | 0.178927 | 0.17323 |
| UHY_CRXR_NSA correl | 0.144071 | 0.190708 | 0.192286 |
| UIG_CRXR_NSA correl | 0.123587 | 0.173953 | 0.17532 |
| Traded Months | 310 | 310 | 310 |