EM local bond markets scorecard #
Get packages and JPMaQS data #
Set up parameters and import packages #
# Constants and credentials
import os
import pandas as pd

REQUIRED_VERSION: str = "1.4.0"
DQ_CLIENT_ID: str = os.getenv("DQ_CLIENT_ID")  # Use your DataQuery ID if it is not an environment variable
DQ_CLIENT_SECRET: str = os.getenv("DQ_CLIENT_SECRET") # Use your DataQuery secret if it is not an environment variable
PROXY = {}  # Configure if behind corporate firewall
START_DATE: str = "2000-01-01"  # Start date for data download
END_DATE: str = (pd.Timestamp.today() - pd.offsets.BDay(1)).strftime('%Y-%m-%d')
import macrosynergy as msy

msy.check_package_version(required_version=REQUIRED_VERSION)
# If version check fails: pip install macrosynergy --upgrade
from datetime import date, datetime
import os

import macrosynergy.management as msm
import macrosynergy.panel as msp
import macrosynergy.pnl as msn
import macrosynergy.visuals as msv
import macrosynergy.signal as mss

from macrosynergy.download import JPMaQSDownload
from macrosynergy.visuals import ScoreVisualisers

pd.set_option('display.width', 400)
import warnings

warnings.simplefilter("ignore")
Download quantamental indicators #
# Cross-sections of interest

cids_latm = ["BRL", "COP", "CLP", "MXN", "PEN"]  # Latam countries
cids_emea = ["CZK", "HUF", "PLN", "RON", "RUB", "TRY", "ZAR"]  # EMEA countries, "ILS" not included
cids_emas = ["IDR", "MYR", "PHP", "THB"]  # EM Asia countries "CNY", "INR", "KRW", "SGD", "TWD"

cids_em = sorted(cids_latm + cids_emea + cids_emas)

cids = sorted(cids_em + ["USD"])
# Quantamental category groups
# External ratio trends
xbch = [
"MTBGDPRATIO_NSA_12MMA_D1M1ML3",
"MTBGDPRATIO_SA_6MMA_D1M1ML6",
"MTBGDPRATIO_SA_3MMAv60MMA",
"CABGDPRATIO_SA_3MMAv60MMA",
"CABGDPRATIO_SA_1QMAv20QMA",
]
# Intuitive GDP growth estimates
igdp = [
"INTRGDP_NSA_P1M1ML12",
"INTRGDP_NSA_P1M1ML12_3MMA",
"INTRGDPv5Y_NSA_P1M1ML12_3MMA",
]
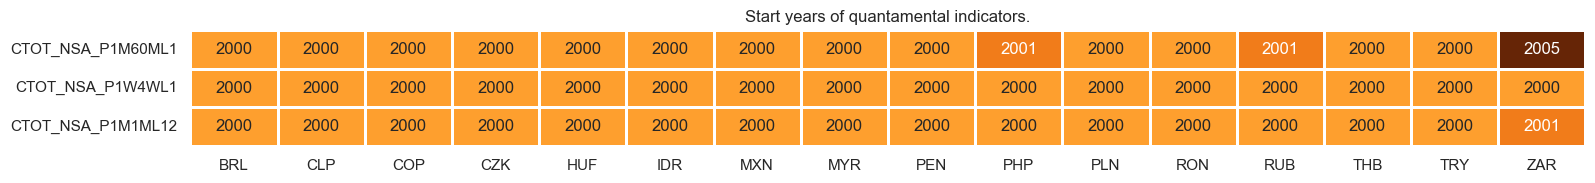
# Terms of trade trends
tots = [
"CTOT_NSA_P1M1ML12",
"CTOT_NSA_P1W4WL1",
"CTOT_NSA_P1M60ML1",
]
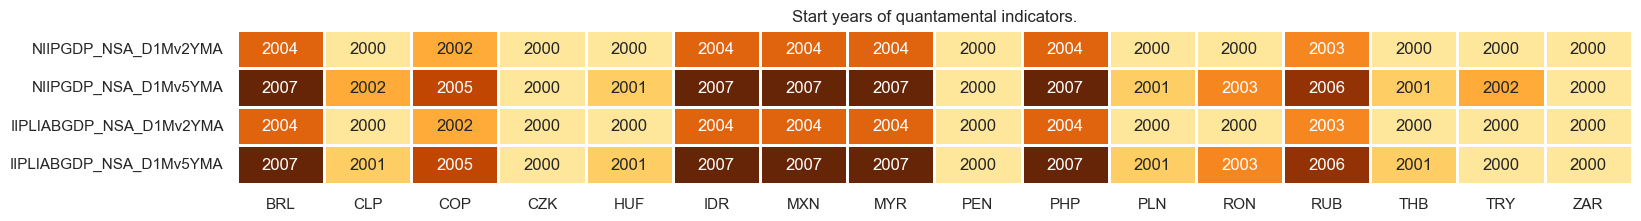
# International investment position trends
niip = [
"NIIPGDP_NSA_D1Mv2YMA",
"NIIPGDP_NSA_D1Mv5YMA",
"IIPLIABGDP_NSA_D1Mv2YMA",
"IIPLIABGDP_NSA_D1Mv5YMA",
]
# Government balances
dsus = [
"GGSBGDPRATIO_NSA",
"GGOBGDPRATIO_NSA",
"GGPBGDPRATIO_NSA",
]
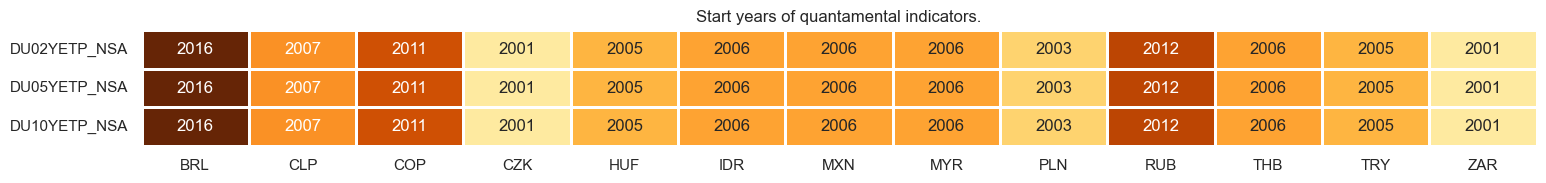
# Term premia estimates
dutp = [
"DU02YETP_NSA",
"DU05YETP_NSA",
"DU10YETP_NSA",
]
# ALl macro categories
macro = igdp + tots + niip + xbch + dsus + dutp
# Market categories
blkl = [
"FXTARGETED_NSA",
"FXUNTRADABLE_NSA",
]
rets = [
"LCBIRUSD_NSA",
"LCBIXRUSD_NSA",
"LCBIXRUSD_VT10",
]
mkts = blkl + rets
xcats = macro + mkts
# Tickers for download
single_tix = ["USD_GB10YXR_NSA", "EUR_FXXR_NSA", "USD_EQXR_NSA"]
tickers = (
[cid + "_" + xcat for cid in cids for xcat in xcats]
+ single_tix
+ [cid + "_" + xcat for cid in ["USD"] for xcat in xcats]
)
# Download macro-quantamental indicators from JPMaQS via the DataQuery API
with JPMaQSDownload(
    client_id=DQ_CLIENT_ID, client_secret=DQ_CLIENT_SECRET, proxy=PROXY
) as downloader:
    df: pd.DataFrame = downloader.download(
        tickers=tickers,
        start_date=START_DATE,
        metrics=["value"],
        suppress_warning=True,
        show_progress=True,
    )
Downloading data from JPMaQS.
Timestamp UTC:  2025-11-05 09:57:12
Connection successful!
Requesting data: 100%|██████████| 23/23 [00:04<00:00,  4.92it/s]
Downloading data: 100%|██████████| 23/23 [00:33<00:00,  1.44s/it]
Some expressions are missing from the downloaded data. Check logger output for complete list.
32 out of 445 expressions are missing. To download the catalogue of all available expressions and filter the unavailable expressions, set `get_catalogue=True` in the call to `JPMaQSDownload.download()`.
dfx = df.copy().sort_values(["cid", "xcat", "real_date"])
dfx.info()
<class 'pandas.core.frame.DataFrame'>
Index: 2572595 entries, 13484 to 2538884
Data columns (total 4 columns):
 #   Column     Dtype
---  ------     -----
 0   real_date  datetime64[ns]
 1   cid        object
 2   xcat       object
 3   value      float64
dtypes: datetime64[ns](1), float64(1), object(2)
memory usage: 98.1+ MB
Re-namings, availability checks and blacklists #
Renaming quarterly categories #
dict_repl = {
    "CABGDPRATIO_SA_1QMAv20QMA": "CABGDPRATIO_SA_3MMAv60MMA",
}

dfx["xcat"] = dfx["xcat"].map(lambda v: dict_repl.get(v, v))

to_drop = set(dict_repl)           # faster membership tests than list/dict_keys
dfx = dfx[~dfx["xcat"].isin(to_drop)]

if hasattr(dfx["xcat"], "cat"):
    dfx["xcat"] = dfx["xcat"].cat.remove_categories(list(to_drop))
    dfx["xcat"] = dfx["xcat"].cat.remove_unused_categories()
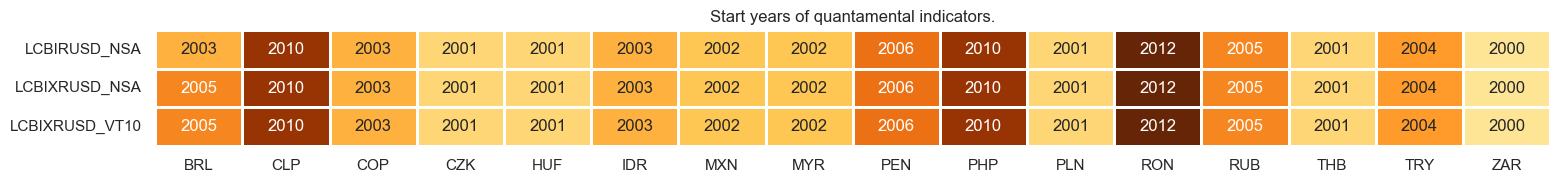
Availability check #
xcatx = rets
cidx = cids_em

msm.check_availability(dfx, xcats = xcatx, cids = cidx, missing_recent=False)
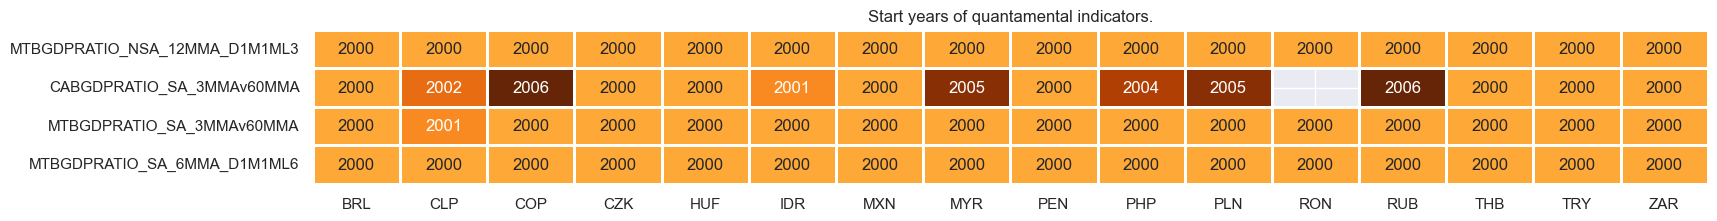
xcatx = list(set([dict_repl.get(item, item) for item in xbch]))
cidx = cids_em

msm.check_availability(dfx, xcats = xcatx, cids = cidx, missing_recent=False)
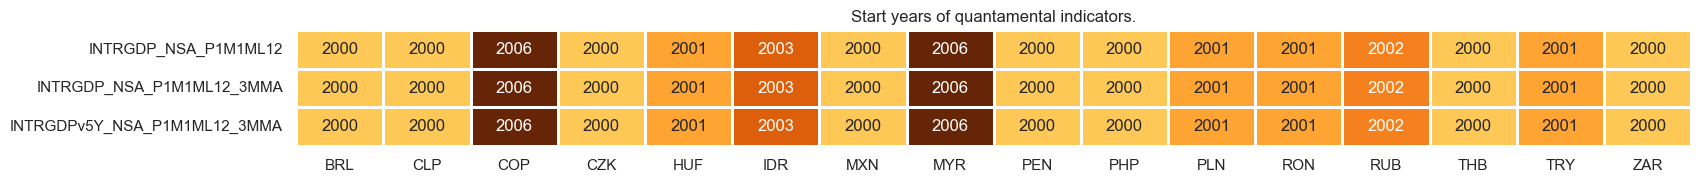
xcatx = igdp
cidx = cids_em

msm.check_availability(dfx, xcats = xcatx, cids = cidx, missing_recent=False)
xcatx = list(set([dict_repl.get(item, item) for item in tots]))
cidx = cids_em

msm.check_availability(dfx, xcats = xcatx, cids = cidx, missing_recent=False)
xcatx = niip
cidx = cids_em

msm.check_availability(dfx, xcats = xcatx, cids = cidx, missing_recent=False)
xcatx = dsus
cidx = cids_em

msm.check_availability(dfx, xcats = xcatx, cids = cidx, missing_recent=False)

xcatx = dutp
cidx = cids_em

msm.check_availability(dfx, xcats = xcatx, cids = cidx, missing_recent=False)
Blacklisting based on FX forward markets #
dfb = dfx[dfx["xcat"].isin(["FXUNTRADABLE_NSA"])].loc[
    :, ["cid", "xcat", "real_date", "value"]
]
dfba = (
    dfb.groupby(["cid", "real_date"])
    .aggregate(value=pd.NamedAgg(column="value", aggfunc="max"))
    .reset_index()
)
dfba["xcat"] = "FXBLACK"
fxblack = msp.make_blacklist(dfba, "FXBLACK")
fxblack
{'MYR': (Timestamp('2018-07-02 00:00:00'), Timestamp('2025-11-04 00:00:00')),
 'PEN': (Timestamp('2021-07-01 00:00:00'), Timestamp('2021-07-30 00:00:00')),
 'RUB': (Timestamp('2022-02-01 00:00:00'), Timestamp('2025-11-04 00:00:00')),
 'THB': (Timestamp('2007-01-01 00:00:00'), Timestamp('2008-11-28 00:00:00')),
 'TRY_1': (Timestamp('2000-01-03 00:00:00'), Timestamp('2003-09-30 00:00:00')),
 'TRY_2': (Timestamp('2020-01-01 00:00:00'), Timestamp('2024-07-31 00:00:00'))}
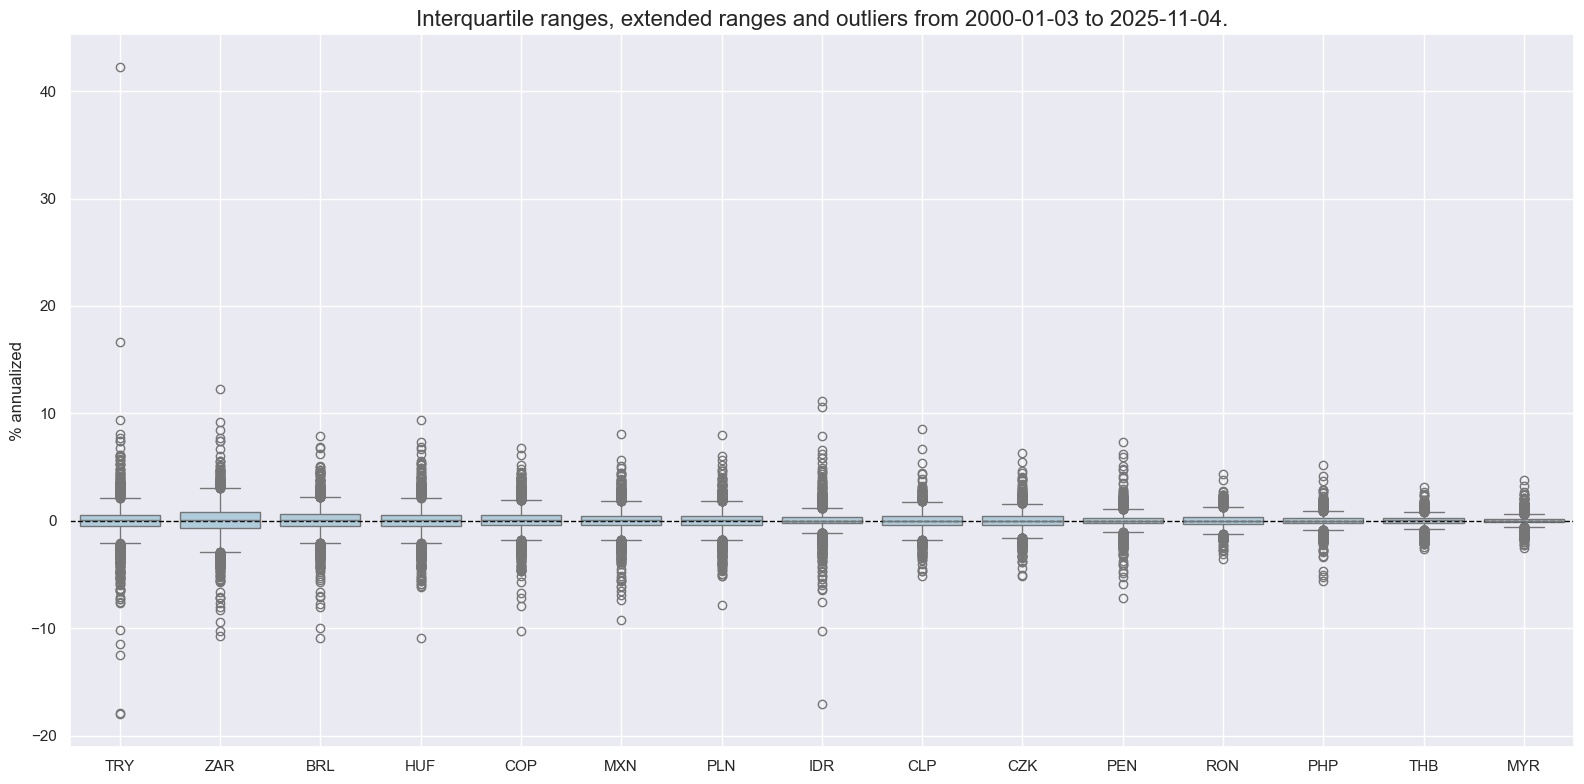
Local-currency bond index returns #
xcatx = [
    "LCBIRUSD_NSA",
]
cidx = sorted(list(set(cids_em) - set(["RUB"])))


msp.view_ranges(
    dfx,
    cids=cidx,
    xcats=xcatx,
    kind="box",
    sort_cids_by="std",
    title=None,
    ylab="% annualized",
    start="2000-01-01",
    title_fontsize=20,
)
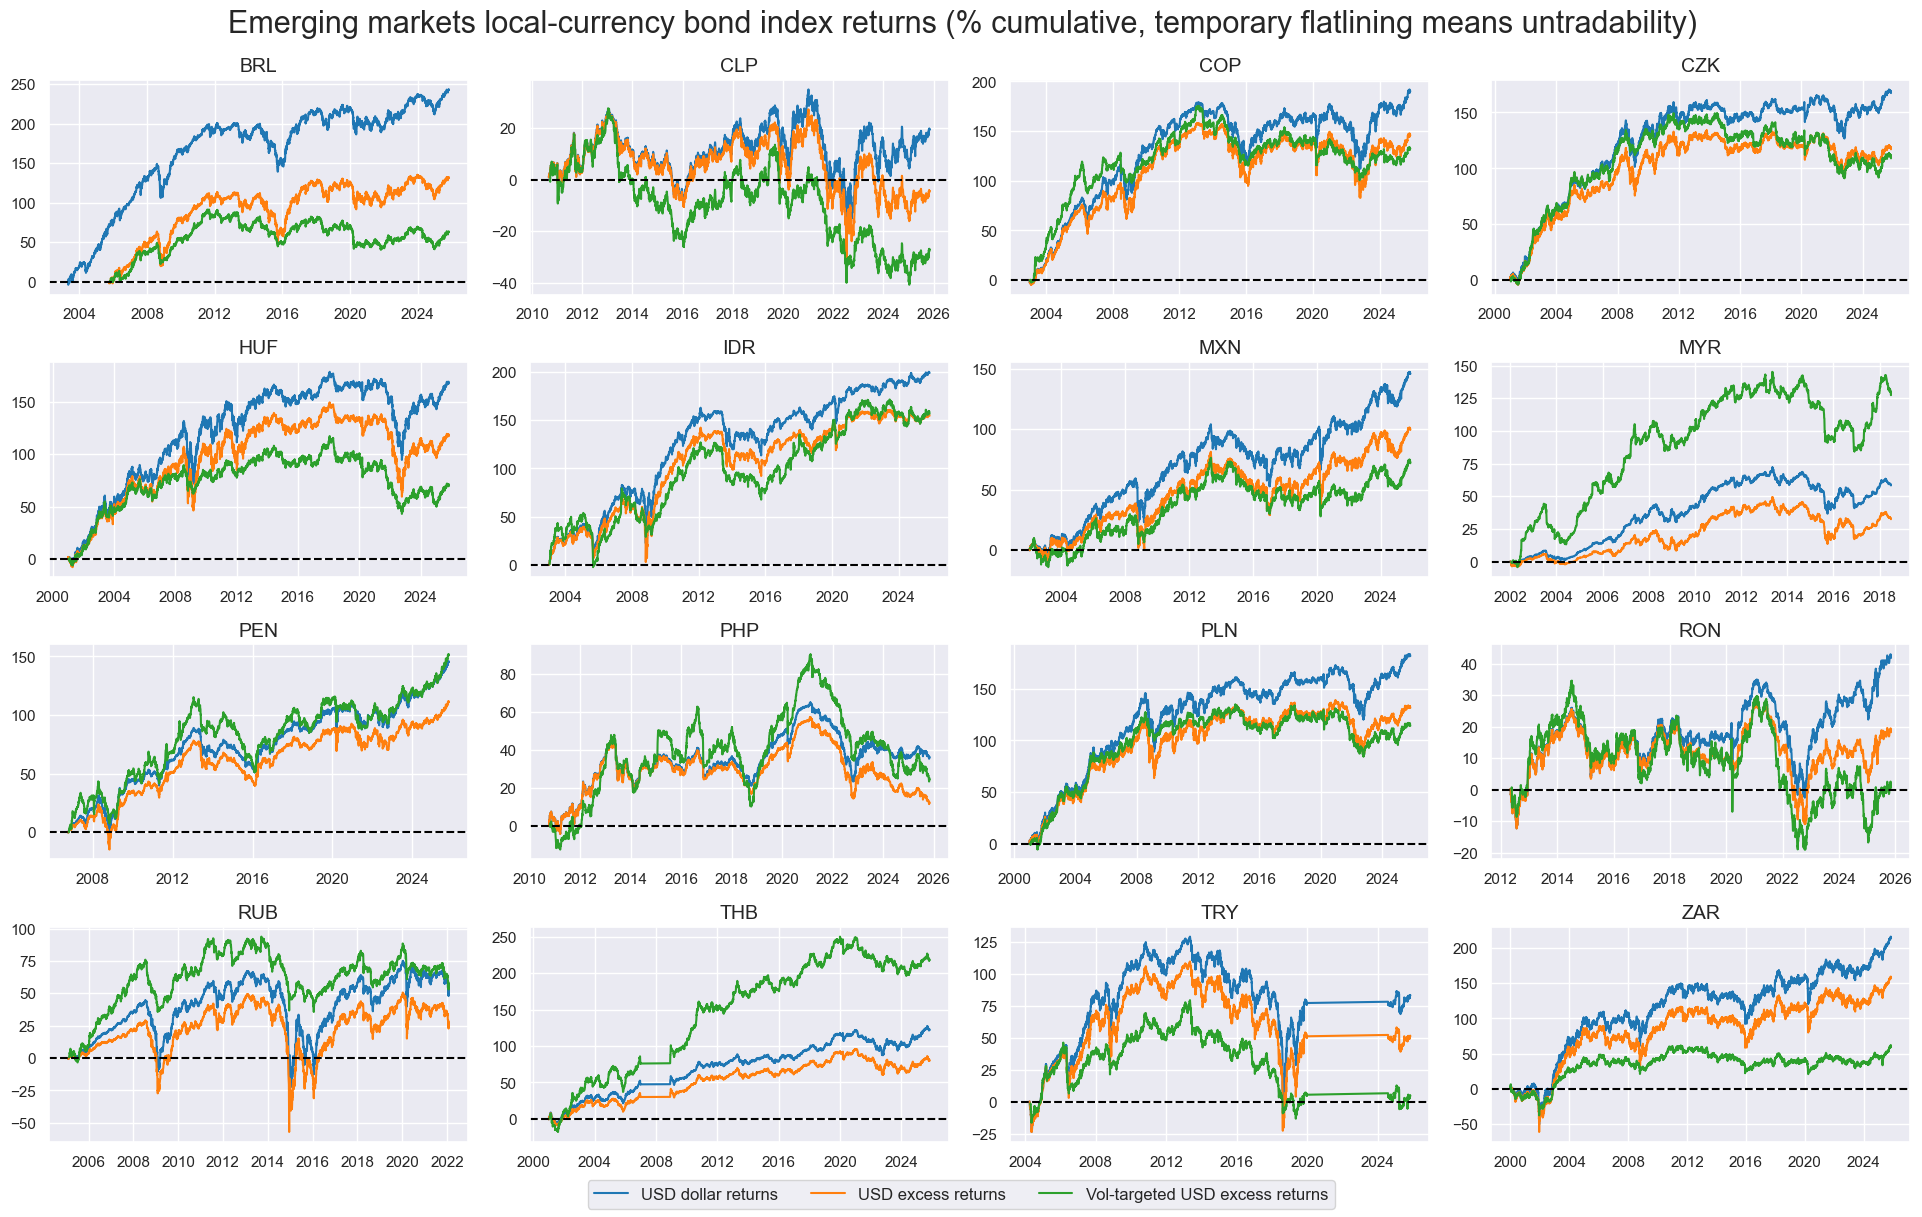
xcatx = ["LCBIRUSD_NSA", "LCBIXRUSD_NSA", "LCBIXRUSD_VT10"]
cidx = cids_em

msp.view_timelines(
    dfx,
    xcats=xcatx,
    cids=cidx,
    ncol=4,
    start="2000-01-01",
    cumsum=True,
    same_y=False,
    height=2.0,
    size=(10, 10),
    all_xticks=True,
    blacklist=fxblack,
    title="Emerging markets local-currency bond index returns (% cumulative, temporary flatlining means untradability)",
    title_fontsize=22,
    xcat_labels=[
        "USD dollar returns",
        "USD excess returns",
        "Vol-targeted USD excess returns",
    ],

)
# Estimated short-term historical volatility

xcatx = ["LCBIRUSD_NSA", "LCBIXRUSD_NSA"]
cidx = cids_em

dfa = pd.DataFrame(columns=dfx.columns)

for xc in xcatx:
    dfaa = msp.historic_vol(
        dfx,
        xcat=xc,
        cids=cidx,
        lback_periods=21,
        lback_meth="ma",
        half_life=11,
        est_freq="M",
        blacklist=fxblack,
        postfix="_ASD",
    )
    dfa = msm.update_df(dfa, dfaa)

dfx = msm.update_df(dfx, dfa)
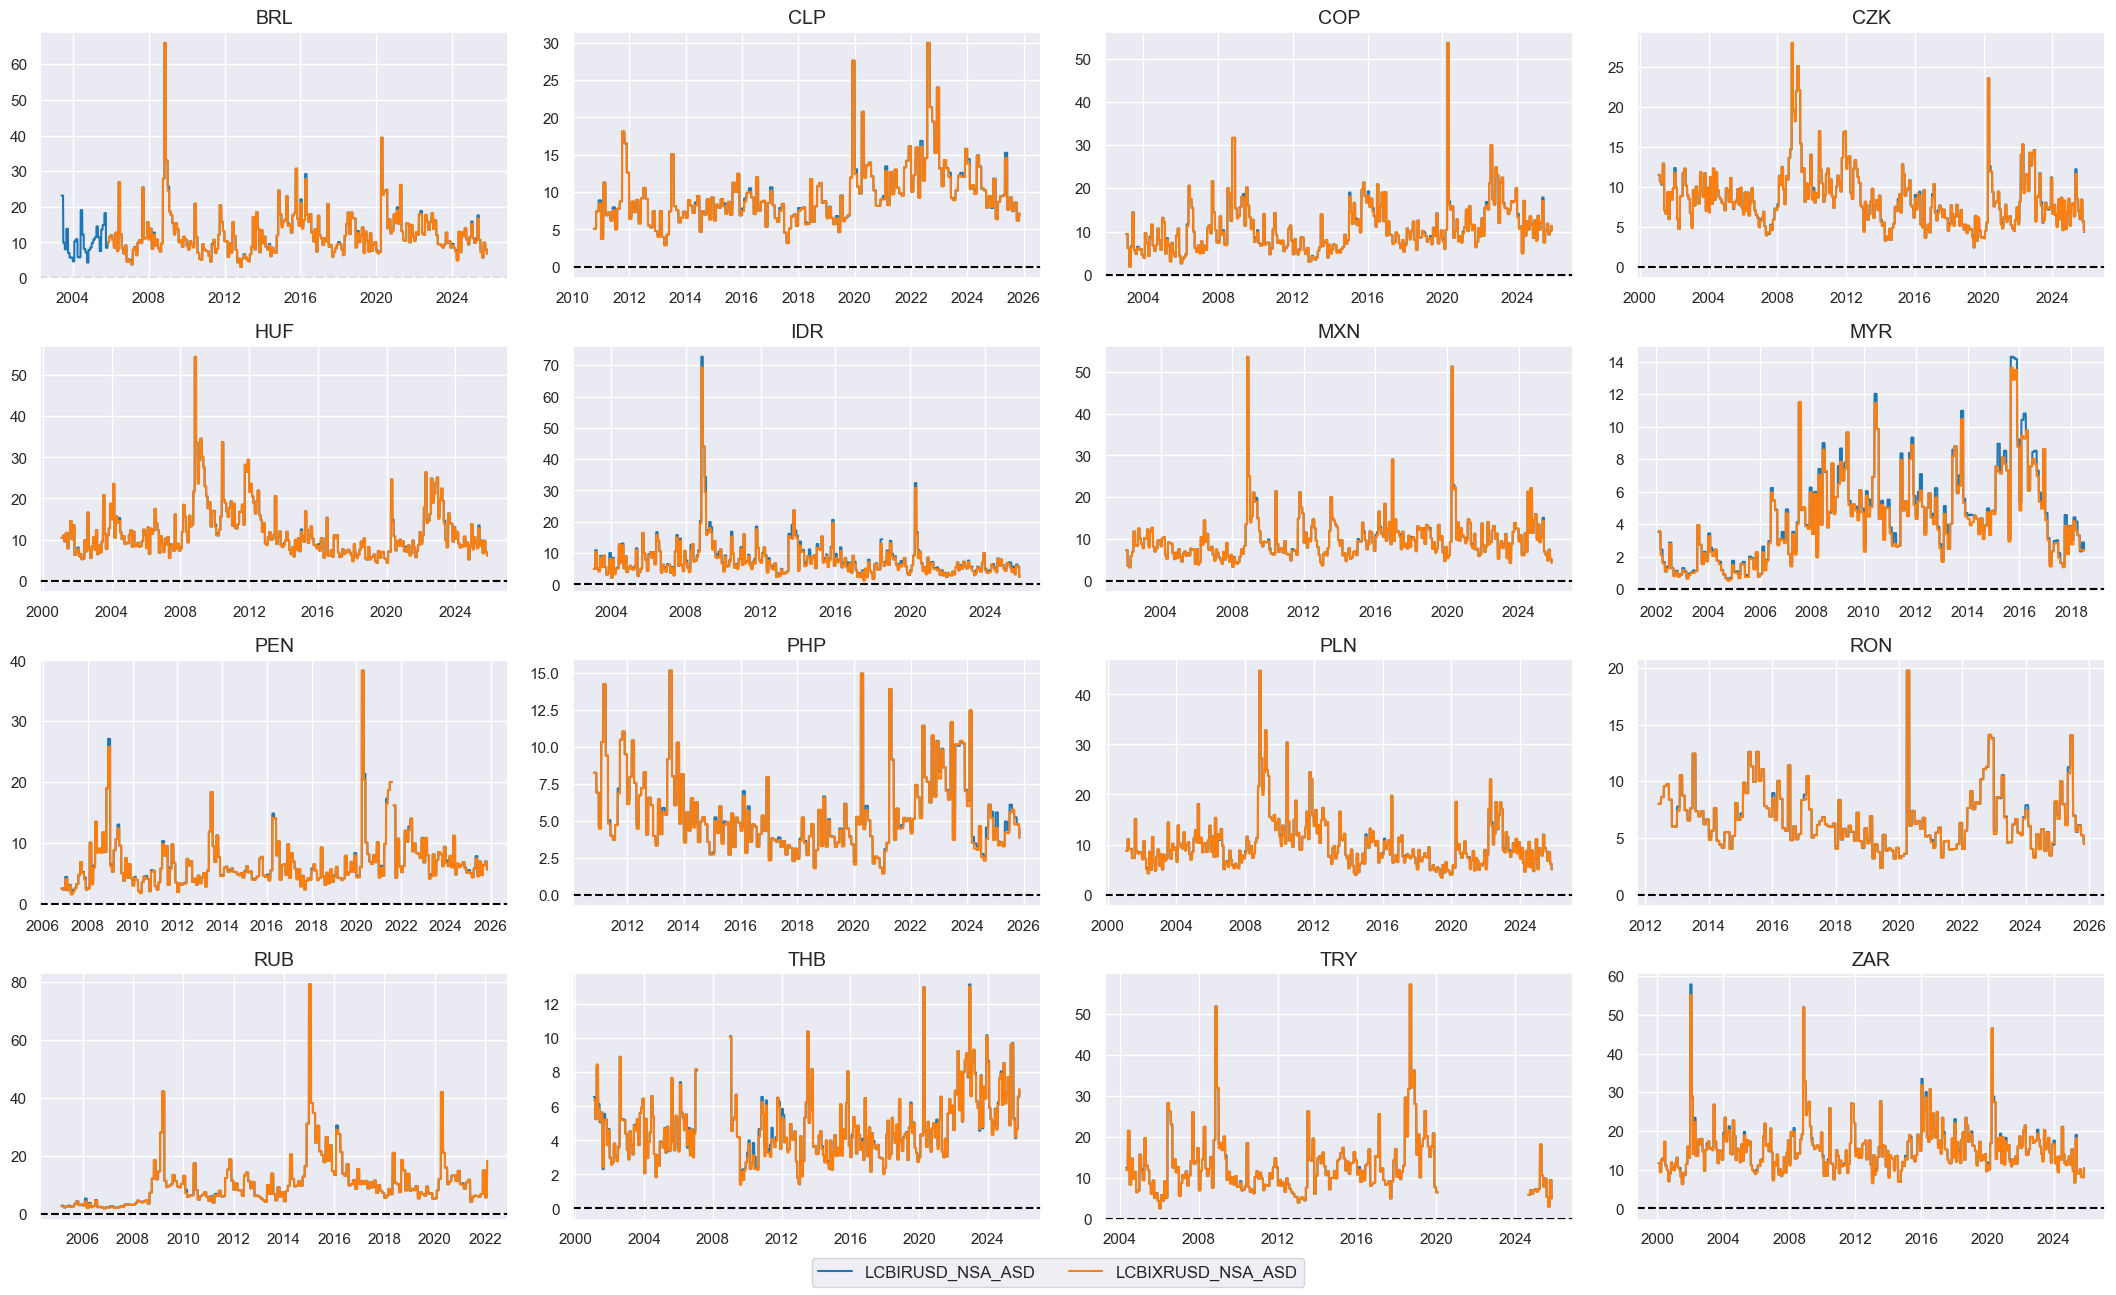
# Checkup of volatilities

xcatx = ["LCBIRUSD_NSA_ASD", "LCBIXRUSD_NSA_ASD"]
cidx = cids_em

msp.view_timelines(
    dfx,
    xcats=xcatx,
    cids=cidx,
    ncol=4,
    start="2000-01-01",
    same_y=False,
    height=2.2,
    size=(10, 10),
    all_xticks=True,
)
Factor construction and checks #
# Initiate labeling dictionary
dict_lab = {}
concept_factors_zn = {}
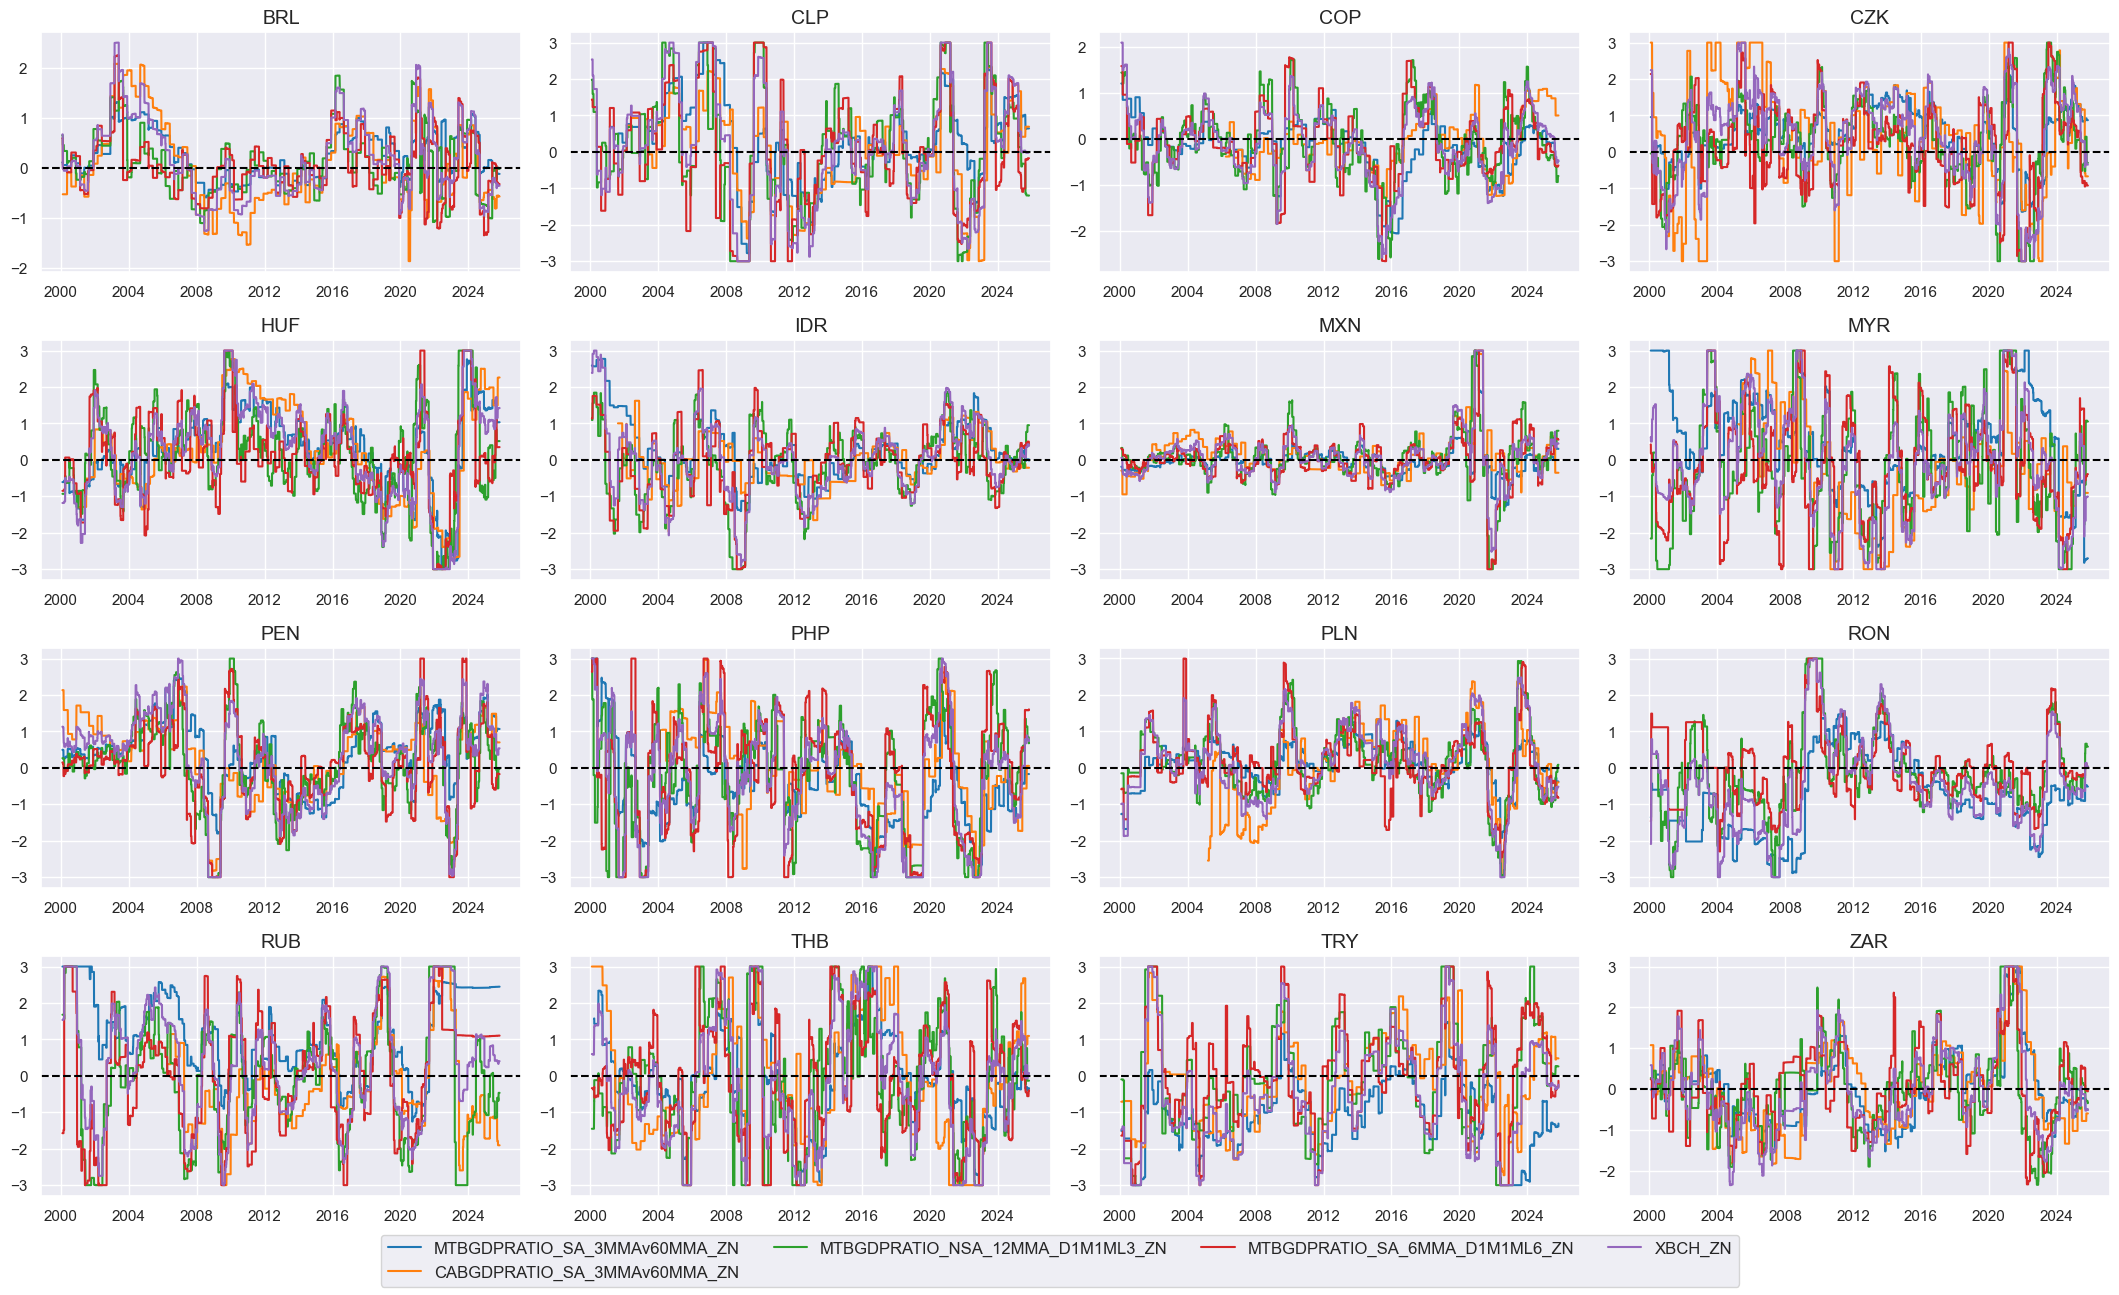
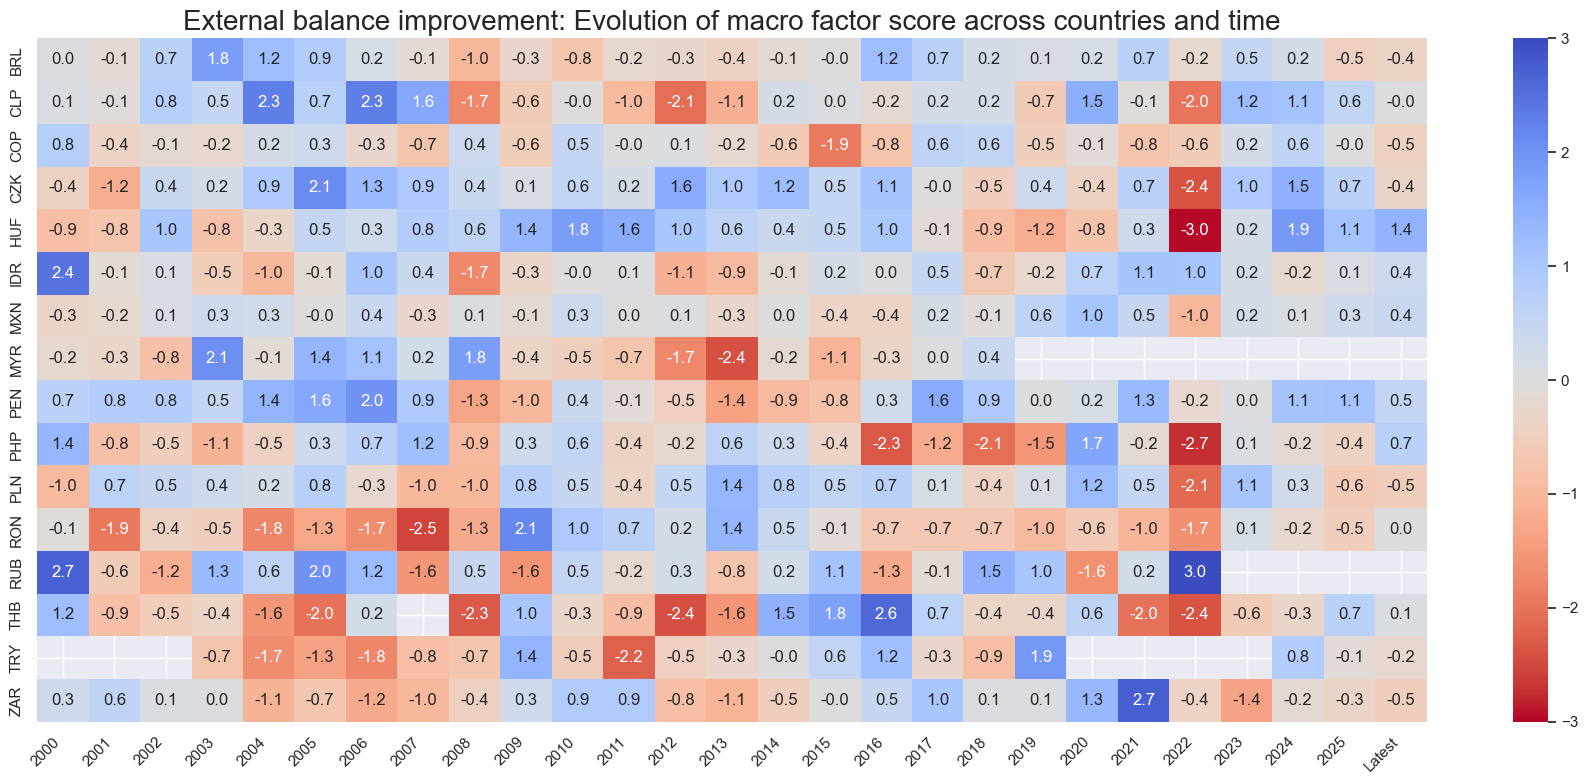
External balance improvement #
# All constituents, signs, and weights

dict_xbch = {
    "MTBGDPRATIO_SA_3MMAv60MMA": {"sign": 1, "weight": 1/4},
    "CABGDPRATIO_SA_3MMAv60MMA": {"sign": 1, "weight": 1/4},
    'MTBGDPRATIO_NSA_12MMA_D1M1ML3': {"sign": 1, "weight": 1/4},
    'MTBGDPRATIO_SA_6MMA_D1M1ML6': {"sign": 1, "weight": 1/4},
}
# Normalized categories with theoretical positive effects

dix = dict_xbch
cidx = cids_em

# Contingent negative values

if any (v["sign"] < 0 for v in dix.values()):
    calcs=[]
    dfa = pd.DataFrame(columns=dfx.columns)
    for xc, values in dix.items():
        if values["sign"] < 0:
            calcs.append(f"{xc}NEG = {xc} * -1")
            dfa = msp.panel_calculator(dfx, calcs=calcs, cids=cidx)
    dfx = msm.update_df(dfx, dfa)

# Sequential normalization of categories

postfixes = ["NEG" if v["sign"] < 0 else "" for v in dix.values()]
xcatx = [k + pf for k, pf in zip(dix.keys(), postfixes)]

for xc in xcatx:
    dfa = msp.make_zn_scores(
        dfx,
        xcat=xc,
        cids=cidx,
        sequential=True,
        min_obs=261 * 3,
        neutral="zero",
        pan_weight=1,
        thresh=3,
        postfix="_ZN",
        est_freq="m",
    )
    dfx = msm.update_df(dfx, dfa)

xbchz = [xc + "_ZN" for xc in xcatx]
# Conceptual factor score

dix = dict_xbch
xcatx = xbchz
cidx = cids_em

# Composite score

weights = [v["weight"] for v in dix.values()]
cfs = "XBCH"

dfa = msp.linear_composite(
    df=dfx,
    xcats=xcatx,
    cids=cidx,
    weights=weights,
    new_xcat=cfs,
    complete_xcats=False,
)
dfx= msm.update_df(dfx, dfa)

# Re-score

dfa = msp.make_zn_scores(
    dfx,
    xcat=cfs,
    cids=cidx,
    sequential=True,
    min_obs=261 * 3,
    neutral="zero",
    pan_weight=1,
    thresh=3,
    postfix="_ZN",
    est_freq="m",
)
dfx = msm.update_df(dfx, dfa)

cfs_zn = f"{cfs}_ZN"
concept_factors_zn[cfs_zn] = "External balance improvement"
# Visualize

xcatx = xbchz + ["XBCH_ZN"]
cidx = cids_em

msp.view_timelines(
    dfx,
    xcats=xcatx,
    cids=cidx,
    ncol=4,
    start="2000-01-01",
    same_y=False,
    height=2.2,
    size=(10, 10),
    all_xticks=True,
)
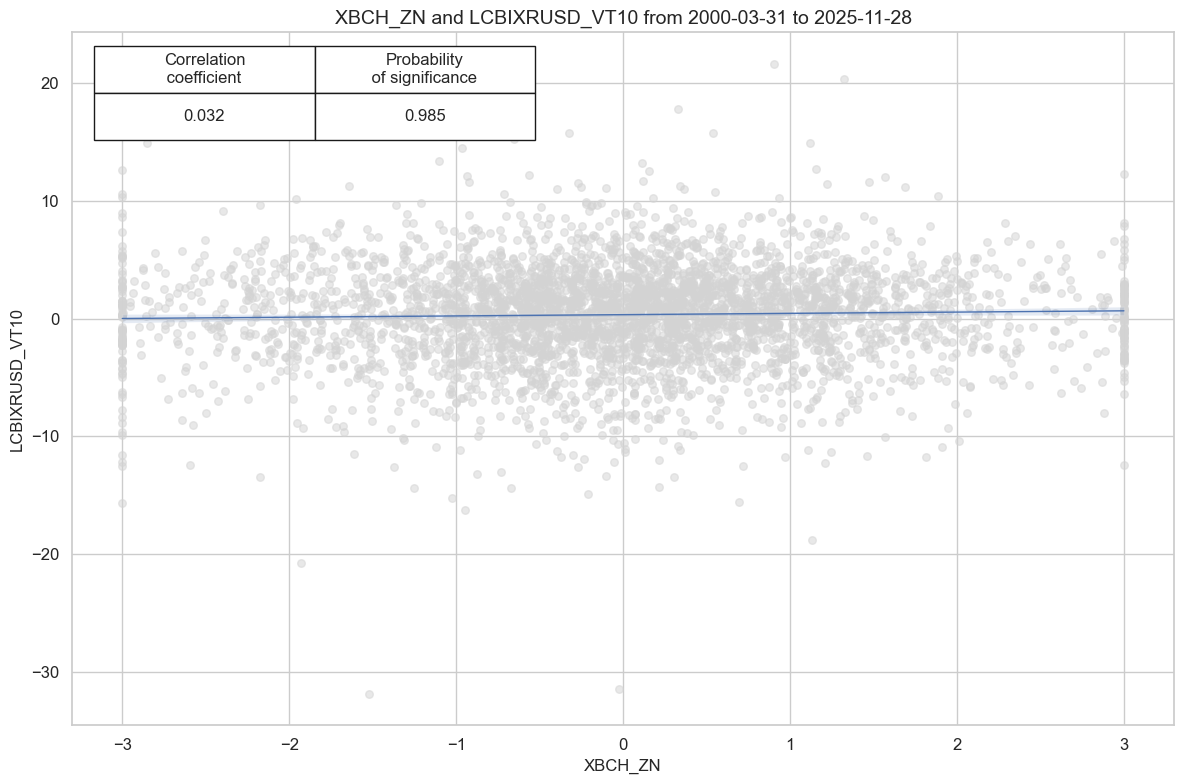
# checking - to delete later

cidx = cids_em
sig = "XBCH_ZN"
targ = "LCBIXRUSD_VT10"

cr = msp.CategoryRelations(
        dfx,
        xcats=[sig, targ],
        cids=cidx,
        freq="M",
        blacklist=fxblack,
        lag=1,
        xcat_aggs=["last", "sum"],
        start="2000-01-01",

    )
cr.reg_scatter(coef_box="upper left", prob_est="map")


srr = mss.SignalReturnRelations(
    dfx,
    cids=cidx,
    sigs=sig,
    rets=targ,
    freqs="M",
    start="2000-01-01",
    blacklist=fxblack,
)
display(srr.multiple_relations_table().round(3))
| accuracy | bal_accuracy | pos_sigr | pos_retr | pos_prec | neg_prec | pearson | pearson_pval | kendall | kendall_pval | auc | ||||
|---|---|---|---|---|---|---|---|---|---|---|---|---|---|---|
| Return | Signal | Frequency | Aggregation | |||||||||||
| LCBIXRUSD_VT10 | XBCH_ZN | M | last | 0.524 | 0.524 | 0.5 | 0.568 | 0.591 | 0.456 | 0.032 | 0.044 | 0.023 | 0.034 | 0.524 |
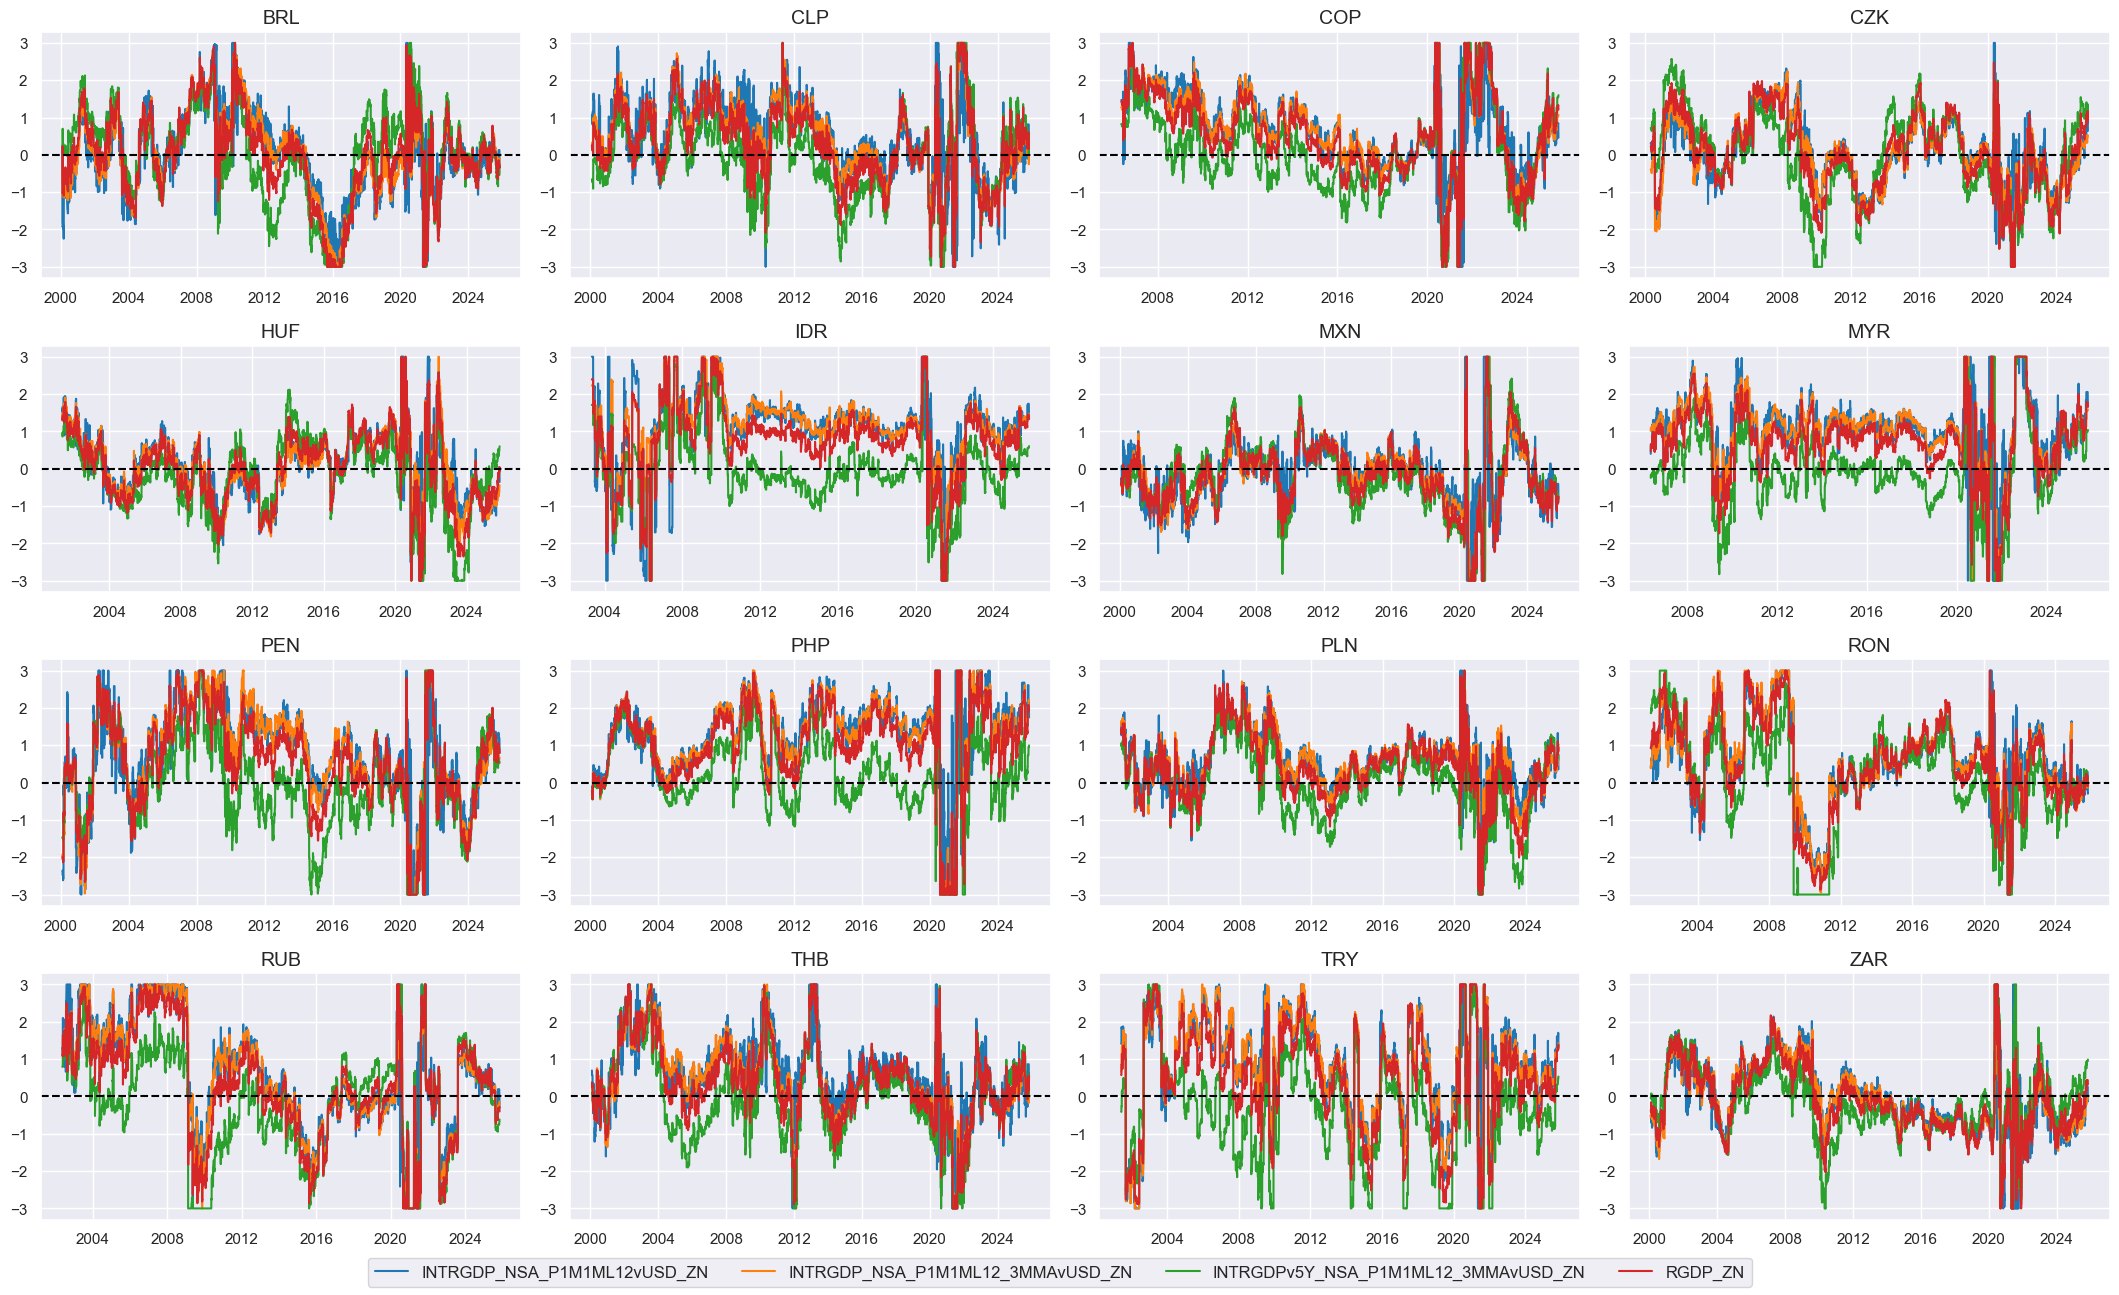
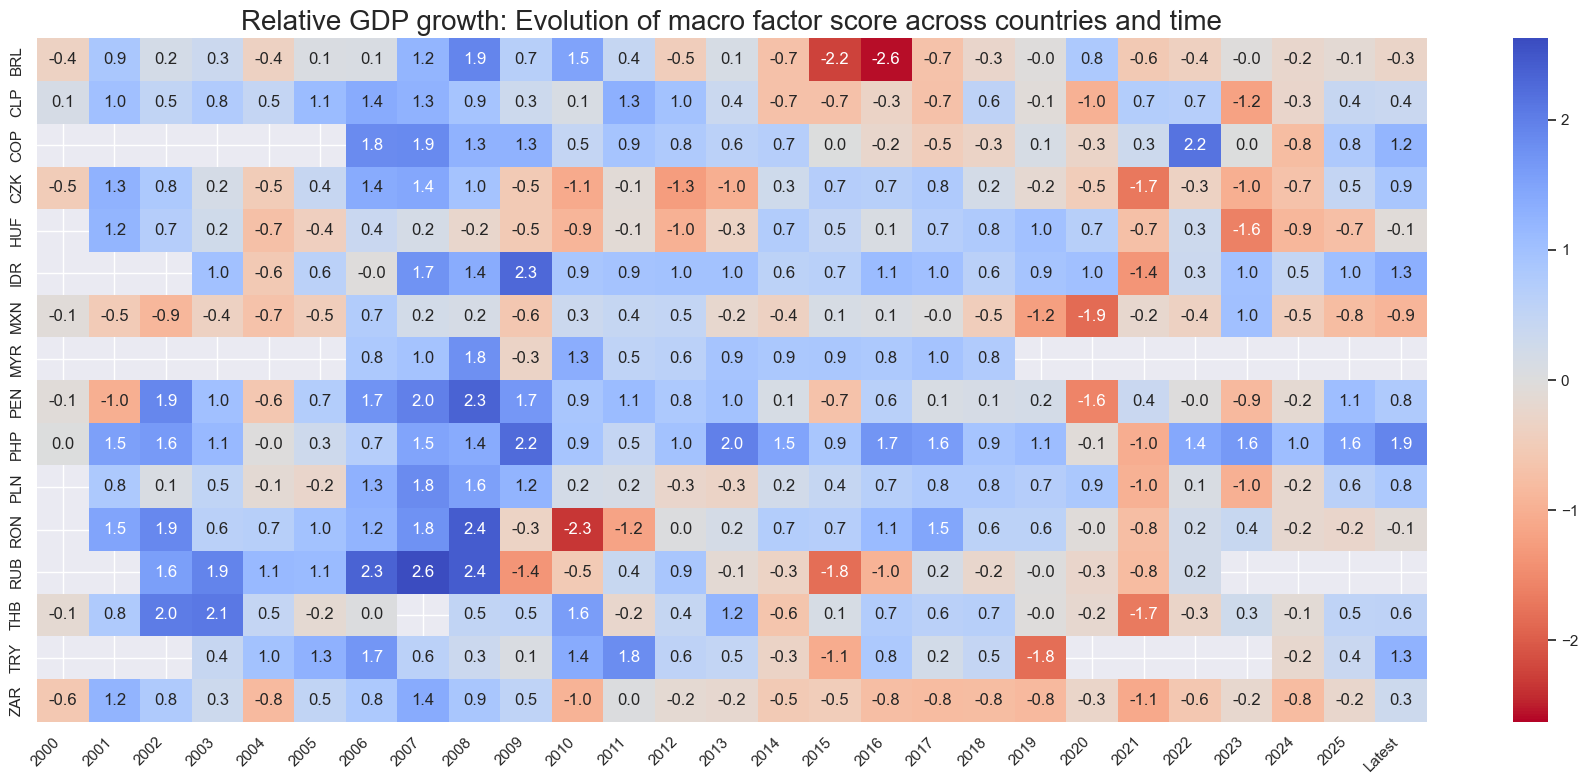
Relative GDP growth #
# Preparatory: relative values to U.S.

xcatx = igdp
cidx = cids

cidx = cids

for xc in xcatx:
    dfa = msp.make_relative_value(
        dfx,
        xcats=xcatx,
        cids=cidx,
        basket=["USD"],
        rel_meth="subtract",
        postfix="vUSD",
    )
    dfx = msm.update_df(df=dfx, df_add=dfa)
# All constituents, signs, and weights

dict_rgdp = {
    'INTRGDP_NSA_P1M1ML12vUSD': {"sign": 1, "weight": 1/3},
    'INTRGDP_NSA_P1M1ML12_3MMAvUSD': {"sign": 1, "weight": 1/3},
    'INTRGDPv5Y_NSA_P1M1ML12_3MMAvUSD': {"sign": 1, "weight": 1/3},
}
# Normalized categories with theoretical positive effects

dix = dict_rgdp
cidx = cids_em

# Contingent negative values

if any (v["sign"] < 0 for v in dix.values()):
    calcs=[]
    dfa = pd.DataFrame(columns=dfx.columns)
    for xc, values in dix.items():
        if values["sign"] < 0:
            calcs.append(f"{xc}NEG = {xc} * -1")
            dfa = msp.panel_calculator(dfx, calcs=calcs, cids=cidx)
    dfx = msm.update_df(dfx, dfa)

# Sequential normalization of categories

postfixes = ["NEG" if v["sign"] < 0 else "" for v in dix.values()]
xcatx = [k + pf for k, pf in zip(dix.keys(), postfixes)]

for xc in xcatx:
    dfa = msp.make_zn_scores(
        dfx,
        xcat=xc,
        cids=cidx,
        sequential=True,
        min_obs=261 * 3,
        neutral="zero",
        pan_weight=1,
        thresh=3,
        postfix="_ZN",
        est_freq="m",
    )
    dfx = msm.update_df(dfx, dfa)

rgdpz = [xc + "_ZN" for xc in xcatx]
# Conceptual factor score

dix = dict_rgdp
xcatx = rgdpz
cidx = cids

# Composite score

weights = [v["weight"] for v in dix.values()]
cfs = "RGDP"

dfa = msp.linear_composite(
    df=dfx,
    xcats=xcatx,
    cids=cidx,
    weights=weights,
    new_xcat=cfs,
    complete_xcats=False,
)
dfx= msm.update_df(dfx, dfa)

# Re-score

dfa = msp.make_zn_scores(
    dfx,
    xcat=cfs,
    cids=cidx,
    sequential=True,
    min_obs=261 * 3,
    neutral="zero",
    pan_weight=1,
    thresh=3,
    postfix="_ZN",
    est_freq="m",
)
dfx = msm.update_df(dfx, dfa)

cfs_zn = f"{cfs}_ZN"
concept_factors_zn[cfs_zn] = "Relative GDP growth"
# Visualize

xcatx = rgdpz + ["RGDP_ZN"]
cidx = cids_em

msp.view_timelines(
    dfx,
    xcats=xcatx,
    cids=cidx,
    ncol=4,
    start="2000-01-01",
    same_y=False,
    height=2.2,
    size=(10, 10),
    all_xticks=True,
)
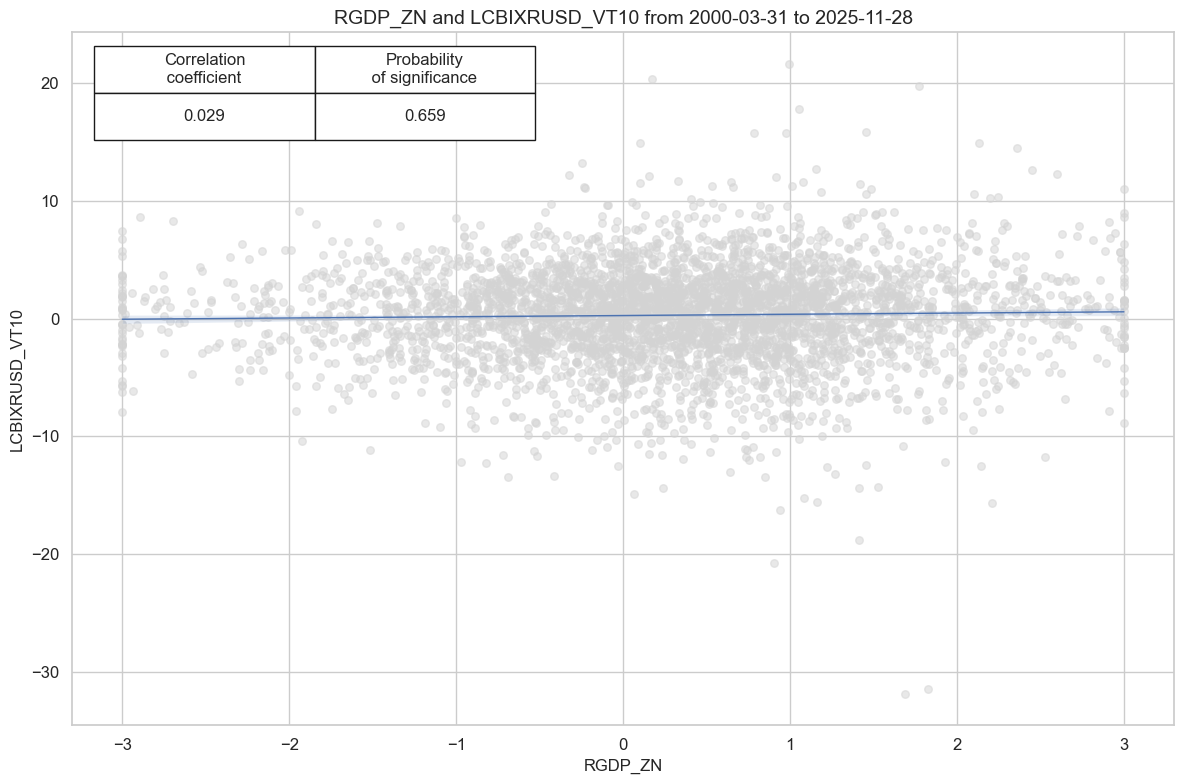
# checking - to delete later
cidx = cids_em
sig = "RGDP_ZN"
targ = "LCBIXRUSD_VT10"

cr = msp.CategoryRelations(
        dfx,
        xcats=[sig, targ],
        cids=cidx,
        freq="M",
        blacklist=fxblack,
        lag=1,
        xcat_aggs=["last", "sum"],
        start="2000-01-01",

    )
cr.reg_scatter(coef_box="upper left", prob_est="map")


srr = mss.SignalReturnRelations(
    dfx,
    cids=cidx,
    sigs=sig,
    rets=targ,
    freqs="M",
    start="2000-01-01",
    blacklist=fxblack,
)
display(srr.multiple_relations_table().round(3))
| accuracy | bal_accuracy | pos_sigr | pos_retr | pos_prec | neg_prec | pearson | pearson_pval | kendall | kendall_pval | auc | ||||
|---|---|---|---|---|---|---|---|---|---|---|---|---|---|---|
| Return | Signal | Frequency | Aggregation | |||||||||||
| LCBIXRUSD_VT10 | RGDP_ZN | M | last | 0.525 | 0.51 | 0.626 | 0.565 | 0.572 | 0.447 | 0.029 | 0.075 | 0.022 | 0.039 | 0.509 |
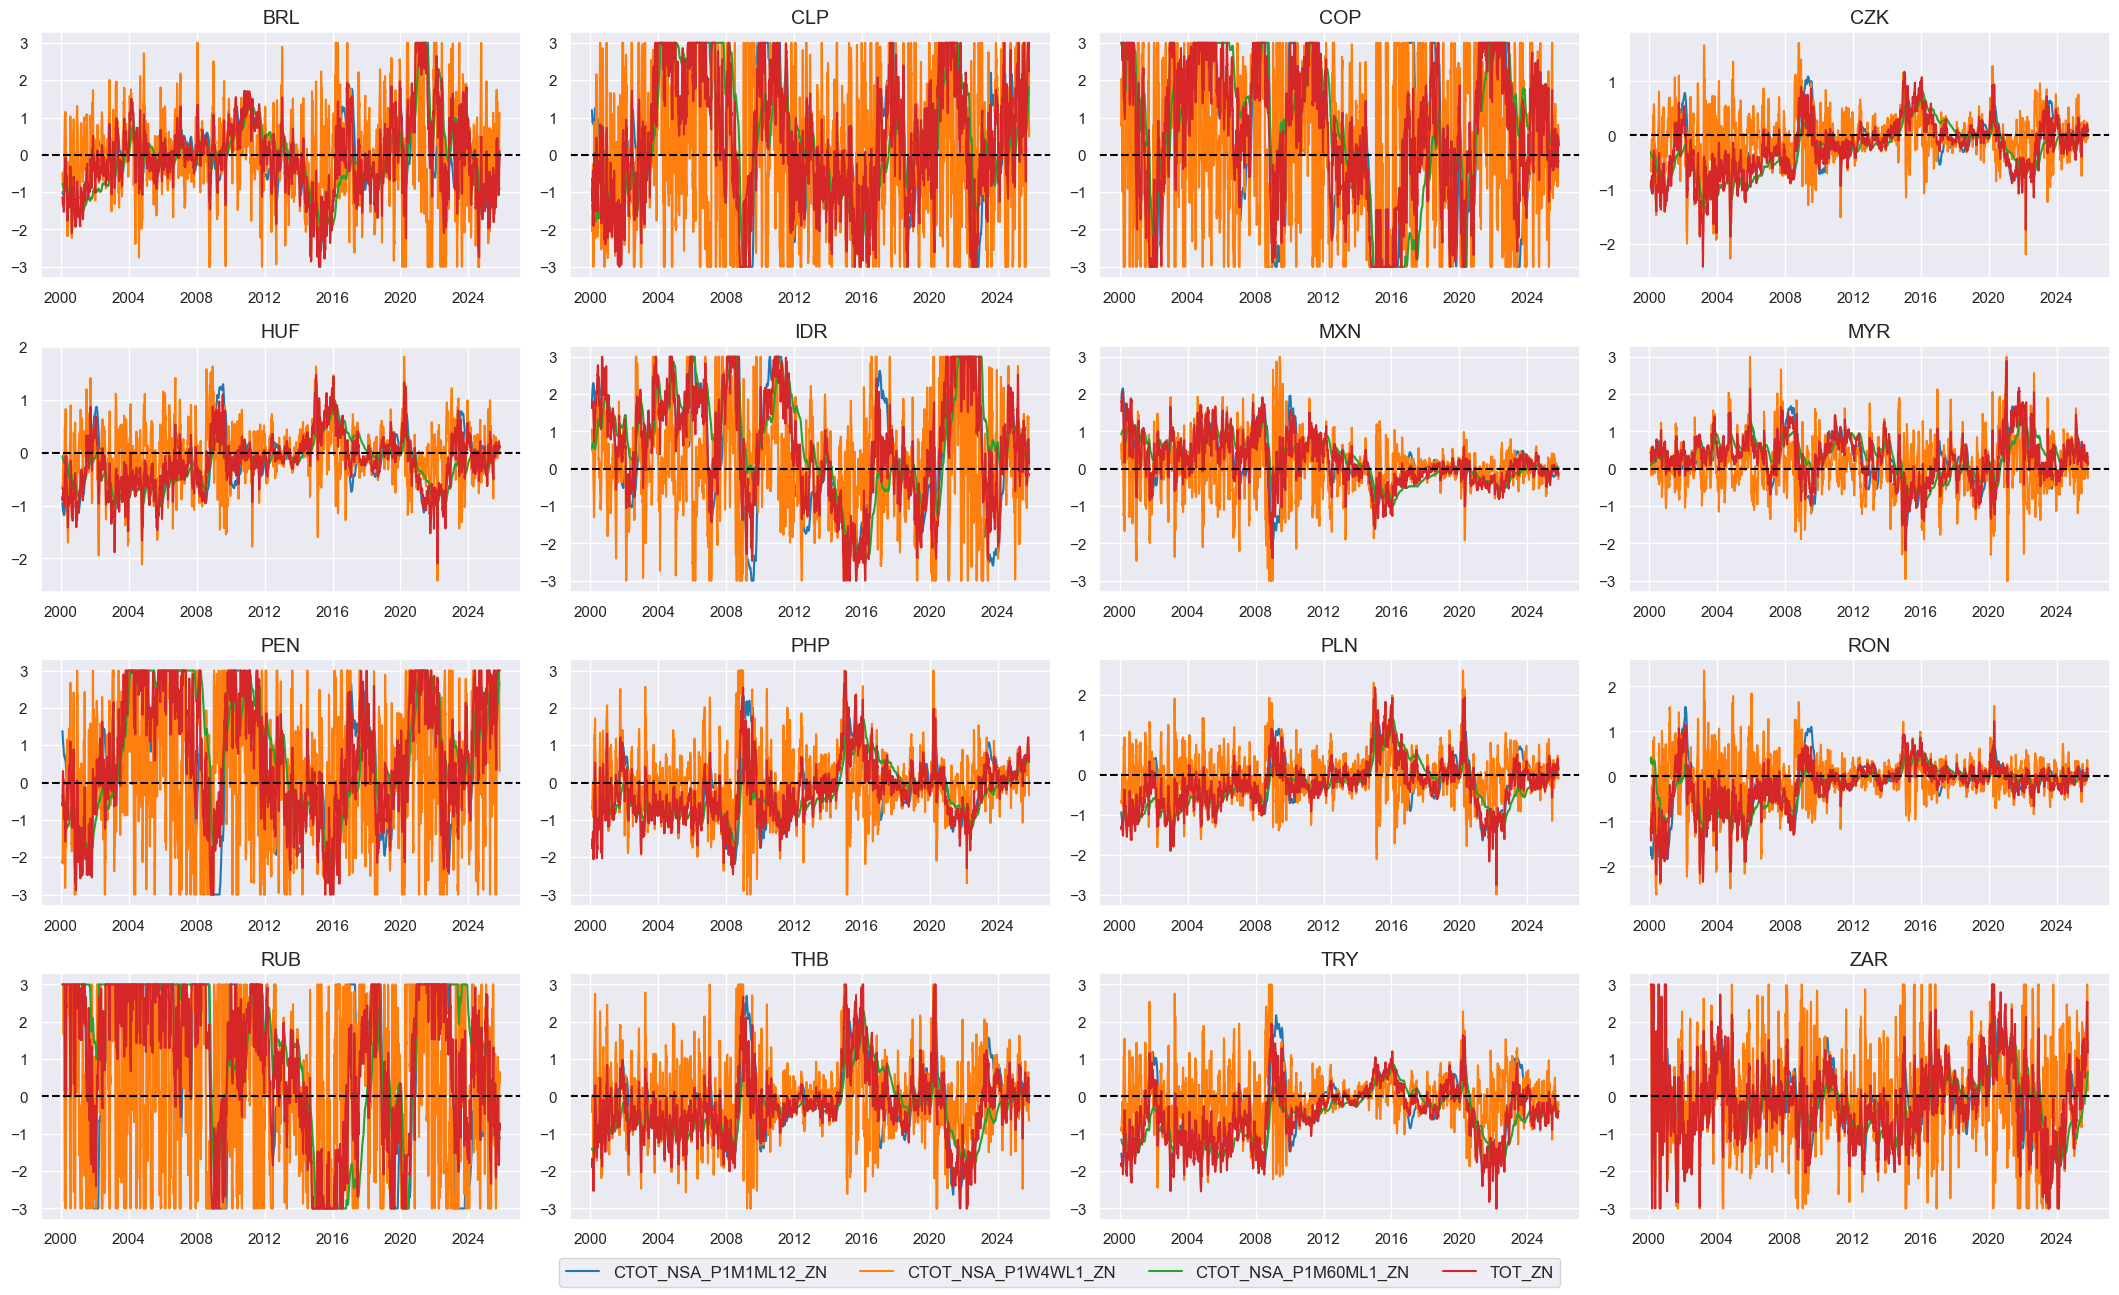
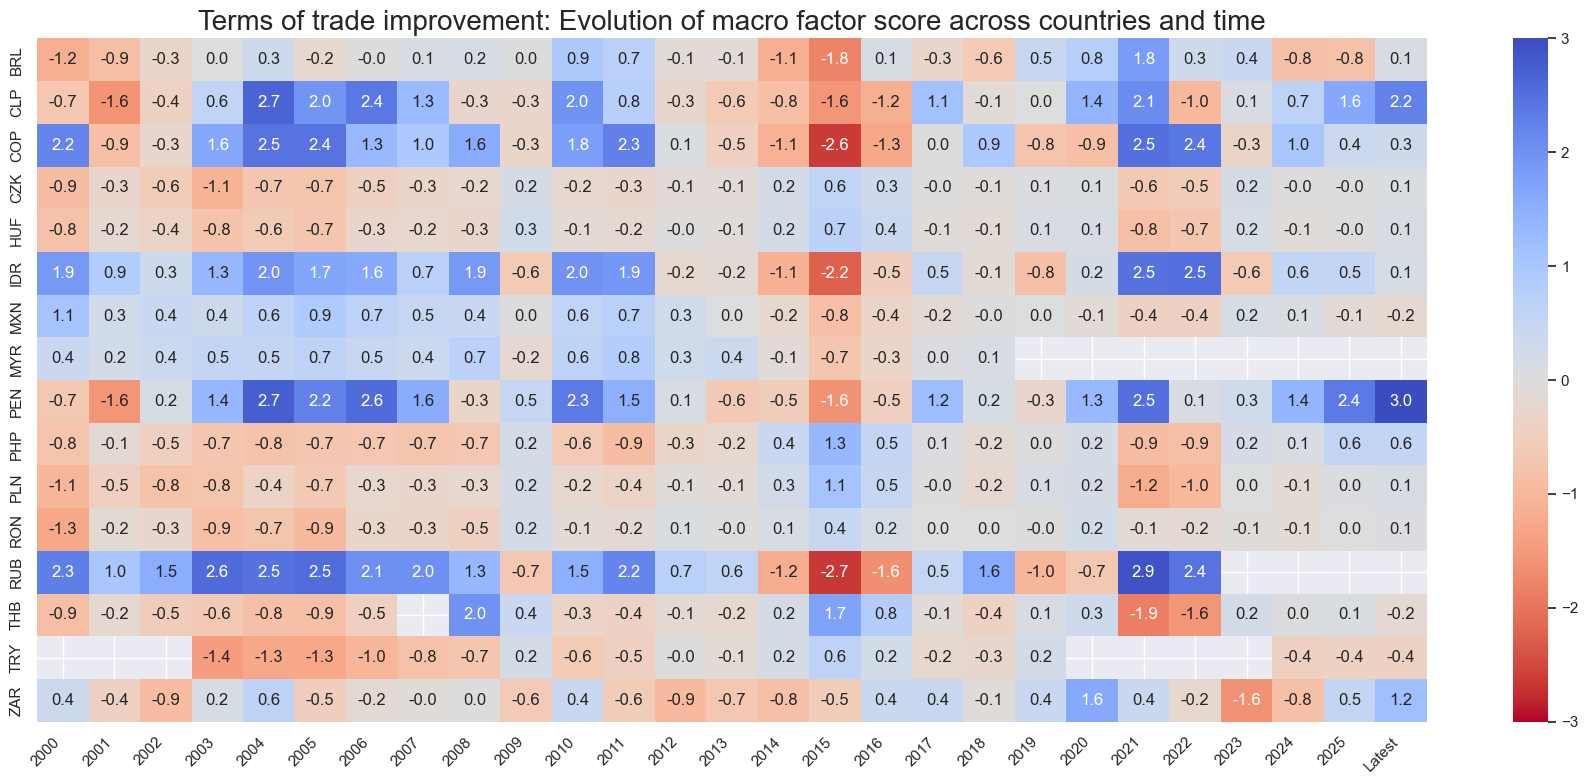
Terms-of-trade improvement #
# All constituents, signs, and weights

dict_tot = {
    "CTOT_NSA_P1M1ML12": {"sign": 1, "weight": 1/3},
    "CTOT_NSA_P1W4WL1": {"sign": 1, "weight": 1/3},
    "CTOT_NSA_P1M60ML1": {"sign": 1, "weight": 1/3},
}
# Normalized categories with theoretical positive effects

dix = dict_tot
cidx = cids_em

# Contingent negative values

if any (v["sign"] < 0 for v in dix.values()):
    calcs=[]
    dfa = pd.DataFrame(columns=dfx.columns)
    for xc, values in dix.items():
        if values["sign"] < 0:
            calcs.append(f"{xc}NEG = {xc} * -1")
            dfa = msp.panel_calculator(dfx, calcs=calcs, cids=cidx)
    dfx = msm.update_df(dfx, dfa)

# Sequential normalization of categories

postfixes = ["NEG" if v["sign"] < 0 else "" for v in dix.values()]
xcatx = [k + pf for k, pf in zip(dix.keys(), postfixes)]

for xc in xcatx:
    dfa = msp.make_zn_scores(
        dfx,
        xcat=xc,
        cids=cidx,
        sequential=True,
        min_obs=261 * 3,
        neutral="zero",
        pan_weight=1,
        thresh=3,
        postfix="_ZN",
        est_freq="m",
    )
    dfx = msm.update_df(dfx, dfa)

totz = [xc + "_ZN" for xc in xcatx]
# Conceptual factor score

dix = dict_tot
xcatx = totz
cidx = cids_em

# Composite score

weights = [v["weight"] for v in dix.values()]
cfs = "TOT"

dfa = msp.linear_composite(
    df=dfx,
    xcats=xcatx,
    cids=cidx,
    weights=weights,
    new_xcat=cfs,
    complete_xcats=False,
)
dfx= msm.update_df(dfx, dfa)

# Re-score

dfa = msp.make_zn_scores(
    dfx,
    xcat=cfs,
    cids=cidx,
    sequential=True,
    min_obs=261 * 3,
    neutral="zero",
    pan_weight=1,
    thresh=3,
    postfix="_ZN",
    est_freq="m",
)
dfx = msm.update_df(dfx, dfa)

cfs_zn = f"{cfs}_ZN"
concept_factors_zn[cfs_zn] = "Terms of trade improvement"
# Visualize

xcatx = totz + ["TOT_ZN"]
cidx = cids_em

msp.view_timelines(
    dfx,
    xcats=xcatx,
    cids=cidx,
    ncol=4,
    start="2000-01-01",
    same_y=False,
    height=2.2,
    size=(10, 10),
    all_xticks=True,
)
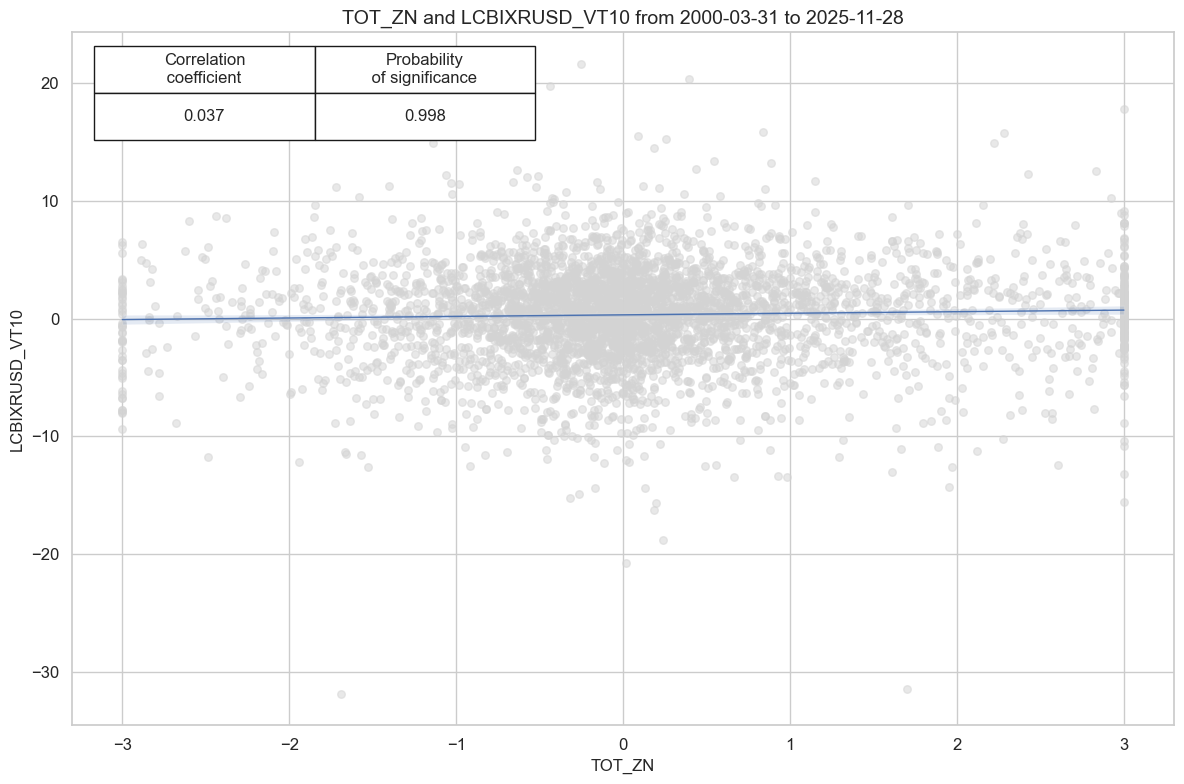
# checking - to delete later
cidx = cids_em
sig = "TOT_ZN"
targ = "LCBIXRUSD_VT10"

cr = msp.CategoryRelations(
        dfx,
        xcats=[sig, targ],
        cids=cidx,
        freq="M",
        blacklist=fxblack,
        lag=1,
        xcat_aggs=["last", "sum"],
        start="2000-01-01",

    )
cr.reg_scatter(coef_box="upper left", prob_est="map")


srr = mss.SignalReturnRelations(
    dfx,
    cids=cidx,
    sigs=sig,
    rets=targ,
    freqs="M",
    start="2000-01-01",
    blacklist=fxblack,
)
display(srr.multiple_relations_table().round(3))
| accuracy | bal_accuracy | pos_sigr | pos_retr | pos_prec | neg_prec | pearson | pearson_pval | kendall | kendall_pval | auc | ||||
|---|---|---|---|---|---|---|---|---|---|---|---|---|---|---|
| Return | Signal | Frequency | Aggregation | |||||||||||
| LCBIXRUSD_VT10 | TOT_ZN | M | last | 0.515 | 0.517 | 0.486 | 0.568 | 0.586 | 0.449 | 0.037 | 0.02 | 0.027 | 0.012 | 0.518 |
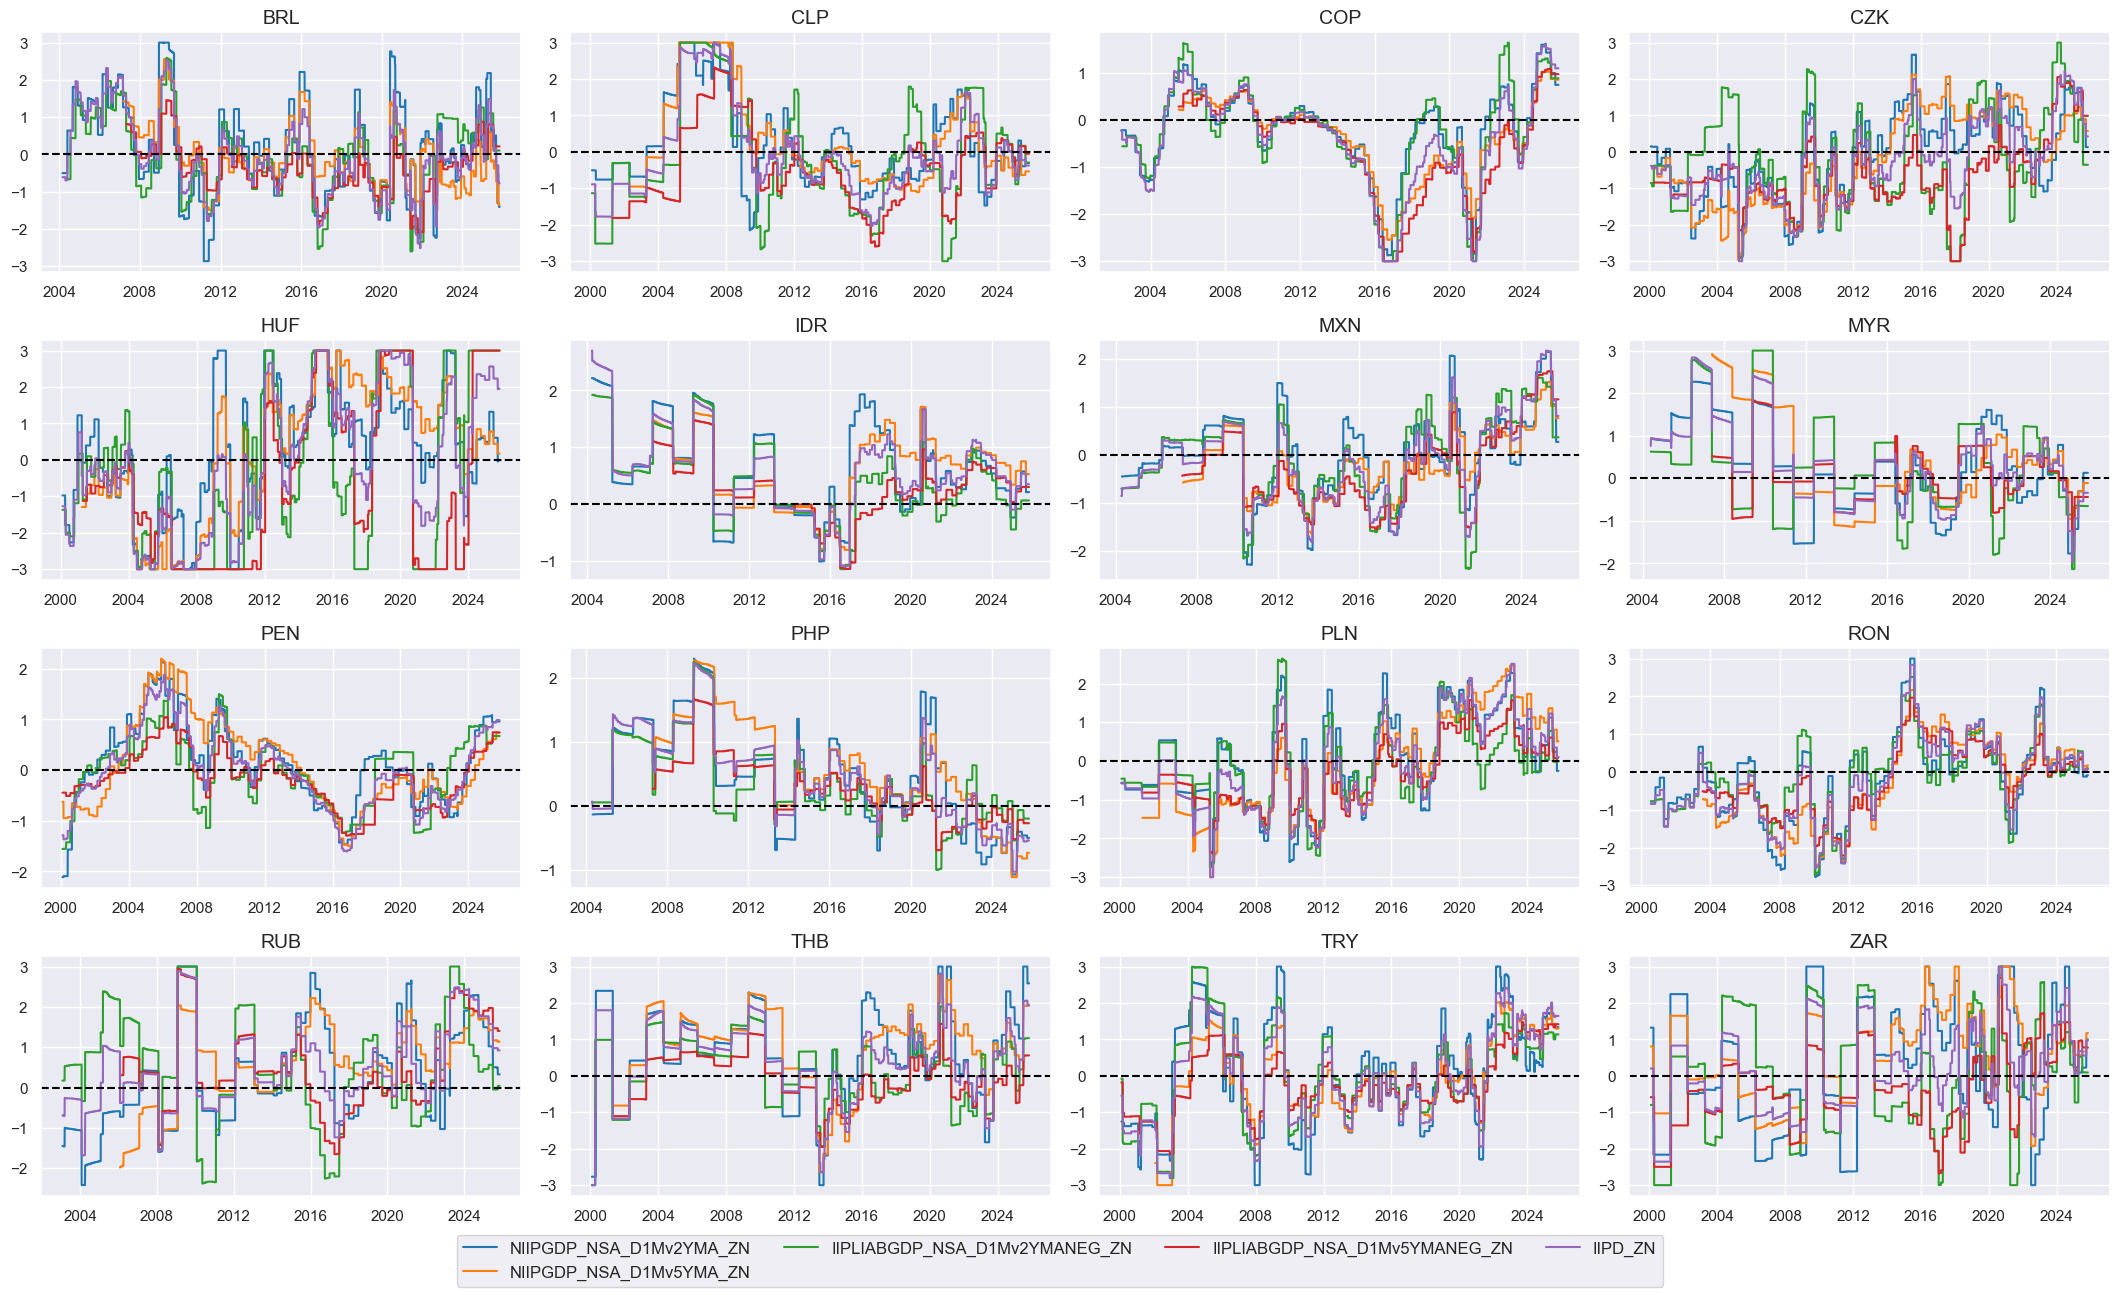
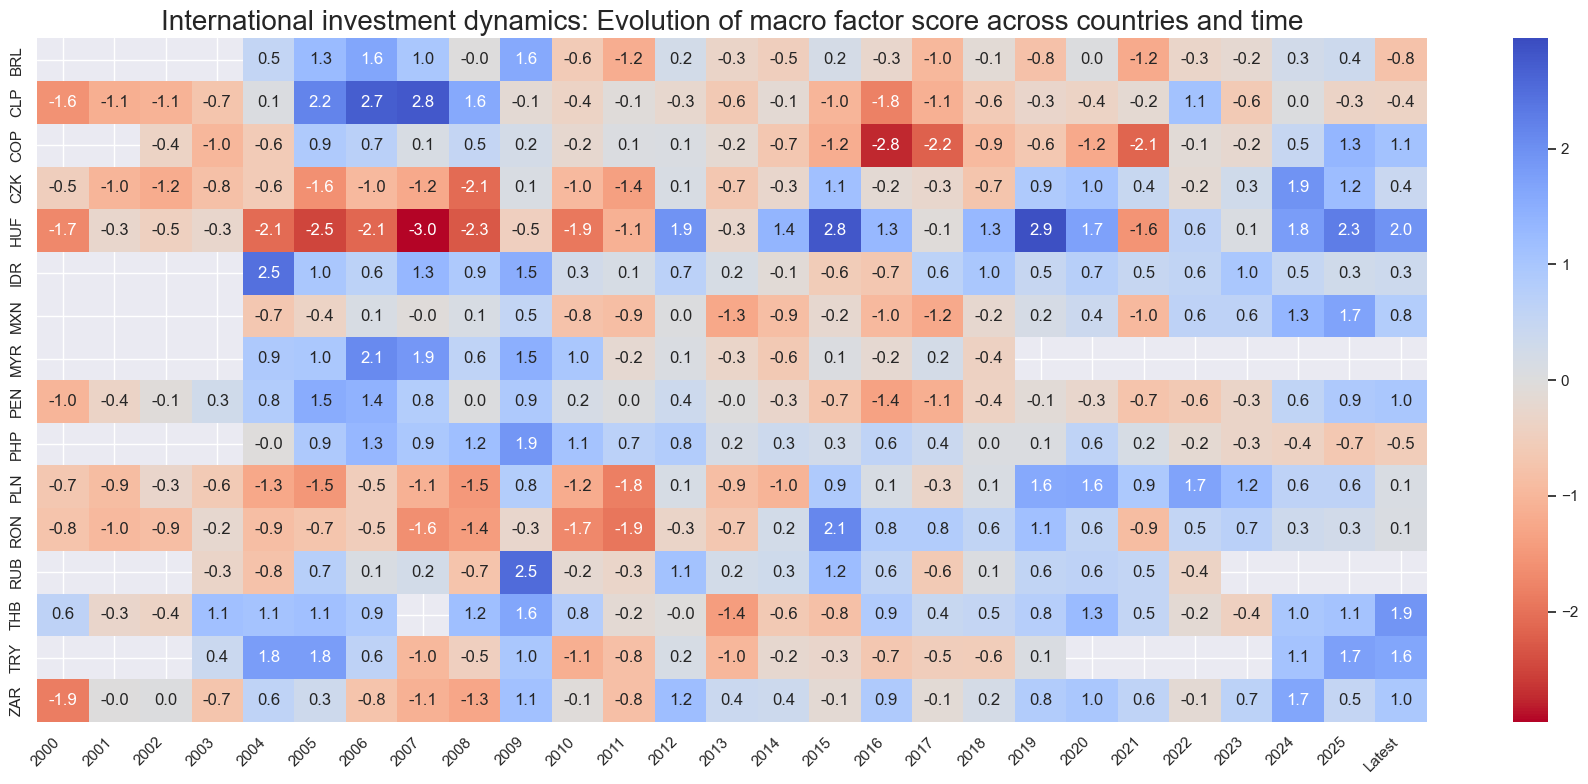
International investment dynamics #
# All constituents, signs, and weights

dict_iipd = {
    'NIIPGDP_NSA_D1Mv2YMA': {"sign": 1, "weight": 1/4},
    'NIIPGDP_NSA_D1Mv5YMA': {"sign": 1, "weight": 1/4},
    'IIPLIABGDP_NSA_D1Mv2YMA': {"sign": -1, "weight": 1/4},
    'IIPLIABGDP_NSA_D1Mv5YMA': {"sign": -1, "weight": 1/4},
}
# Normalized categories with theoretical positive effects

dix = dict_iipd
cidx = cids_em

# Contingent negative values

if any (v["sign"] < 0 for v in dix.values()):
    calcs=[]
    dfa = pd.DataFrame(columns=dfx.columns)
    for xc, values in dix.items():
        if values["sign"] < 0:
            calcs.append(f"{xc}NEG = {xc} * -1")
            dfa = msp.panel_calculator(dfx, calcs=calcs, cids=cidx)
    dfx = msm.update_df(dfx, dfa)

# Sequential normalization of categories

postfixes = ["NEG" if v["sign"] < 0 else "" for v in dix.values()]
xcatx = [k + pf for k, pf in zip(dix.keys(), postfixes)]

for xc in xcatx:
    dfa = msp.make_zn_scores(
        dfx,
        xcat=xc,
        cids=cidx,
        sequential=True,
        min_obs=261 * 3,
        neutral="zero",
        pan_weight=1,
        thresh=3,
        postfix="_ZN",
        est_freq="m",
    )
    dfx = msm.update_df(dfx, dfa)

iipdz = [xc + "_ZN" for xc in xcatx]
# Conceptual factor score

dix = dict_iipd
xcatx = iipdz
cidx = cids_em

# Composite score

weights = [v["weight"] for v in dix.values()]
cfs = "IIPD"

dfa = msp.linear_composite(
    df=dfx,
    xcats=xcatx,
    cids=cidx,
    weights=weights,
    new_xcat=cfs,
    complete_xcats=False,
)
dfx= msm.update_df(dfx, dfa)

# Re-score

dfa = msp.make_zn_scores(
    dfx,
    xcat=cfs,
    cids=cidx,
    sequential=True,
    min_obs=261 * 3,
    neutral="zero",
    pan_weight=1,
    thresh=3,
    postfix="_ZN",
    est_freq="m",
)
dfx = msm.update_df(dfx, dfa)

cfs_zn = f"{cfs}_ZN"
concept_factors_zn[cfs_zn] = "International investment dynamics"
# Visualize

xcatx = iipdz + ["IIPD_ZN"]
cidx = cids_em

msp.view_timelines(
    dfx,
    xcats=xcatx,
    cids=cidx,
    ncol=4,
    start="2000-01-01",
    same_y=False,
    height=2.2,
    size=(10, 10),
    all_xticks=True,
)
# checking - to delete later
cidx = cids_em
sig = "IIPD_ZN"
targ = "LCBIXRUSD_VT10"

cr = msp.CategoryRelations(
        dfx,
        xcats=[sig, targ],
        cids=cidx,
        freq="M",
        blacklist=fxblack,
        lag=1,
        xcat_aggs=["last", "sum"],
        start="2000-01-01",
       # xcat_trims=[10, 10]  # maybe trim outlier
    )
cr.reg_scatter(coef_box="upper left", prob_est="map")


srr = mss.SignalReturnRelations(
    dfx,
    cids=cidx,
    sigs=sig,
    rets=targ,
    freqs="M",
    start="2000-01-01",
    blacklist=fxblack,
)
display(srr.multiple_relations_table().round(3))
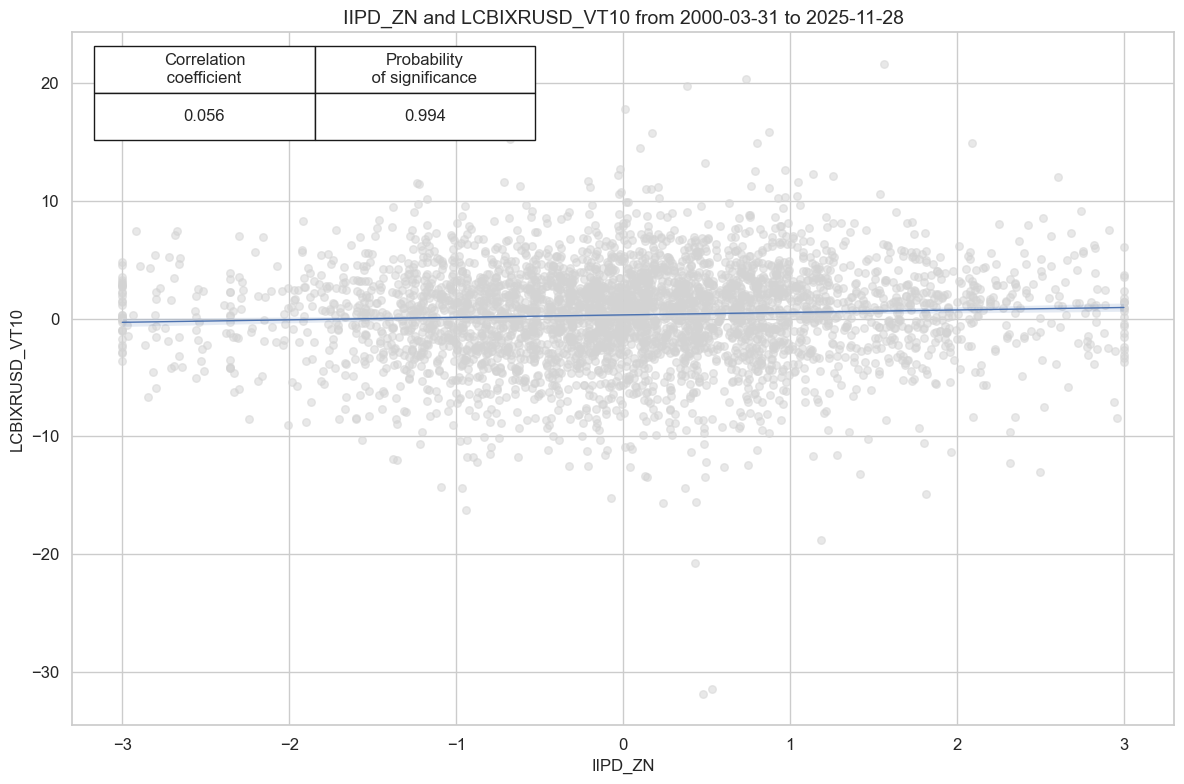
| accuracy | bal_accuracy | pos_sigr | pos_retr | pos_prec | neg_prec | pearson | pearson_pval | kendall | kendall_pval | auc | ||||
|---|---|---|---|---|---|---|---|---|---|---|---|---|---|---|
| Return | Signal | Frequency | Aggregation | |||||||||||
| LCBIXRUSD_VT10 | IIPD_ZN | M | last | 0.538 | 0.536 | 0.514 | 0.567 | 0.602 | 0.47 | 0.056 | 0.0 | 0.046 | 0.0 | 0.536 |
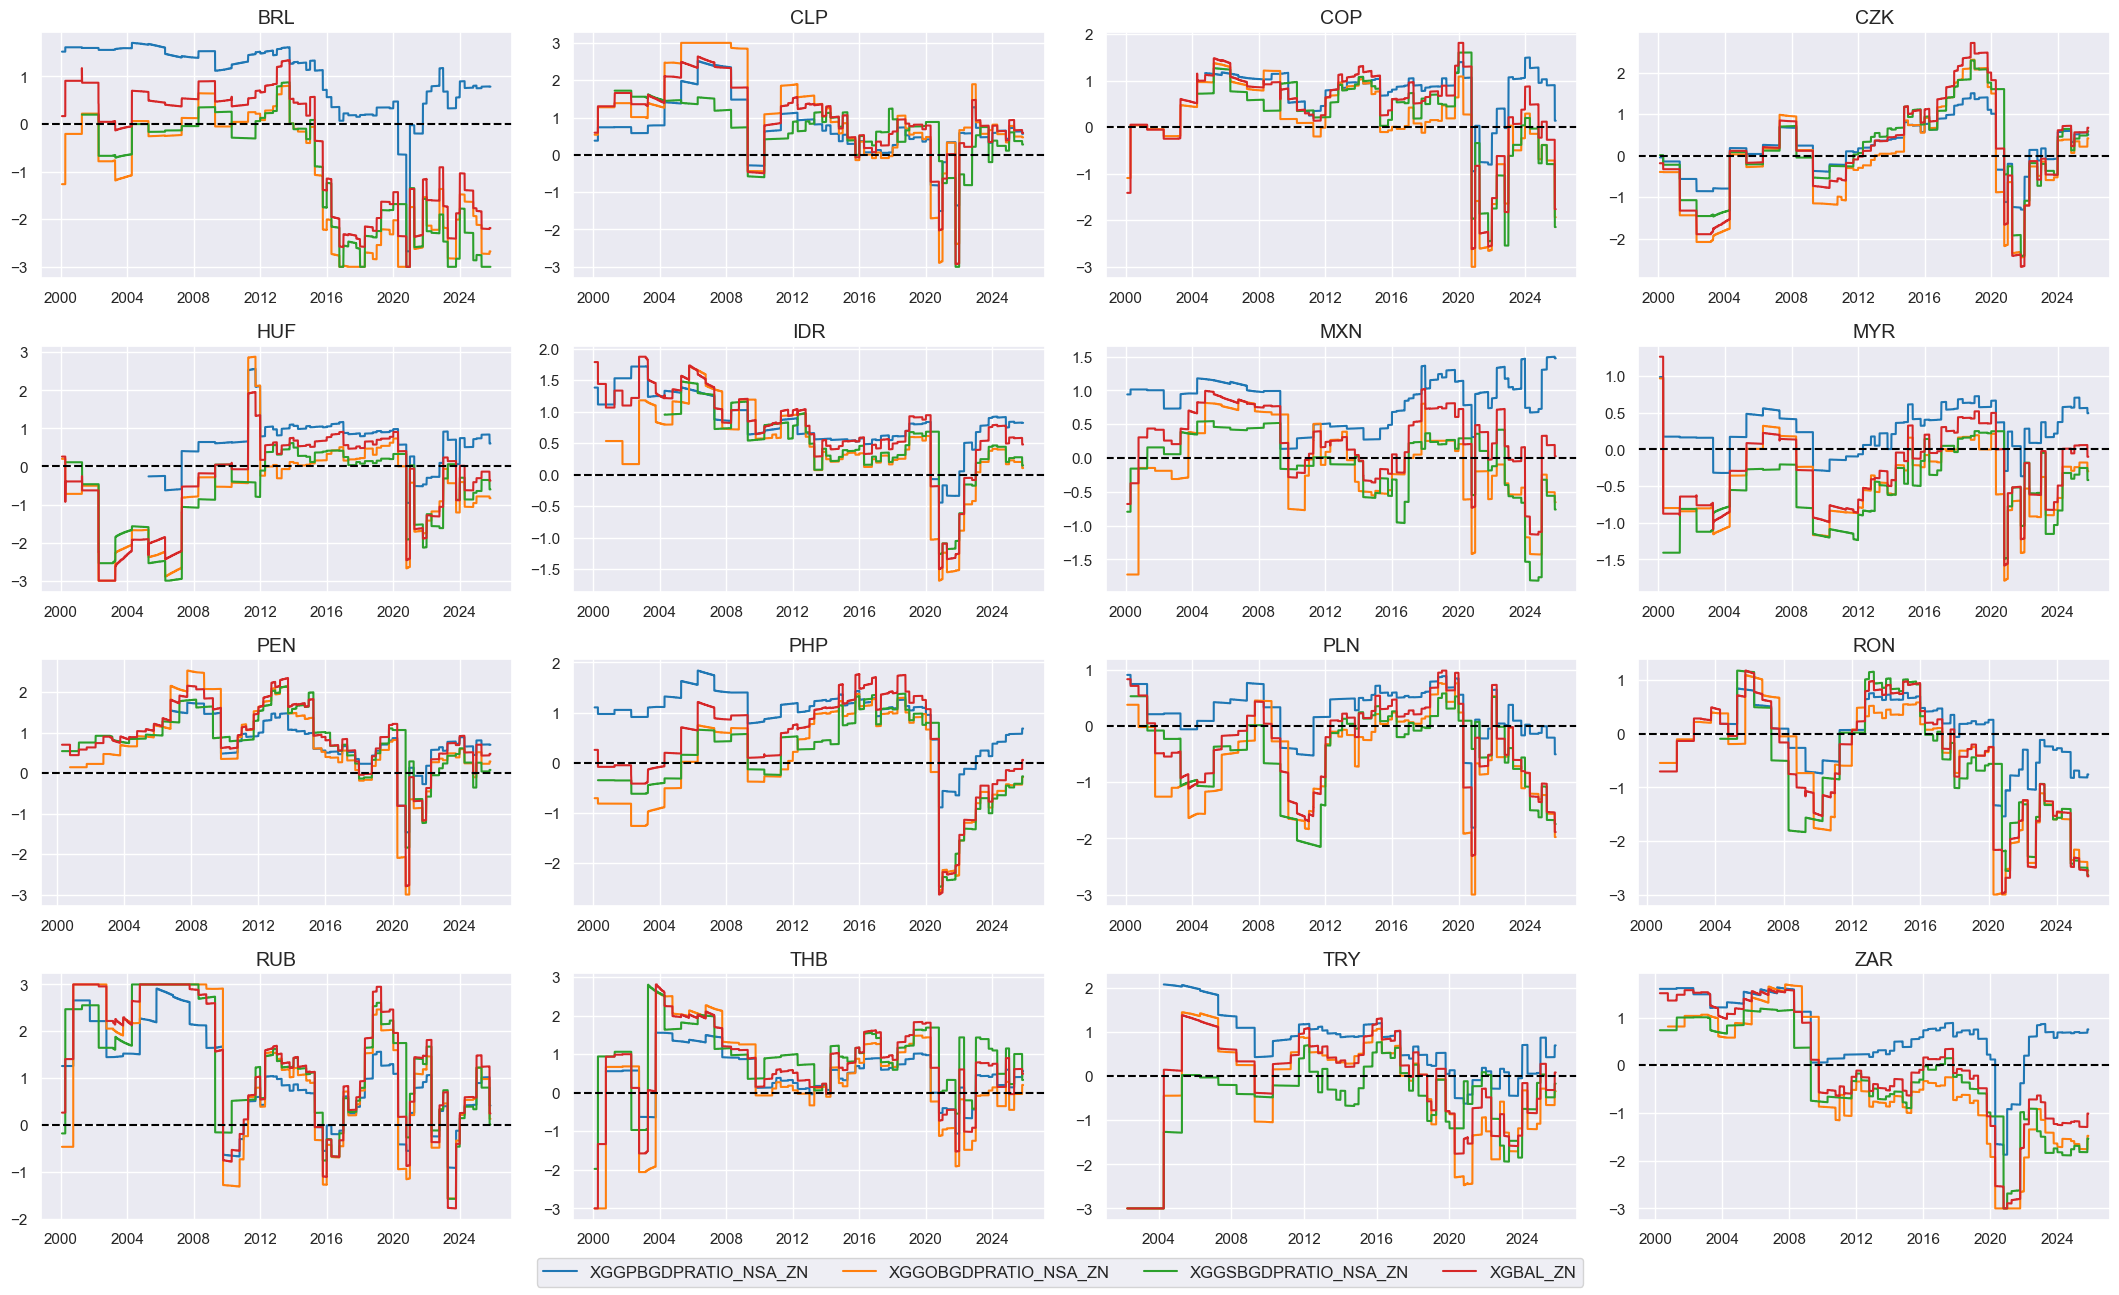
Fiscal balance strength #
# Preparatory calculation

calcs = [
    "XGGPBGDPRATIO_NSA = GGPBGDPRATIO_NSA + 3",
    "XGGOBGDPRATIO_NSA = GGOBGDPRATIO_NSA + 3",
    "XGGSBGDPRATIO_NSA = GGSBGDPRATIO_NSA + 3",
]
dfa = msp.panel_calculator(dfx, calcs=calcs, cids=cids_em)
dfx = msm.update_df(dfx, dfa)
# All constituents, signs, and weights

dict_gbal = {
    'XGGPBGDPRATIO_NSA': {"sign": 1, "weight": 1/3},
    'XGGOBGDPRATIO_NSA': {"sign": 1, "weight": 1/3},
    'XGGSBGDPRATIO_NSA': {"sign": 1, "weight": 1/3},
}
# Normalized categories with theoretical positive effects

dix = dict_gbal
cidx = cids_em

# Contingent negative values

if any (v["sign"] < 0 for v in dix.values()):
    calcs=[]
    dfa = pd.DataFrame(columns=dfx.columns)
    for xc, values in dix.items():
        if values["sign"] < 0:
            calcs.append(f"{xc}NEG = {xc} * -1")
            dfa = msp.panel_calculator(dfx, calcs=calcs, cids=cidx)
    dfx = msm.update_df(dfx, dfa)

# Sequential normalization of categories

postfixes = ["NEG" if v["sign"] < 0 else "" for v in dix.values()]
xcatx = [k + pf for k, pf in zip(dix.keys(), postfixes)]

for xc in xcatx:
    dfa = msp.make_zn_scores(
        dfx,
        xcat=xc,
        cids=cidx,
        sequential=True,
        min_obs=261 * 3,
        neutral="zero",
        pan_weight=1,
        thresh=3,
        postfix="_ZN",
        est_freq="m",
    )
    dfx = msm.update_df(dfx, dfa)

xgbalz = [xc + "_ZN" for xc in xcatx]
# Conceptual factor score

dix = dict_gbal
xcatx = xgbalz
cidx = cids_em

# Composite score

weights = [v["weight"] for v in dix.values()]
cfs = "XGBAL"

dfa = msp.linear_composite(
    df=dfx,
    xcats=xcatx,
    cids=cidx,
    weights=weights,
    new_xcat=cfs,
    complete_xcats=False,
)
dfx= msm.update_df(dfx, dfa)

# Re-score

dfa = msp.make_zn_scores(
    dfx,
    xcat=cfs,
    cids=cidx,
    sequential=True,
    min_obs=261 * 3,
    neutral="zero",
    pan_weight=1,
    thresh=3,
    postfix="_ZN",
    est_freq="m",
)
dfx = msm.update_df(dfx, dfa)

cfs_zn = f"{cfs}_ZN"
concept_factors_zn[cfs_zn] = "Fiscal balance strength"
# Visualize

xcatx = xgbalz + ["XGBAL_ZN"]
cidx = cids_em

msp.view_timelines(
    dfx,
    xcats=xcatx,
    cids=cidx,
    ncol=4,
    start="2000-01-01",
    same_y=False,
    height=2.2,
    size=(10, 10),
    all_xticks=True,
)
# checking - to delete later
cidx = cids_em
sig = "XGBAL_ZN"
targ = "LCBIXRUSD_VT10"

cr = msp.CategoryRelations(
        dfx,
        xcats=[sig, targ],
        cids=cidx,
        freq="M",
        blacklist=fxblack,
        lag=1,
        xcat_aggs=["last", "sum"],
        start="2000-01-01",
       # xcat_trims=[10, 10]  # maybe trim outlier
    )
cr.reg_scatter(coef_box="upper left", prob_est="map")


srr = mss.SignalReturnRelations(
    dfx,
    cids=cidx,
    sigs=sig,
    rets=targ,
    freqs="M",
    start="2000-01-01",
    blacklist=fxblack,
)
display(srr.multiple_relations_table().round(3))
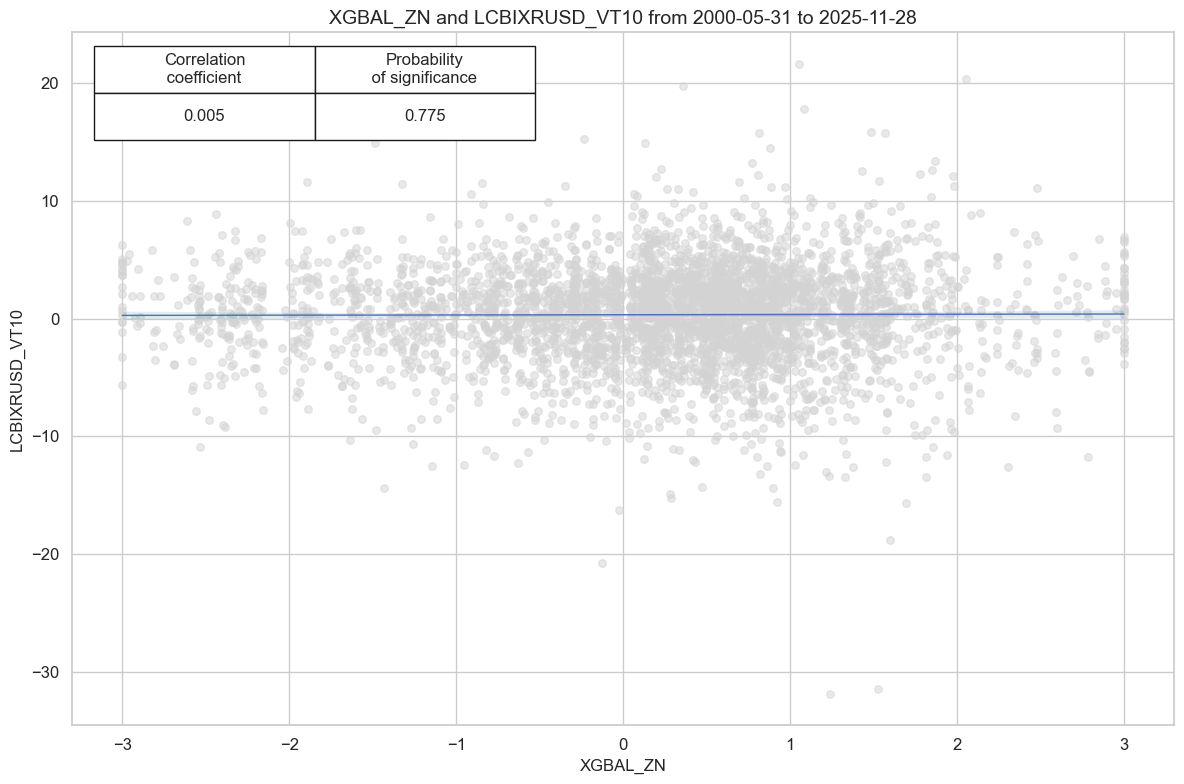
| accuracy | bal_accuracy | pos_sigr | pos_retr | pos_prec | neg_prec | pearson | pearson_pval | kendall | kendall_pval | auc | ||||
|---|---|---|---|---|---|---|---|---|---|---|---|---|---|---|
| Return | Signal | Frequency | Aggregation | |||||||||||
| LCBIXRUSD_VT10 | XGBAL_ZN | M | last | 0.532 | 0.513 | 0.651 | 0.568 | 0.577 | 0.449 | 0.005 | 0.744 | 0.01 | 0.348 | 0.512 |
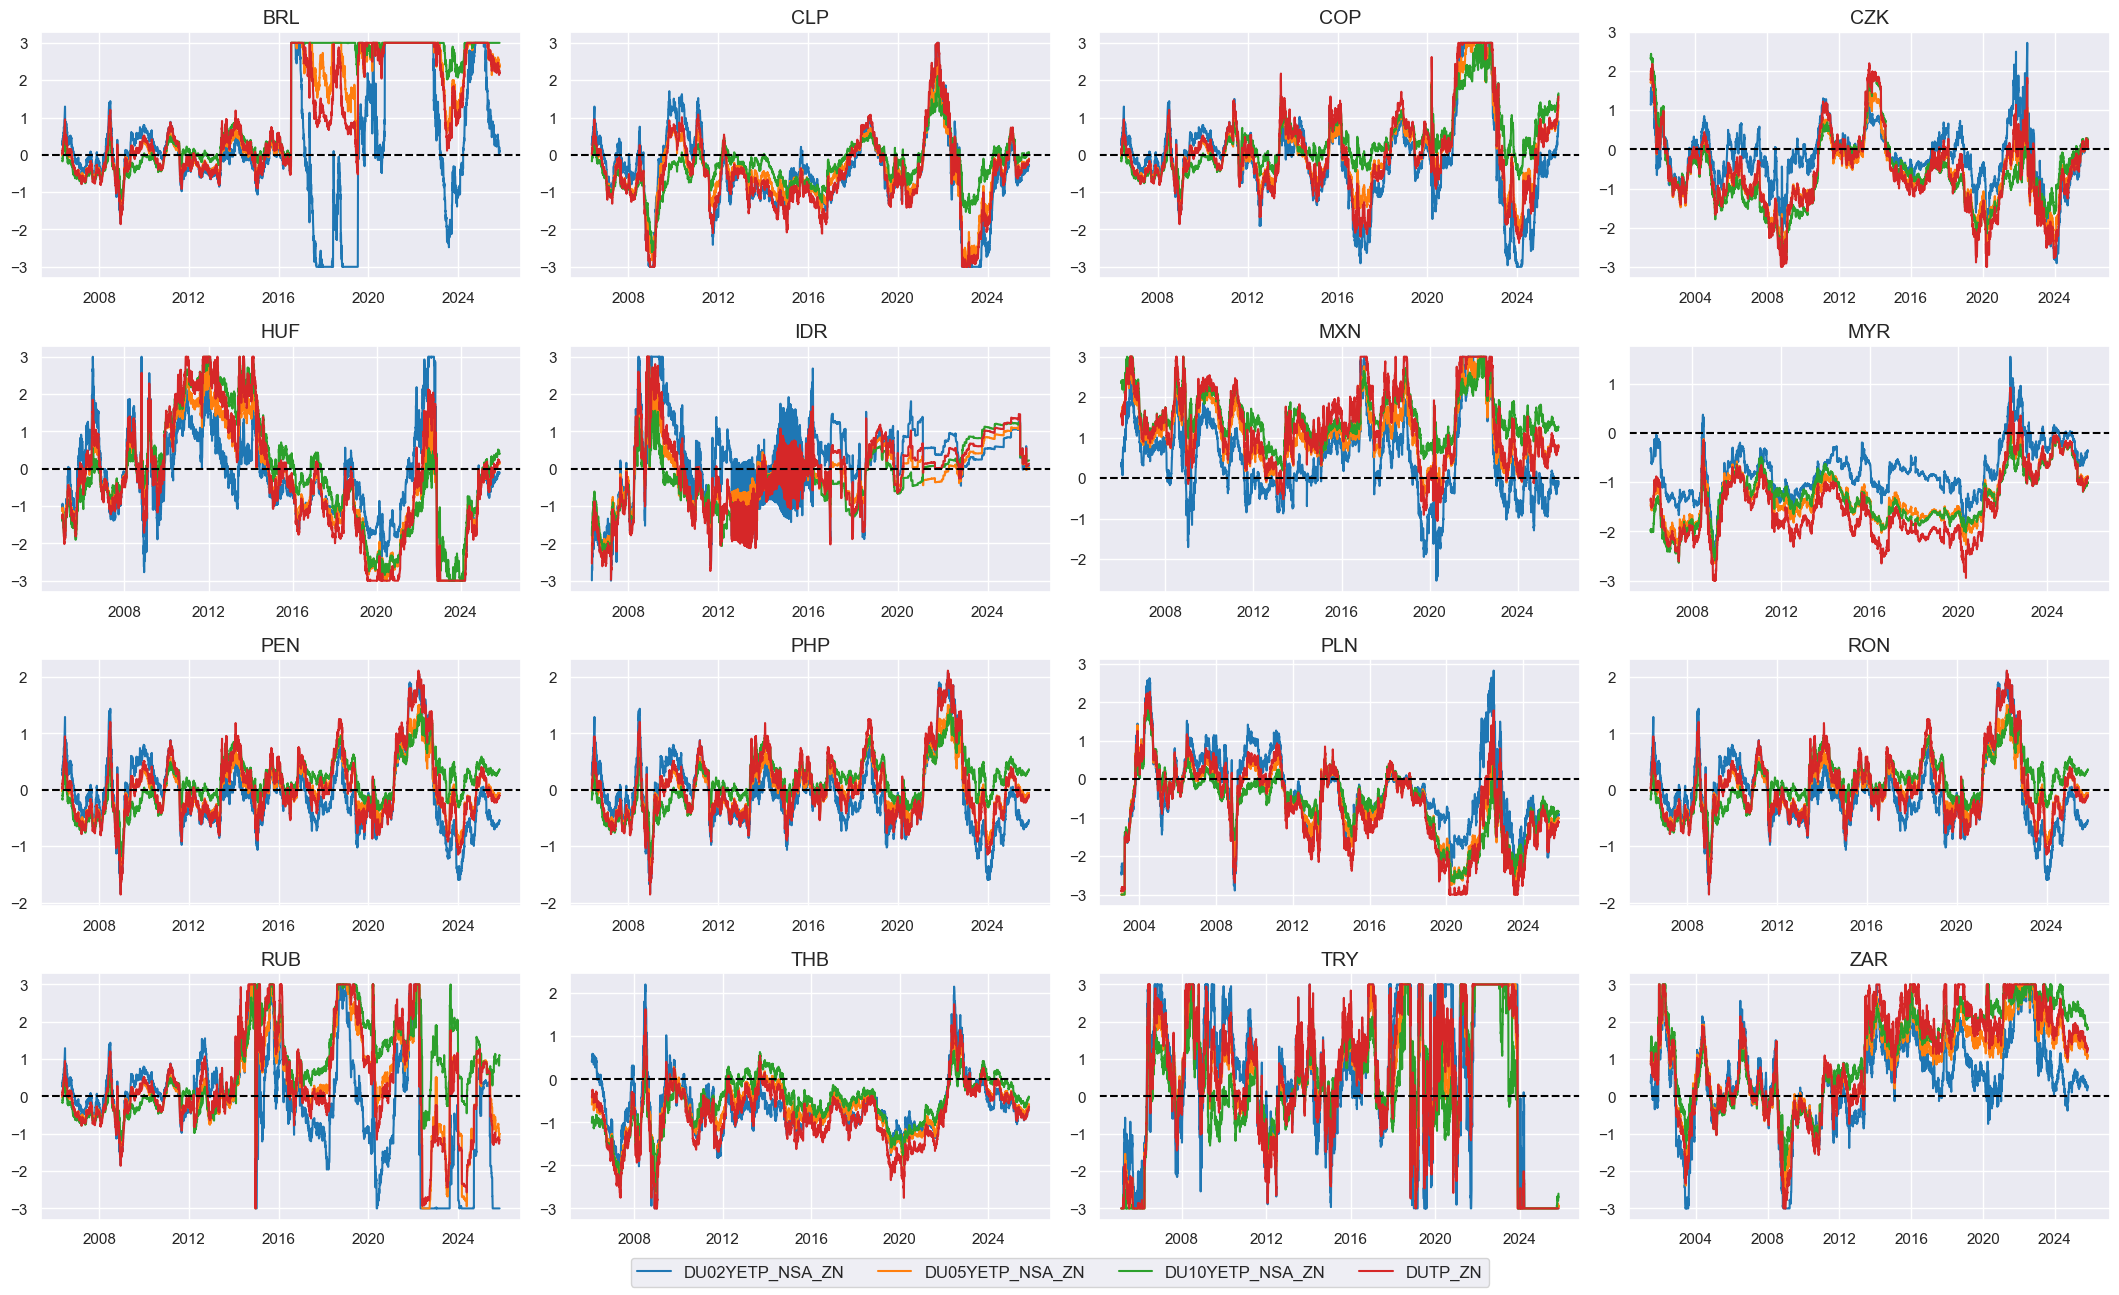
Duration term premia #
# All constituents, signs, and weights

dict_dutp = {
    "DU02YETP_NSA": {"sign": 1, "weight": 1/3},
    "DU05YETP_NSA": {"sign": 1, "weight": 1/3},
    "DU10YETP_NSA": {"sign": 1, "weight": 1/3},
}
# Normalized categories with theoretical positive effects

dix = dict_dutp
cidx = cids_em

# Contingent negative values

if any (v["sign"] < 0 for v in dix.values()):
    calcs=[]
    dfa = pd.DataFrame(columns=dfx.columns)
    for xc, values in dix.items():
        if values["sign"] < 0:
            calcs.append(f"{xc}NEG = {xc} * -1")
            dfa = msp.panel_calculator(dfx, calcs=calcs, cids=cidx)
    dfx = msm.update_df(dfx, dfa)

# Sequential normalization of categories

postfixes = ["NEG" if v["sign"] < 0 else "" for v in dix.values()]
xcatx = [k + pf for k, pf in zip(dix.keys(), postfixes)]

for xc in xcatx:
    dfa = msp.make_zn_scores(
        dfx,
        xcat=xc,
        cids=cidx,
        sequential=True,
        min_obs=261 * 3,
        neutral="median",  # zero is not neutral
        pan_weight=1,
        thresh=3,
        postfix="_ZN",
        est_freq="m",
    )
    dfx = msm.update_df(dfx, dfa)

dutpz = [xc + "_ZN" for xc in xcatx]
# Global imputation of missing premia

xcatx = ["DU02YETP_NSA_ZN", "DU05YETP_NSA_ZN", "DU10YETP_NSA_ZN"]
cidx = cids_em

dfi = msp.impute_panel(dfx, cids=cidx, xcats=xcatx, threshold=0.5)
dfx = msm.update_df(dfx, dfi)
# Conceptual factor score

dix = dict_dutp
xcatx = dutpz
cidx = cids_em

# Composite score

weights = [v["weight"] for v in dix.values()]
cfs = "DUTP"

dfa = msp.linear_composite(
    df=dfx,
    xcats=xcatx,
    cids=cidx,
    weights=weights,
    new_xcat=cfs,
    complete_xcats=False,
)
dfx= msm.update_df(dfx, dfa)

# Re-score

dfa = msp.make_zn_scores(
    dfx,
    xcat=cfs,
    cids=cidx,
    sequential=True,
    min_obs=261 * 3,
    neutral="zero",
    pan_weight=1,
    thresh=3,
    postfix="_ZN",
    est_freq="m",
)
dfx = msm.update_df(dfx, dfa)

cfs_zn = f"{cfs}_ZN"
concept_factors_zn[cfs_zn] = "Duration term premium"
# Visualize

xcatx = dutpz + ["DUTP_ZN"]
cidx = cids_em

msp.view_timelines(
    dfx,
    xcats=xcatx,
    cids=cidx,
    ncol=4,
    start="2000-01-01",
    same_y=False,
    height=2.2,
    size=(10, 10),
    all_xticks=True,
)
# checking - to delete later
cidx = cids_em
sig = "DUTP_ZN"
targ = "LCBIXRUSD_VT10"

cr = msp.CategoryRelations(
        dfx,
        xcats=[sig, targ],
        cids=cidx,
        freq="M",
        blacklist=fxblack,
        lag=1,
        xcat_aggs=["last", "sum"],
        start="2000-01-01",
       # xcat_trims=[10, 10]  # maybe trim outlier
    )
cr.reg_scatter(coef_box="upper left", prob_est="map")


srr = mss.SignalReturnRelations(
    dfx,
    cids=cidx,
    sigs=sig,
    rets=targ,
    freqs="M",
    start="2000-01-01",
    blacklist=fxblack,
)
display(srr.multiple_relations_table().round(3))
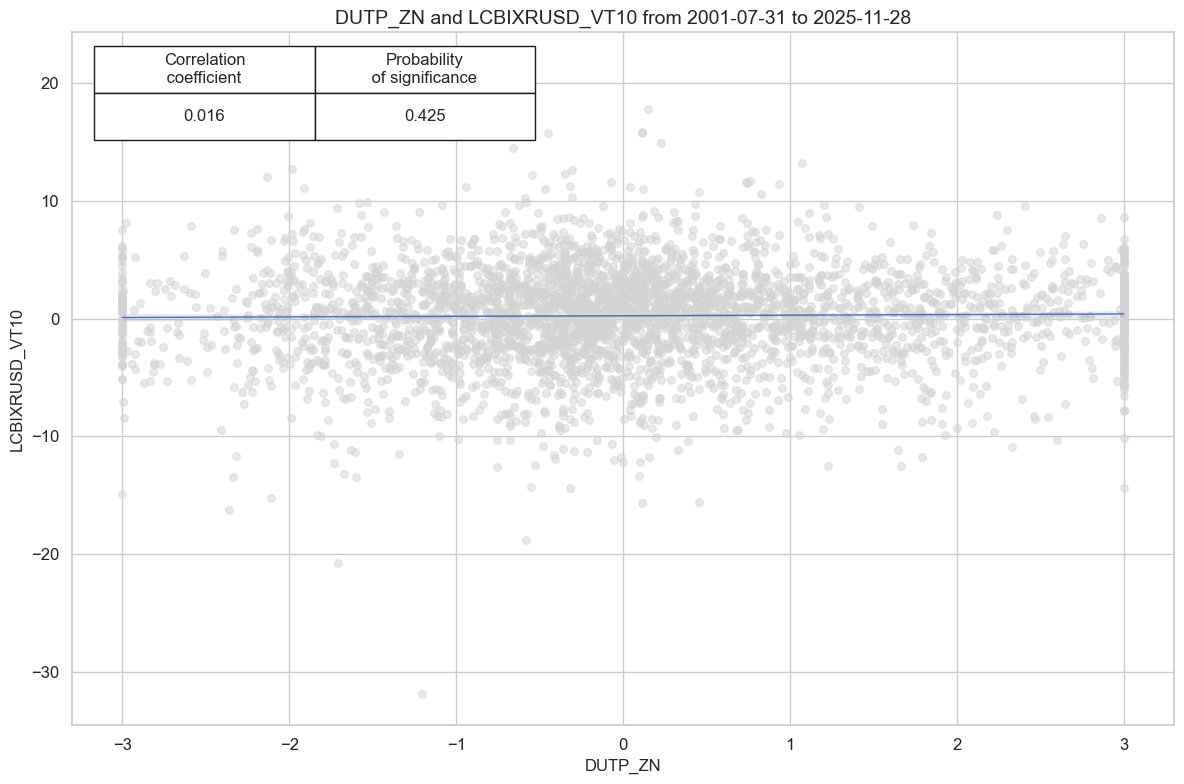
| accuracy | bal_accuracy | pos_sigr | pos_retr | pos_prec | neg_prec | pearson | pearson_pval | kendall | kendall_pval | auc | ||||
|---|---|---|---|---|---|---|---|---|---|---|---|---|---|---|
| Return | Signal | Frequency | Aggregation | |||||||||||
| LCBIXRUSD_VT10 | DUTP_ZN | M | last | 0.515 | 0.518 | 0.473 | 0.558 | 0.577 | 0.459 | 0.016 | 0.326 | 0.014 | 0.226 | 0.518 |
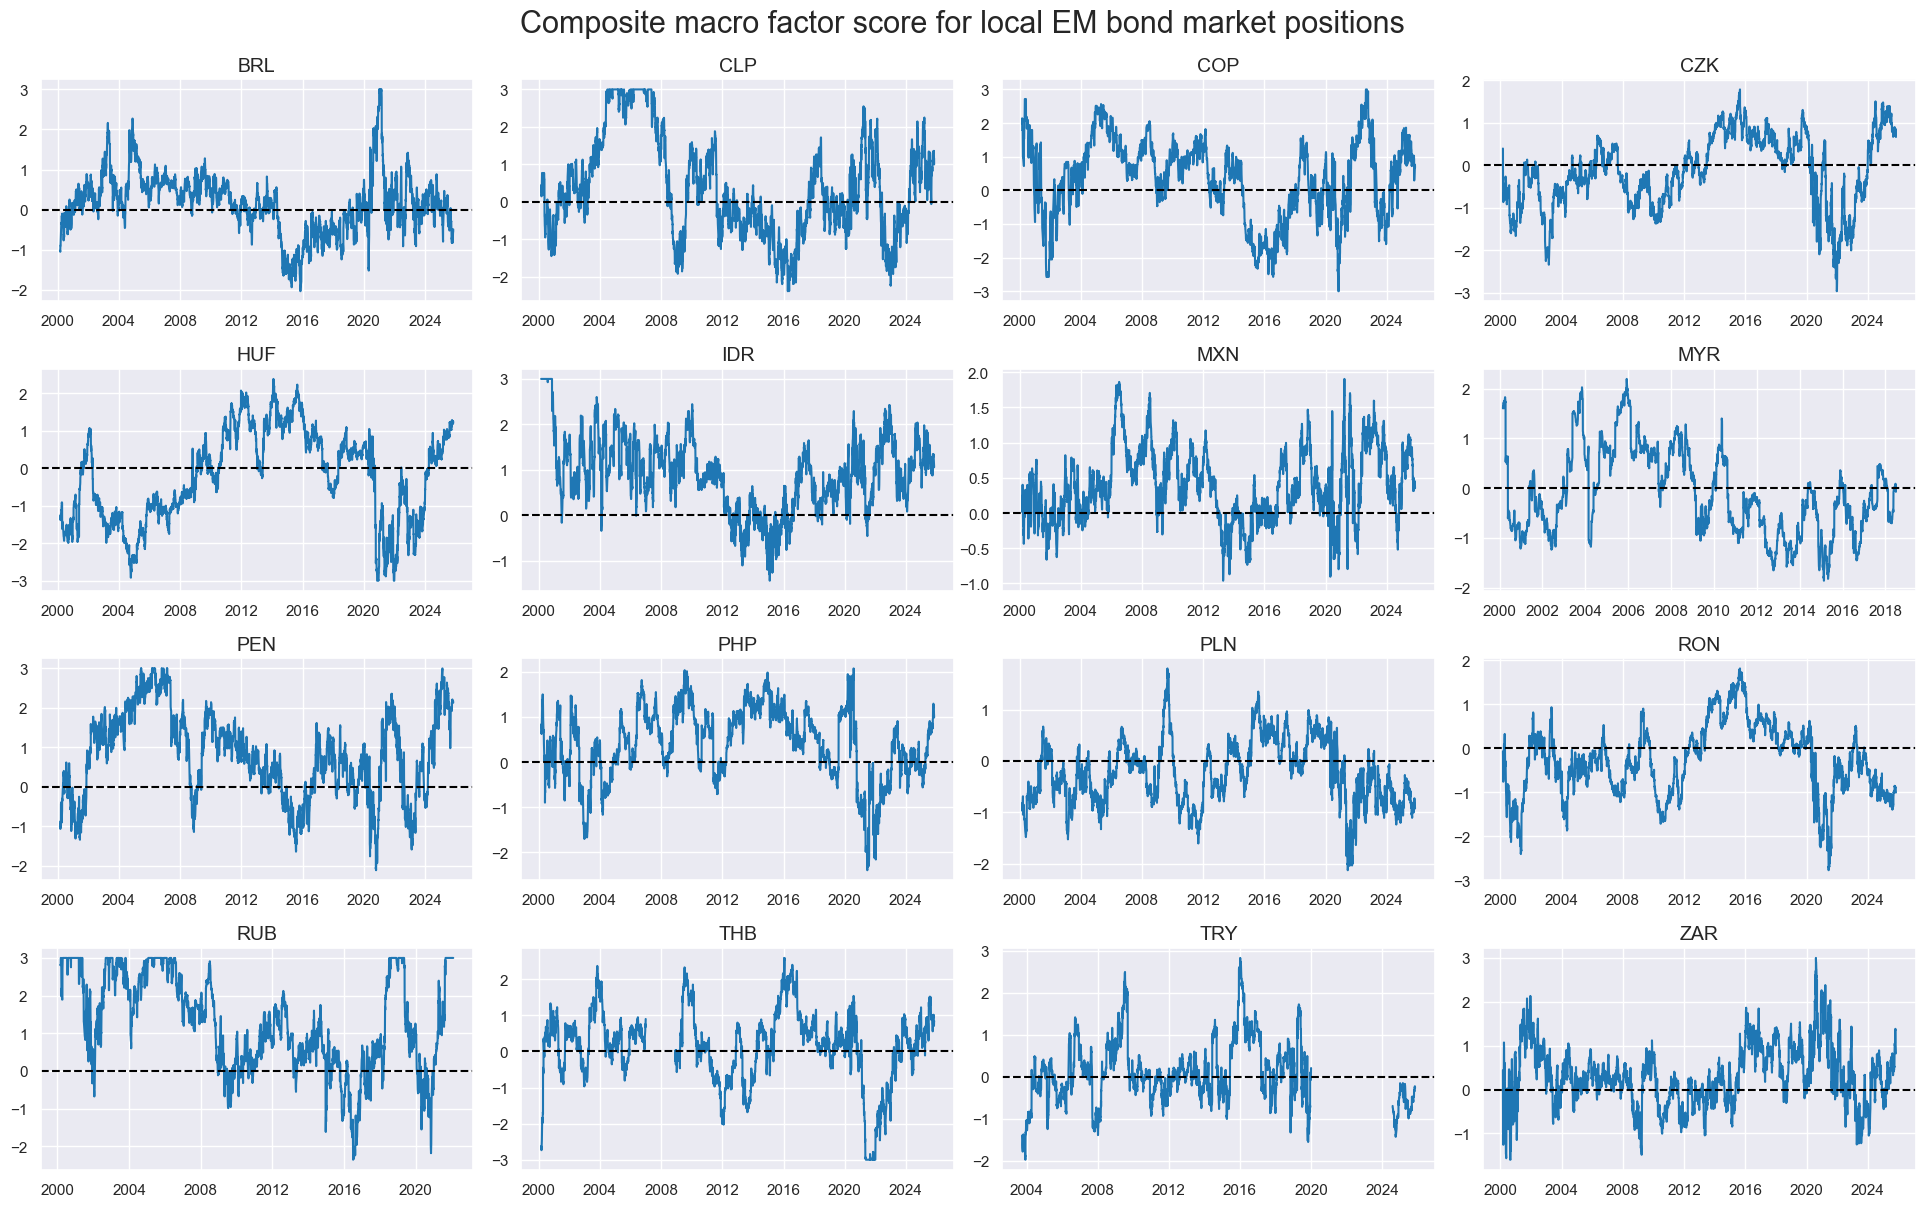
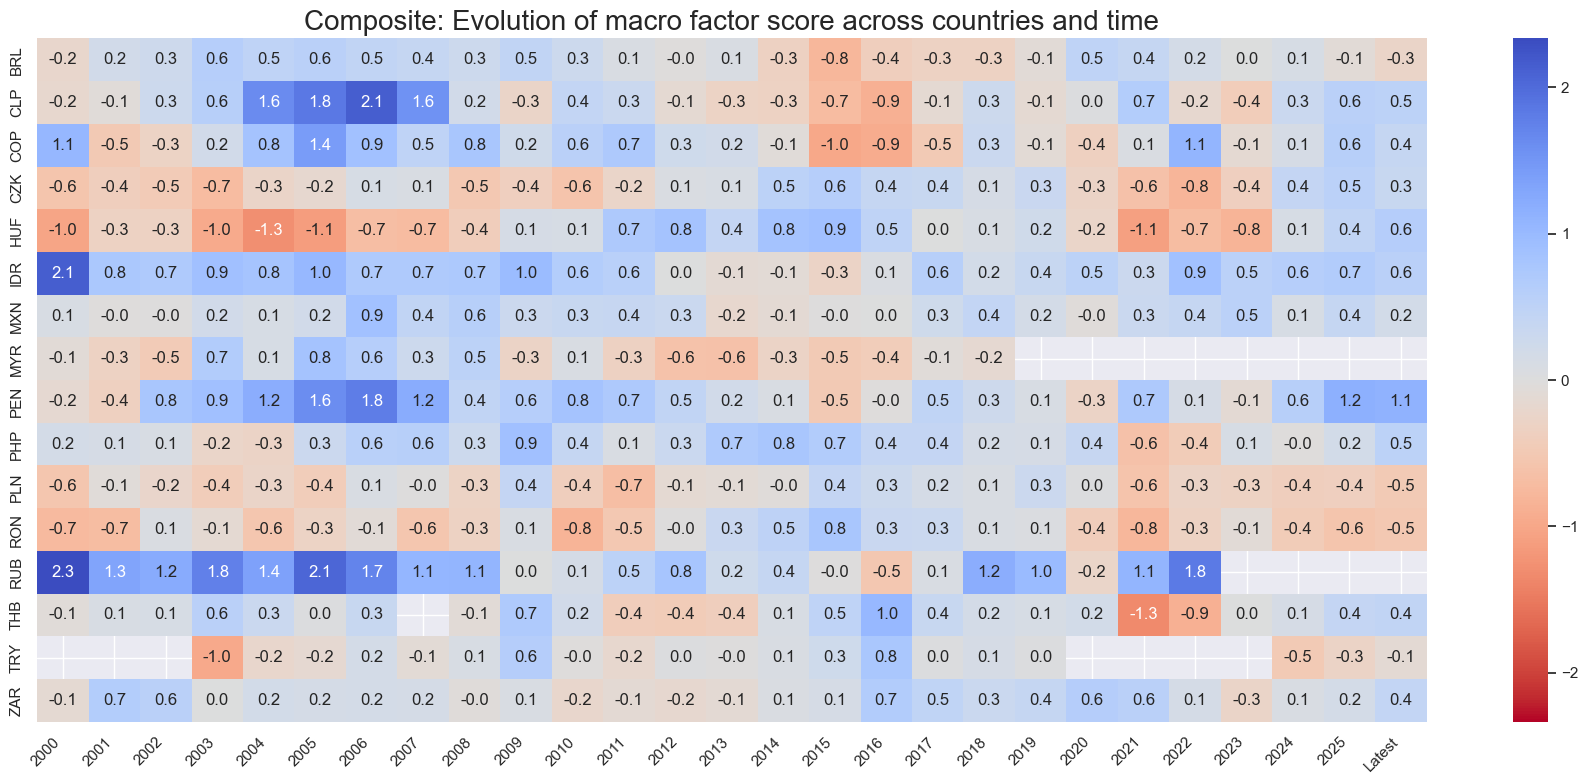
Factor overview and combination #
# Weighted linear combinations
xcatx = list(concept_factors_zn.keys())
cidx = cids_em
sdate = "2000-01-01"
new_cat = "COMP"

dfa = msp.linear_composite(
    dfx,
    xcats=xcatx,
    cids=cidx,
    complete_xcats=False,
    start=sdate,
    new_xcat=new_cat,
)
dfx = msm.update_df(dfx, dfa)

dfa = msp.make_zn_scores(
    dfx,
    xcat=new_cat,
    cids=cidx,
    sequential=True,
    min_obs=261 * 5,
    neutral="zero",
    pan_weight=1,
    thresh=3,
    postfix="_ZN",
    est_freq="m",
)
dfx = msm.update_df(dfx, dfa)

cfs_zn = f"{new_cat}_ZN"
concept_factors_zn[cfs_zn] = "Composite"
xcatx = ["COMP_ZN"]
cidx = cids_em

msp.view_timelines(
    dfx,
    xcats=xcatx,
    cids=cidx,
    ncol=4,
    start="2000-01-01",
    same_y=False,
    title="Composite macro factor score for local EM bond market positions",
    title_fontsize=22,
    height=2,
    size=(10, 10),
    all_xticks=True,
    blacklist=fxblack,
)
xcatx = list(concept_factors_zn.keys())
cidx = cids_em
sdate = "2000-01-01"

msp.correl_matrix(
    dfx,
    xcats=xcatx,
    cids=cidx,
    freq="M",
    title="Cross-correlation of macro factors, monthly frequency, 16 local EMs since 2000",
    title_fontsize=20,
    size=(16, 12),
    max_color=0.8,
    xcat_labels=concept_factors_zn,
    show=True,
    annot=True,
    start=sdate,
)
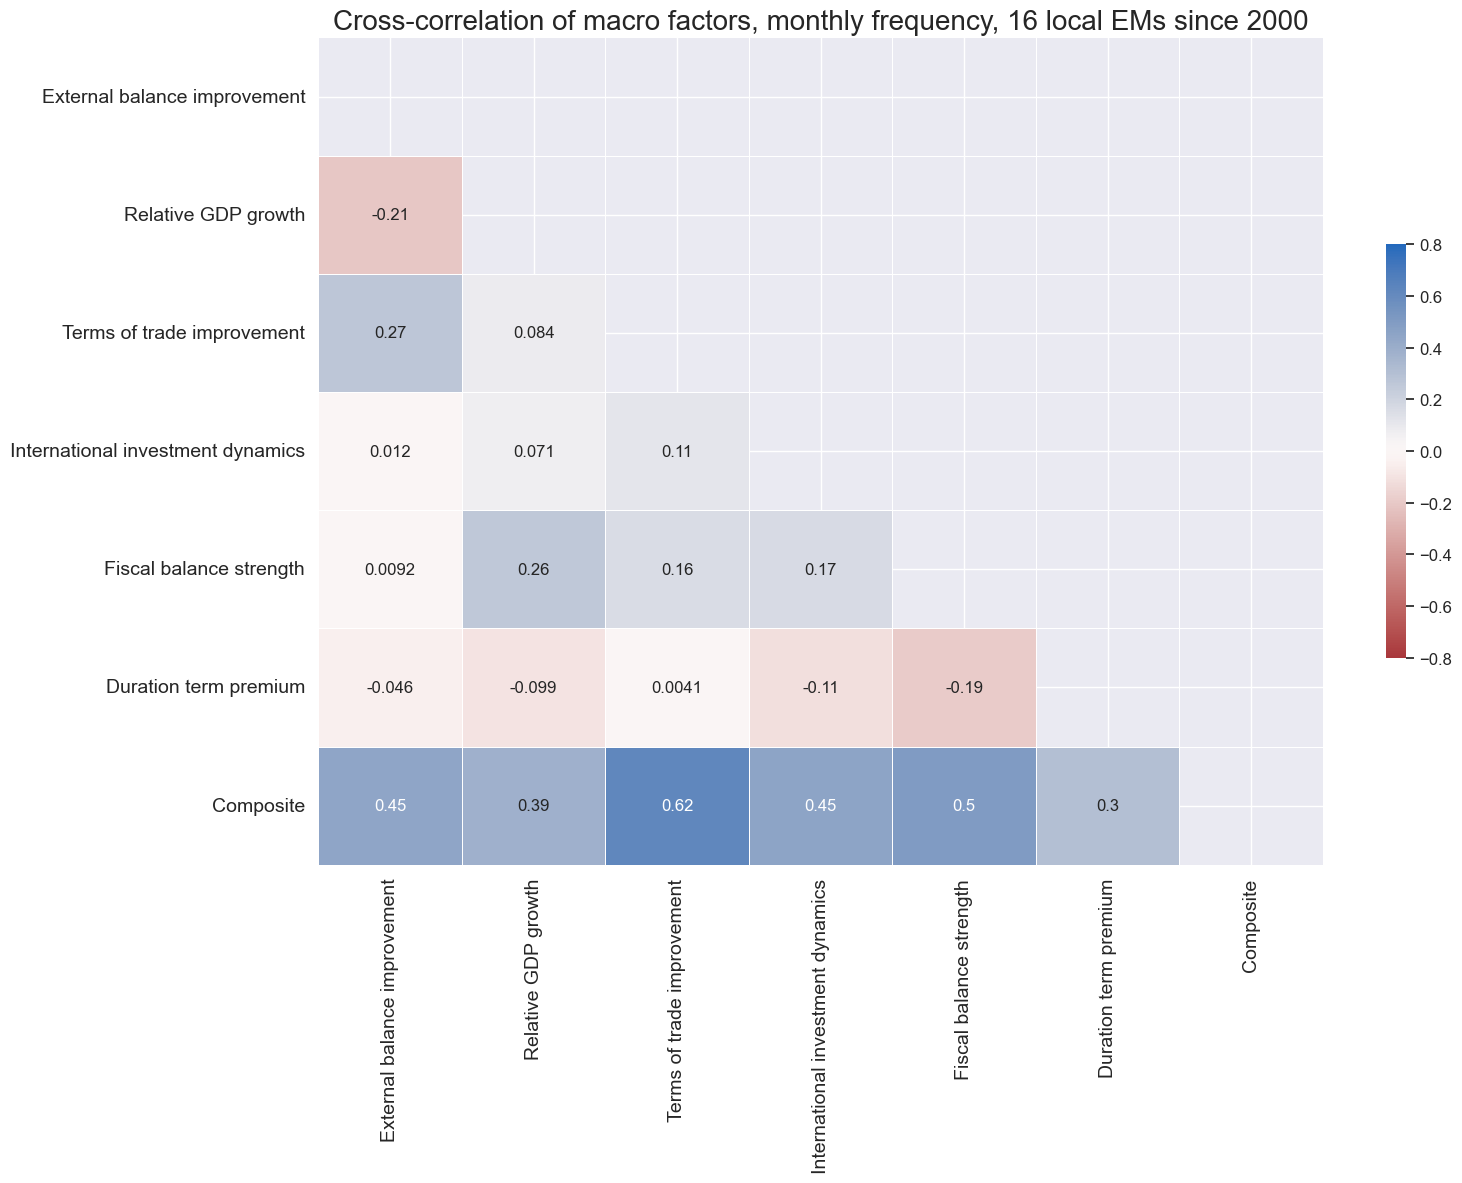
list(concept_factors_zn.keys())
['XBCH_ZN', 'RGDP_ZN', 'TOT_ZN', 'IIPD_ZN', 'XGBAL_ZN', 'DUTP_ZN', 'COMP_ZN']
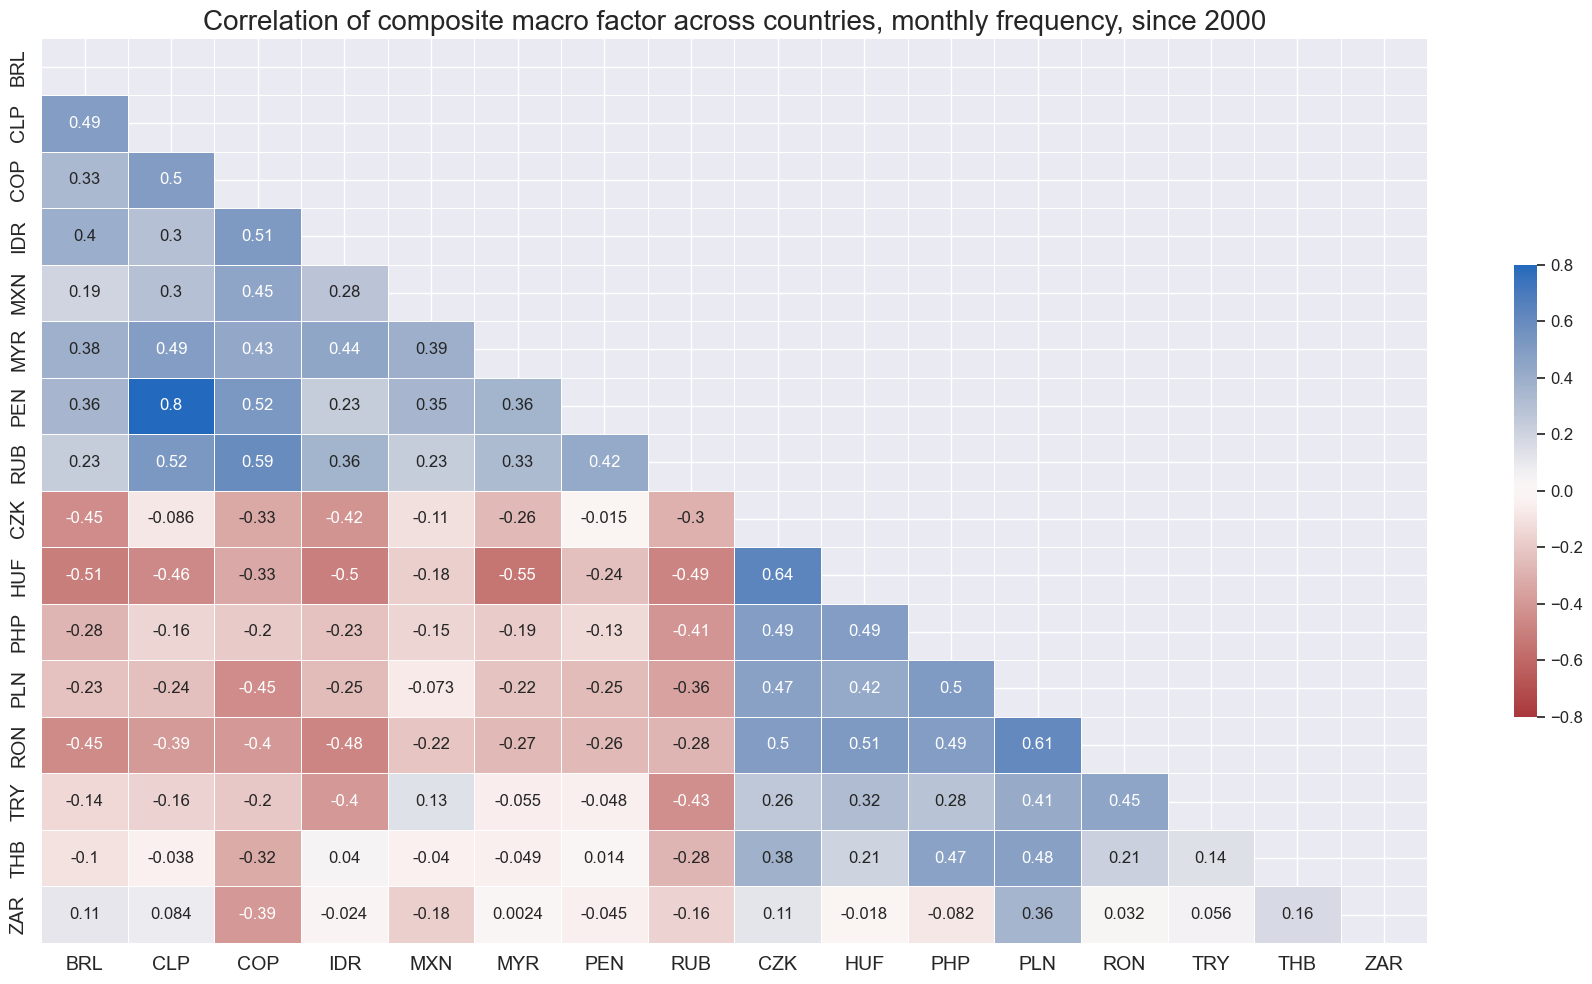
xcatx = ['COMP_ZN']
cidx = cids_em
sdate = "2000-01-01"

msp.correl_matrix(
    dfx,
    xcats=xcatx,
    cids=cidx,
    freq="M",
    title="Correlation of composite macro factor across countries, monthly frequency, since 2000",
    title_fontsize=20,
    size=(18, 10),
    max_color=0.8,
    xcat_labels=concept_factors_zn,
    show=True,
    annot=True,
    start=sdate,
    cluster=True,
)
Macro-quantamental scorecards #
Snapshot #
xcatx = list(concept_factors_zn.keys())
cidx = cids_em
# Set data of snapshot
backdate = datetime.strptime("2008-09-01", "%Y-%m-%d")
lastdate = datetime.strptime(END_DATE, "%Y-%m-%d")
snapdate = lastdate
sv = ScoreVisualisers(
df=dfx,
cids=cidx,
xcats = xcatx,
xcat_labels=concept_factors_zn,
xcat_comp="COMP_ZN",
no_zn_scores=True,
rescore_composite=False,
blacklist=fxblack,
)
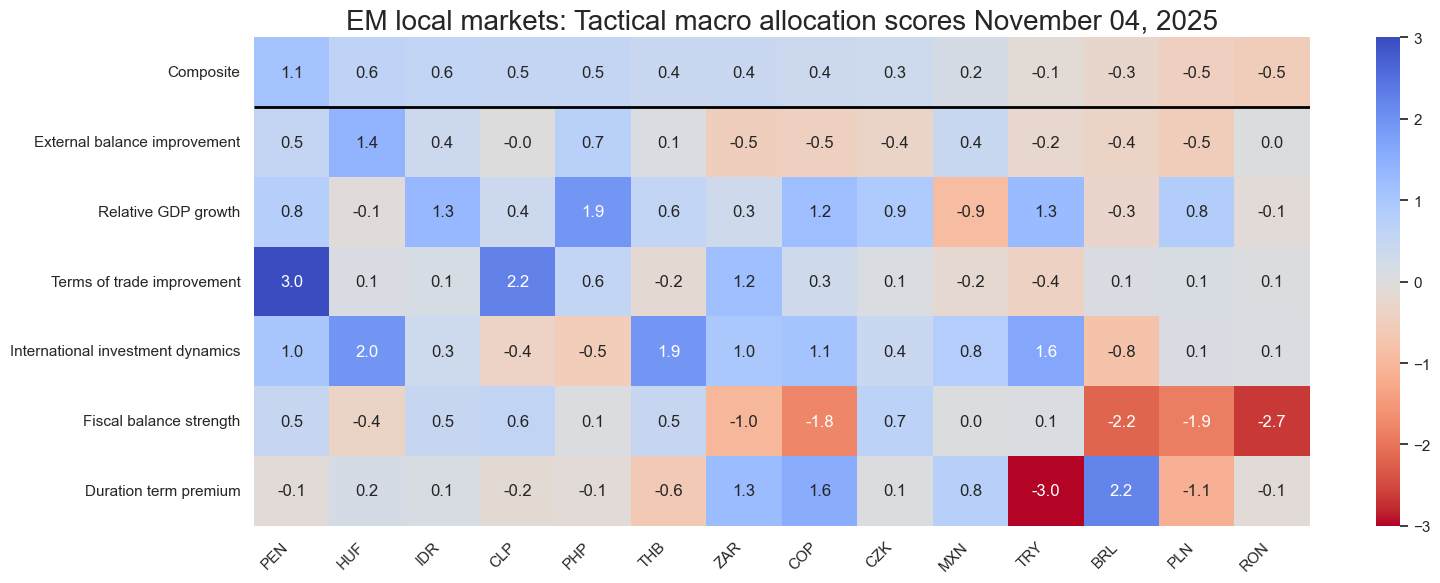
sv.view_snapshot(
cids=cidx,
date=snapdate,
transpose=True,
sort_by_composite = True,
title=f"EM local markets: Tactical macro allocation scores {snapdate.strftime("%B %d, %Y")}",
title_fontsize=20,
figsize=(16, 6),
xcats=xcatx,
xcat_labels=concept_factors_zn,
round_decimals=1,
)
Global history #
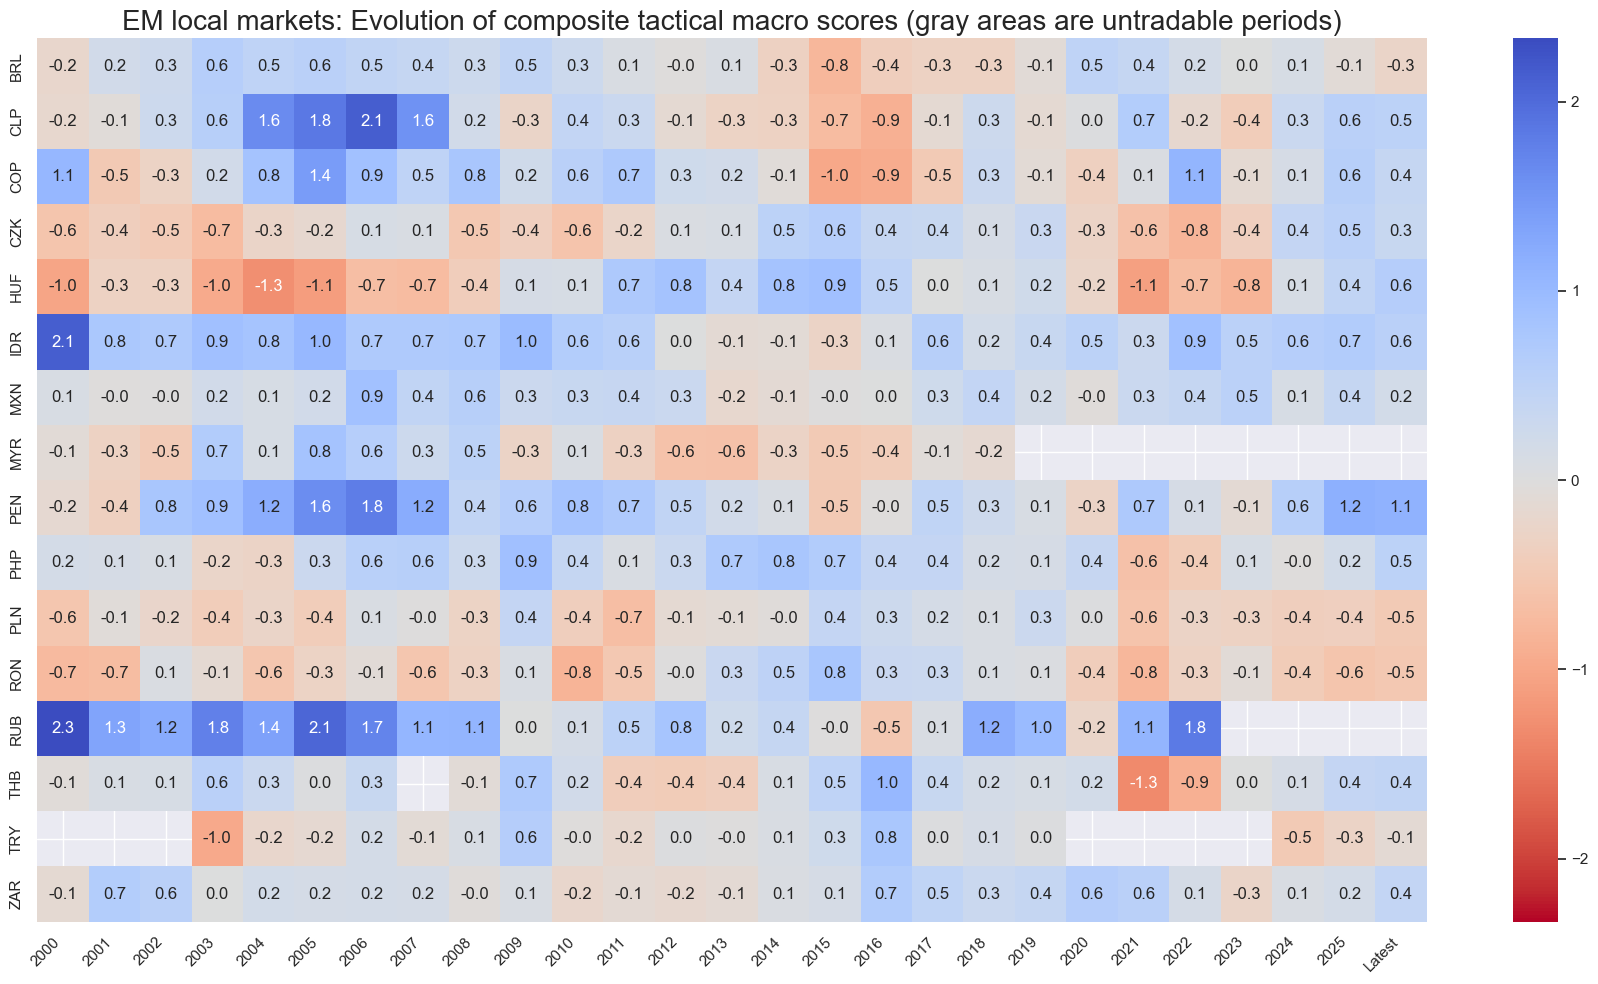
cidx = cids_em

sv.view_score_evolution(
    xcat="COMP_ZN",
    cids=cidx,
    freq="A",
    include_latest_day=True,
    transpose=False,
    title="EM local markets: Evolution of composite tactical macro scores (gray areas are untradable periods)",
    title_fontsize=20,
    start="2000-01-01",
    figsize=(18, 10),
    round_decimals=1,
)
Latest day: 2025-11-04 00:00:00
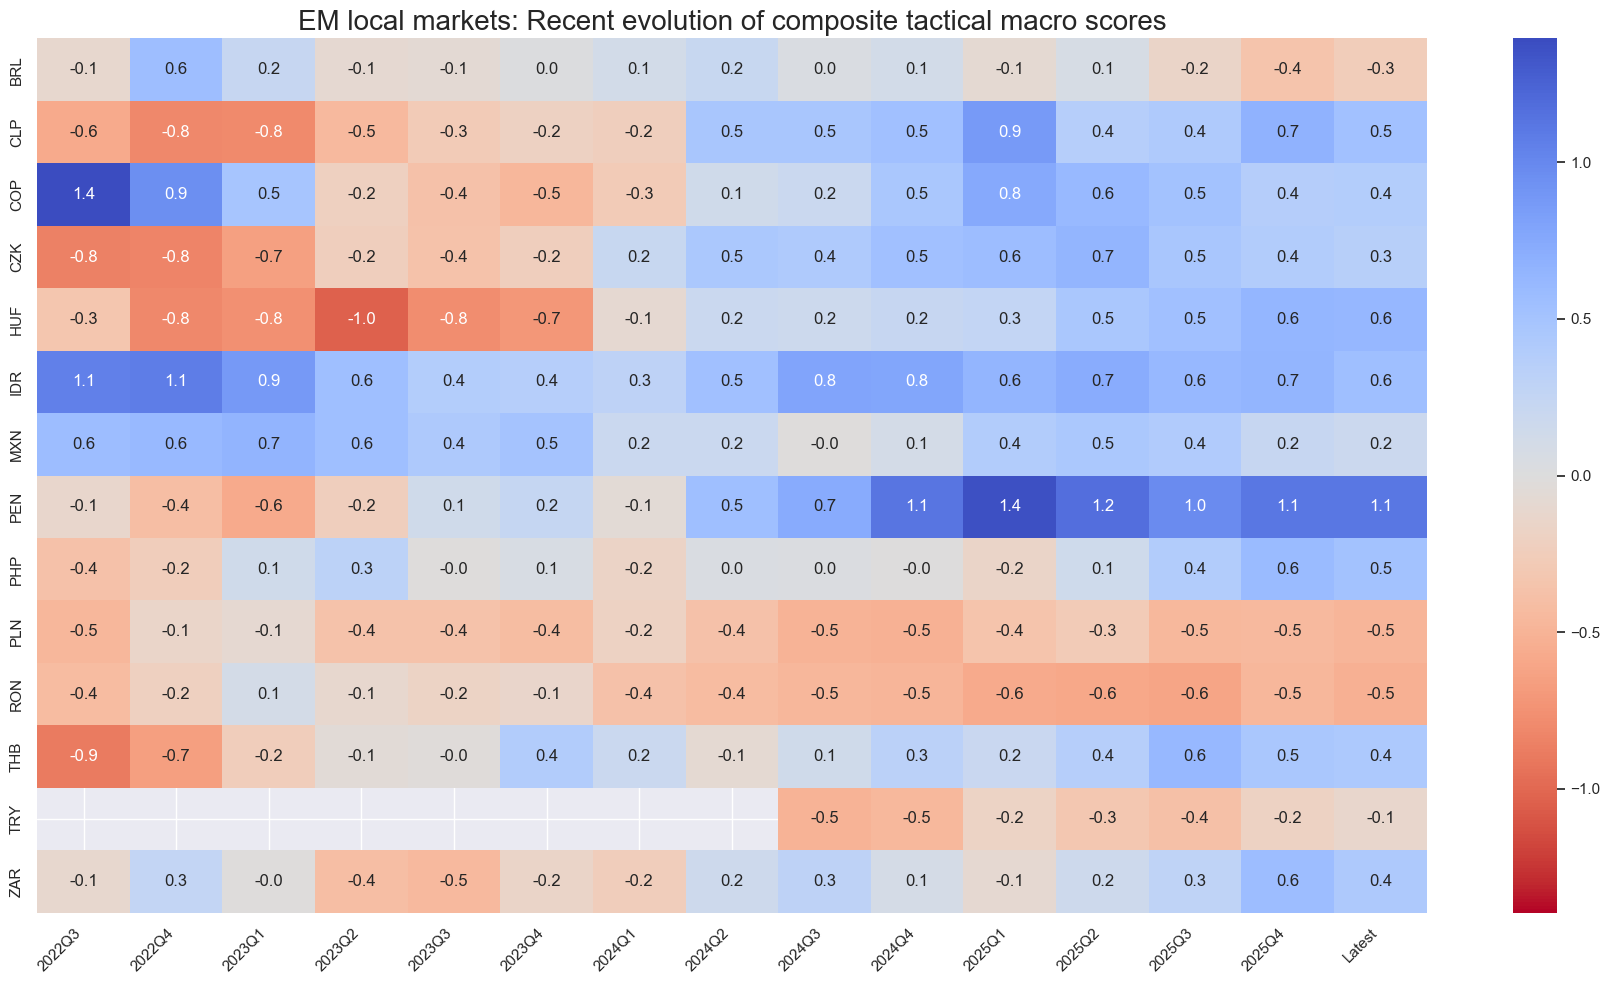
cidx = cids_em

sv.view_score_evolution(
    xcat="COMP_ZN",
    cids=cidx,
    freq="Q",
    include_latest_day=True,
    transpose=False,
    title="EM local markets: Recent evolution of composite tactical macro scores",
    title_fontsize=20,
    start="2022-07-01",
    figsize=(18, 10),
    round_decimals=1,
)
Latest day: 2025-11-04 00:00:00
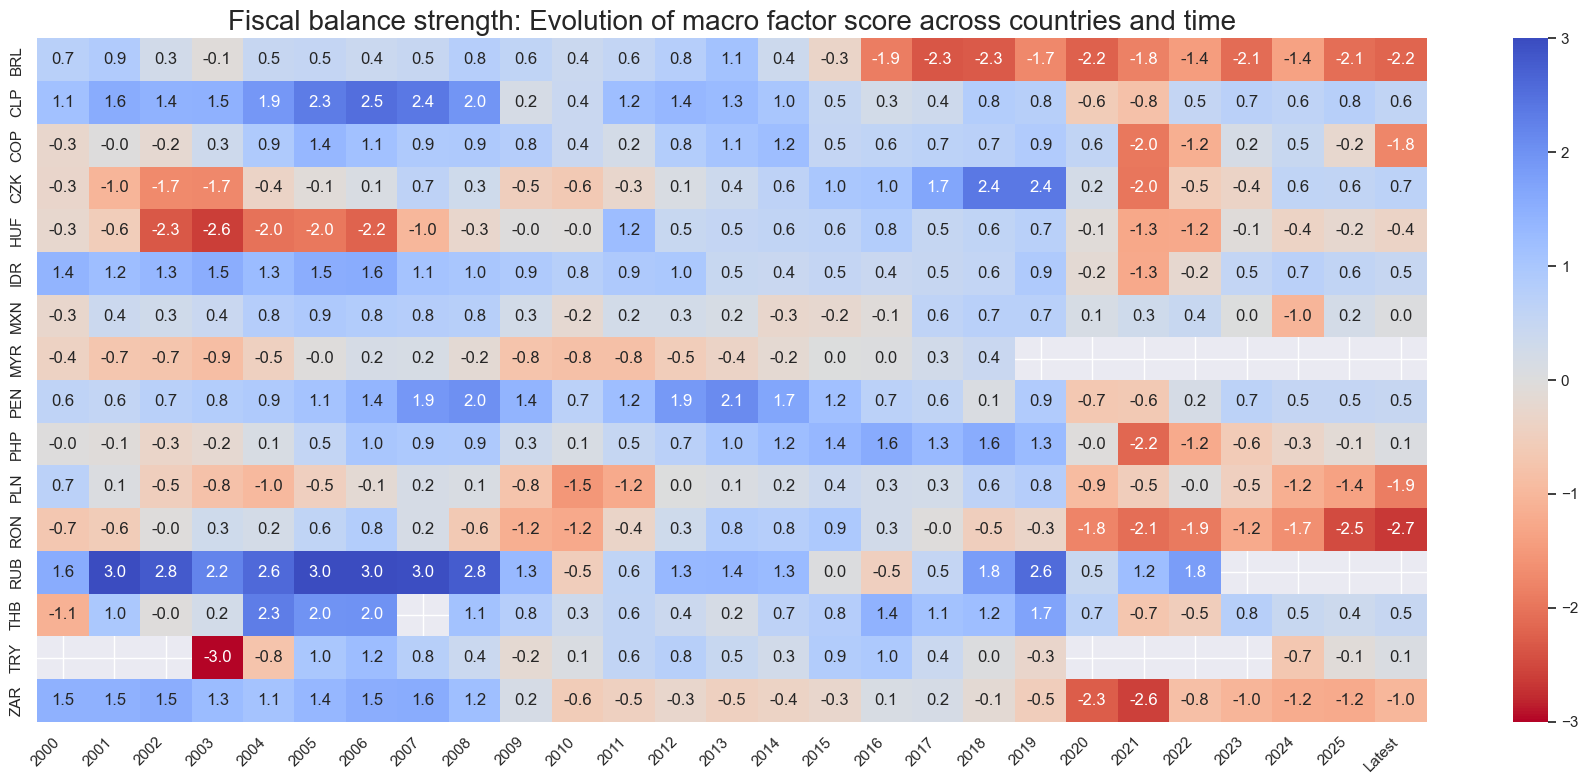
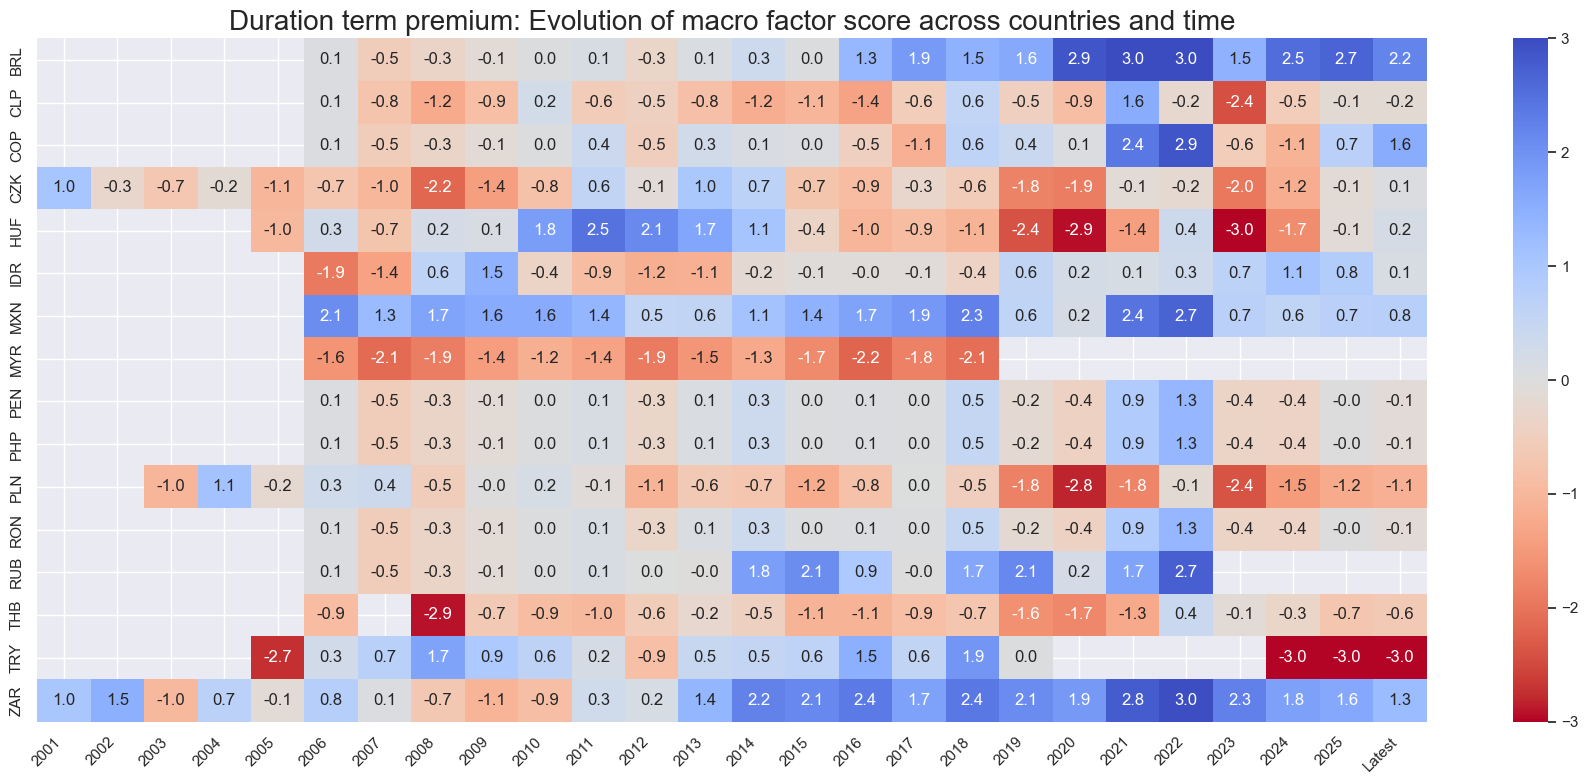
Thematic history #
xcatx = list(concept_factors_zn.keys())
cidx = cids_em

for xcat in xcatx:
    xc_name = concept_factors_zn[xcat]
    sv.view_score_evolution(
        xcat=xcat,
        cids=cidx,
        freq="A",
        transpose=False,
        title=f"{xc_name}: Evolution of macro factor score across countries and time",
        title_fontsize=20,
        figsize=(18, 8),
        round_decimals=1,
        start="2000-01-01",
    )
Latest day: 2025-11-04 00:00:00
Latest day: 2025-11-04 00:00:00
Latest day: 2025-11-04 00:00:00
Latest day: 2025-11-04 00:00:00
Latest day: 2025-11-04 00:00:00
Latest day: 2025-11-04 00:00:00
Latest day: 2025-11-04 00:00:00
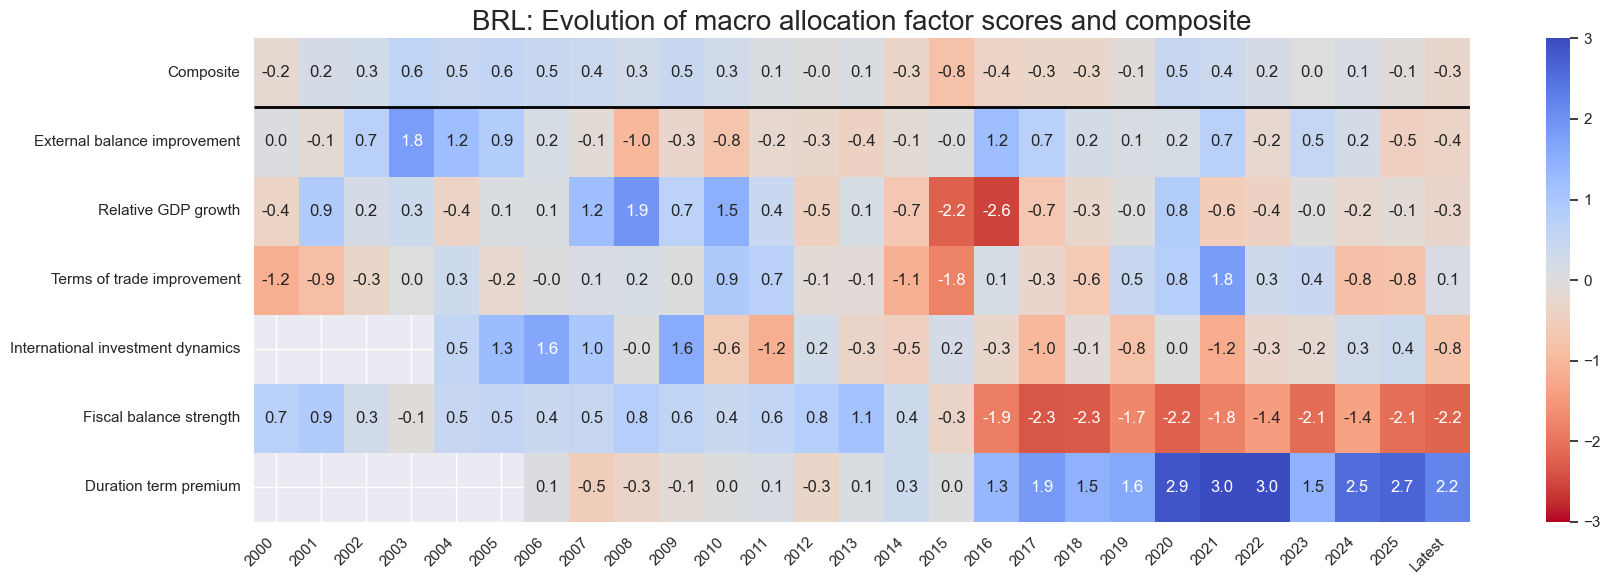
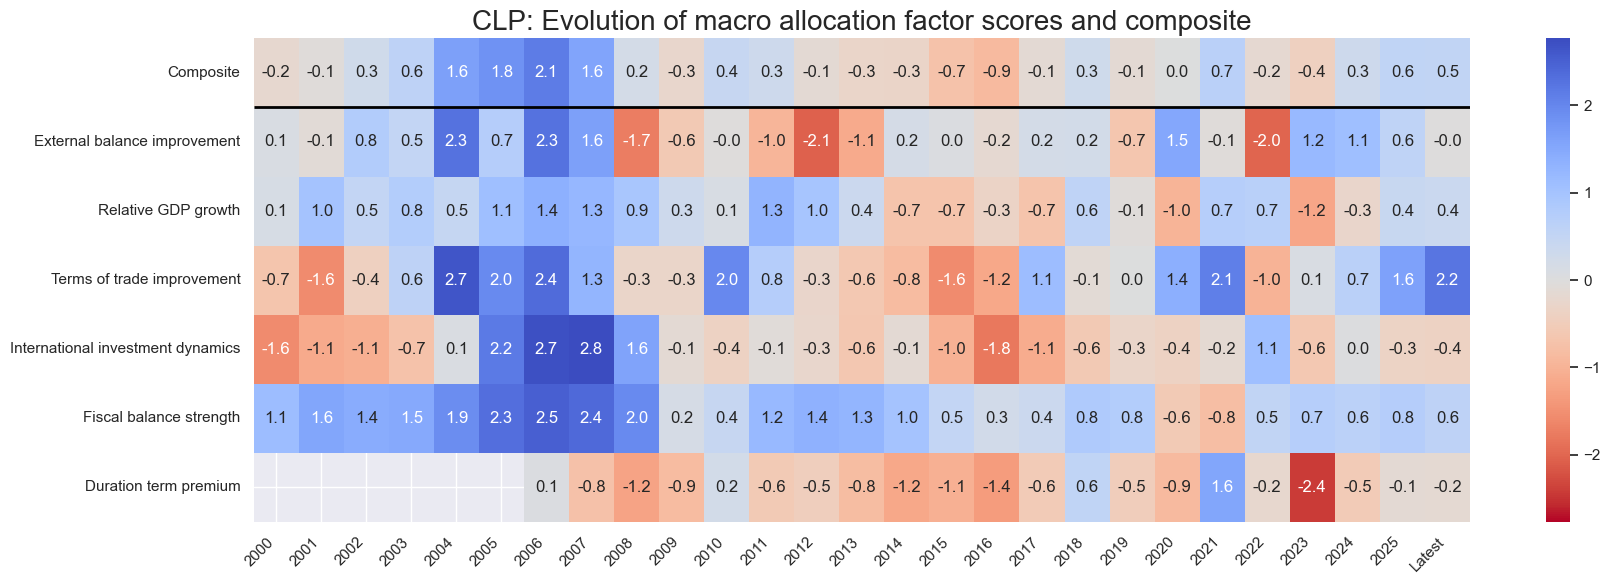
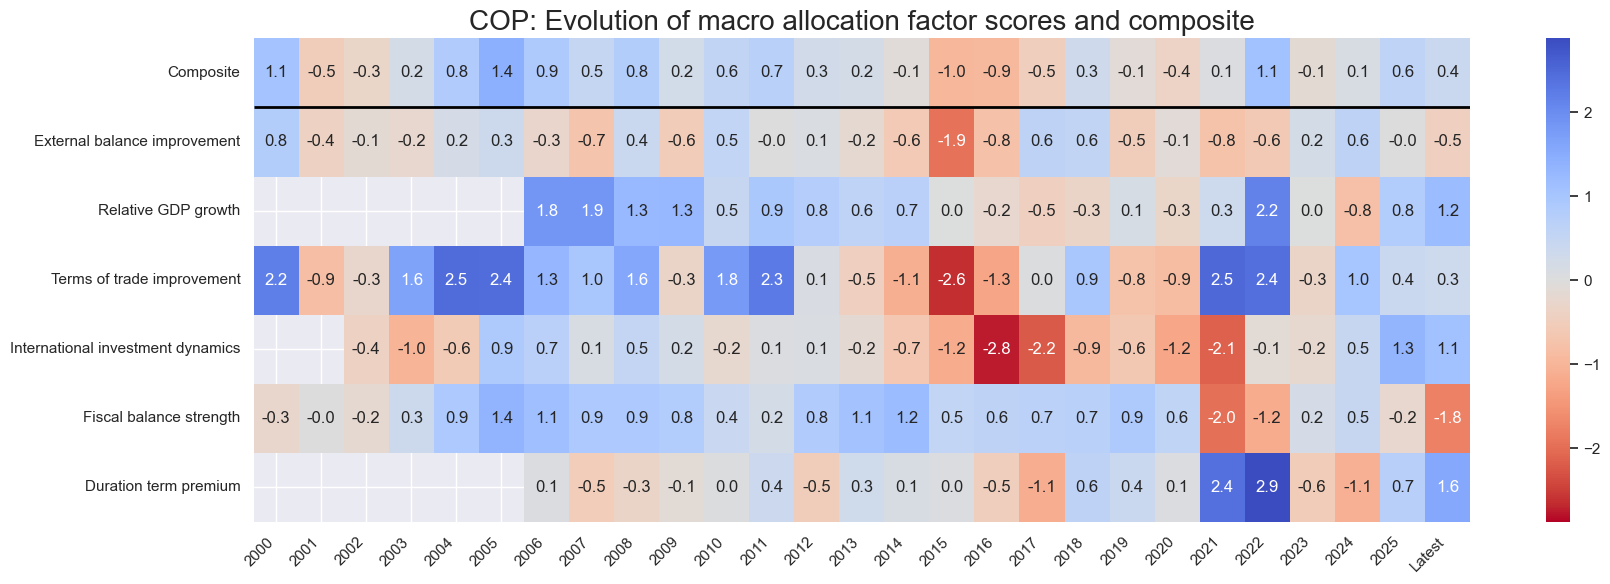
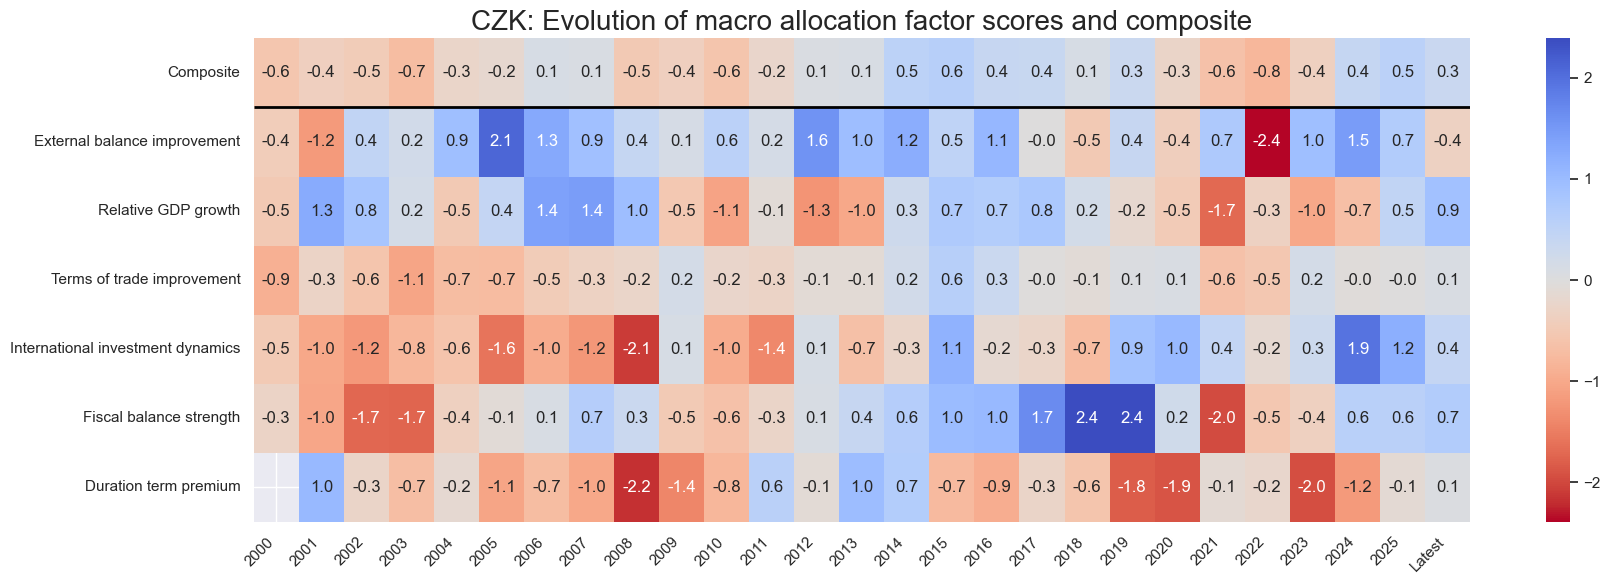
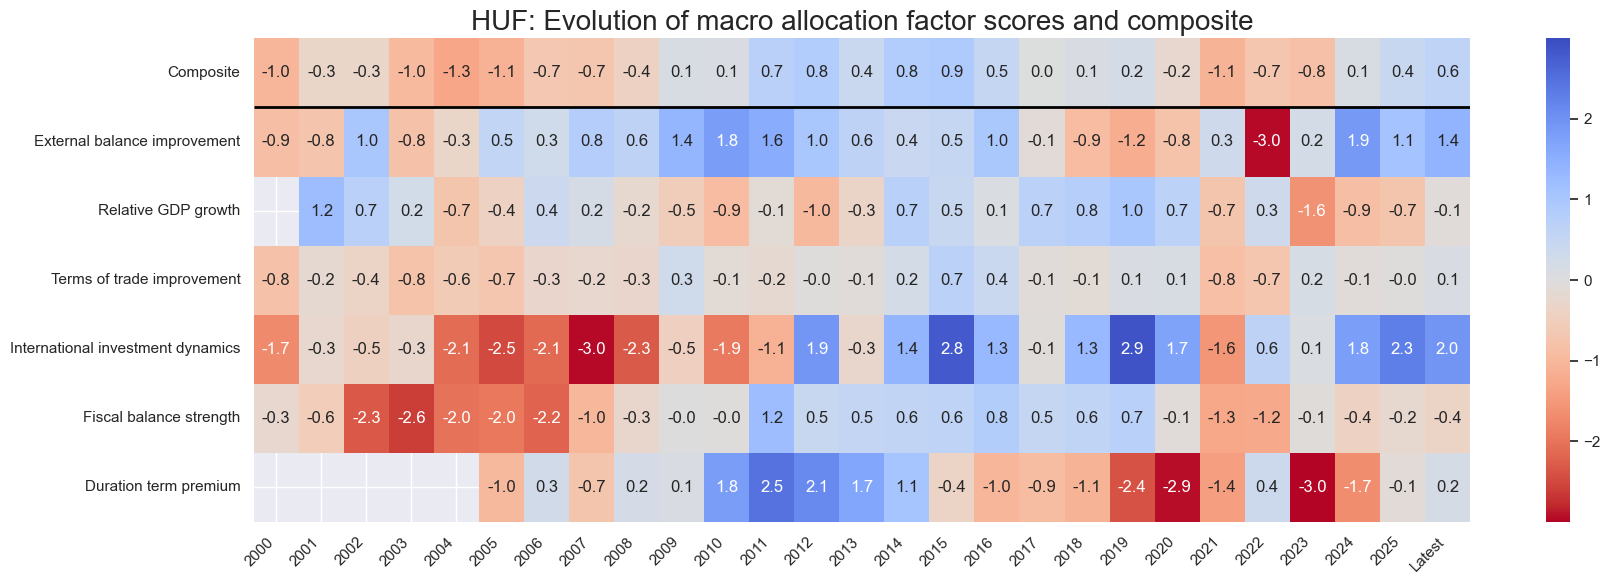
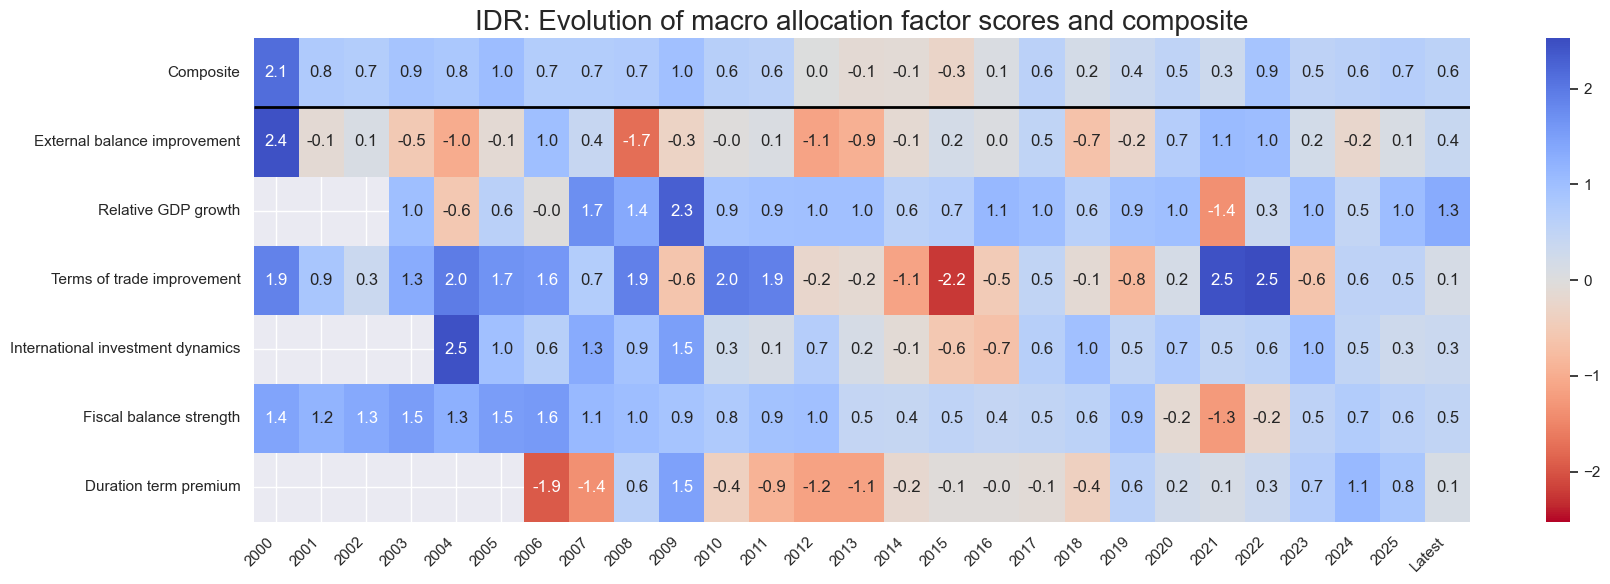
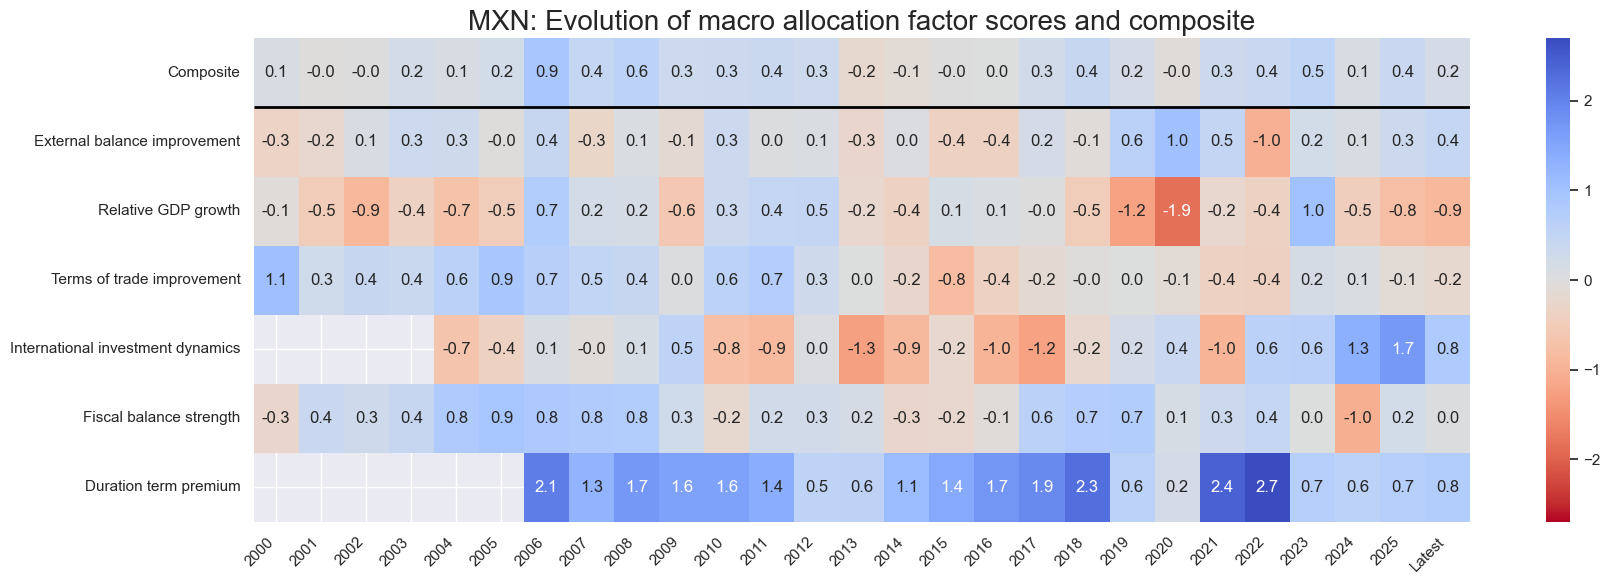
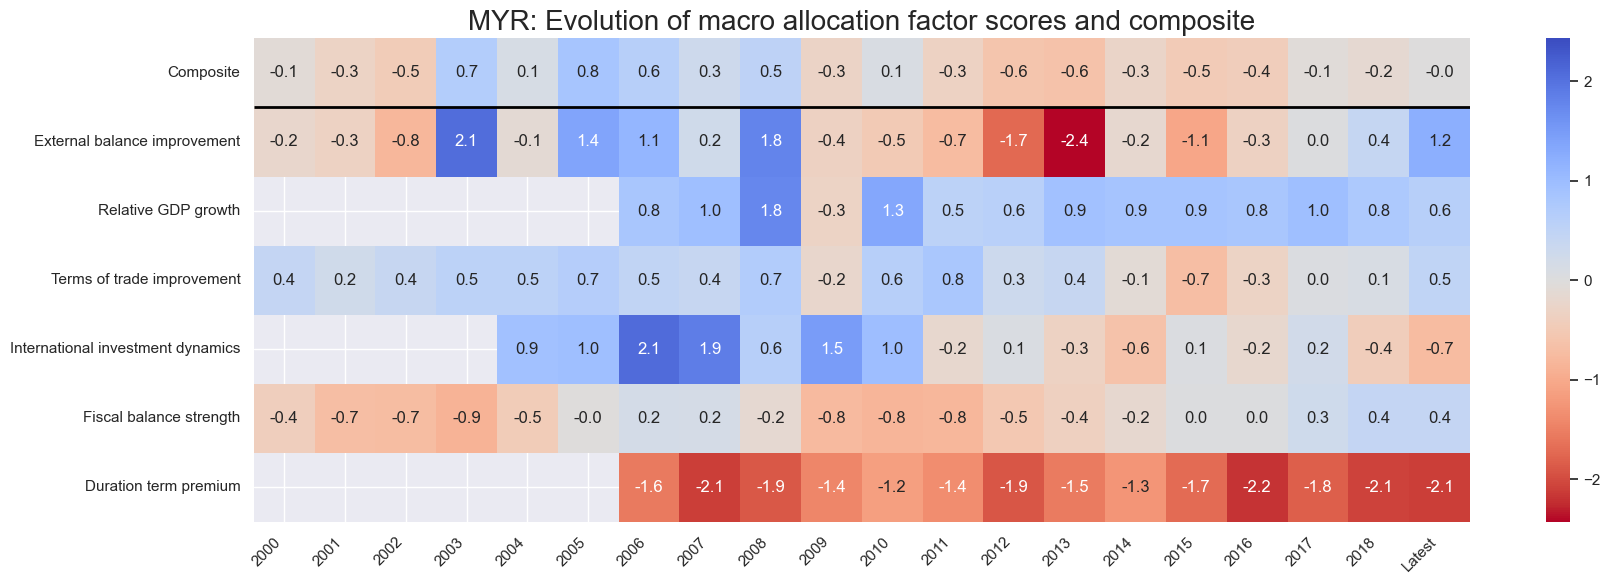
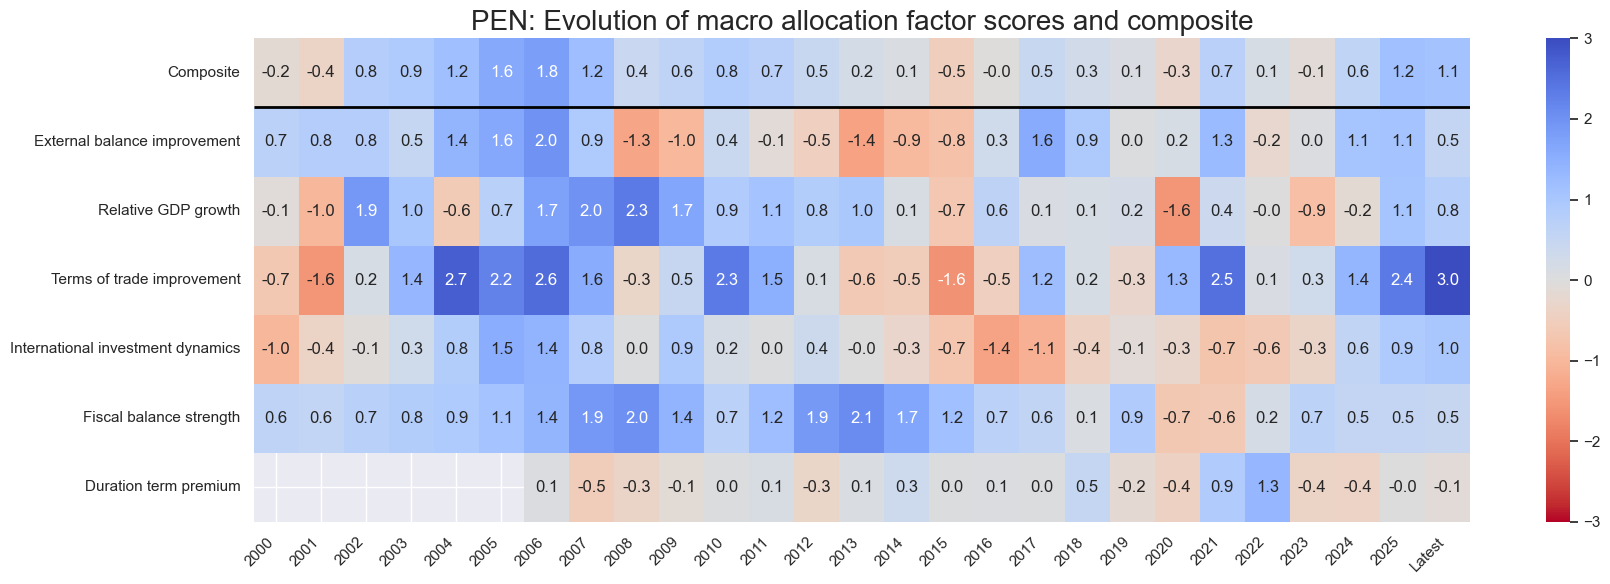
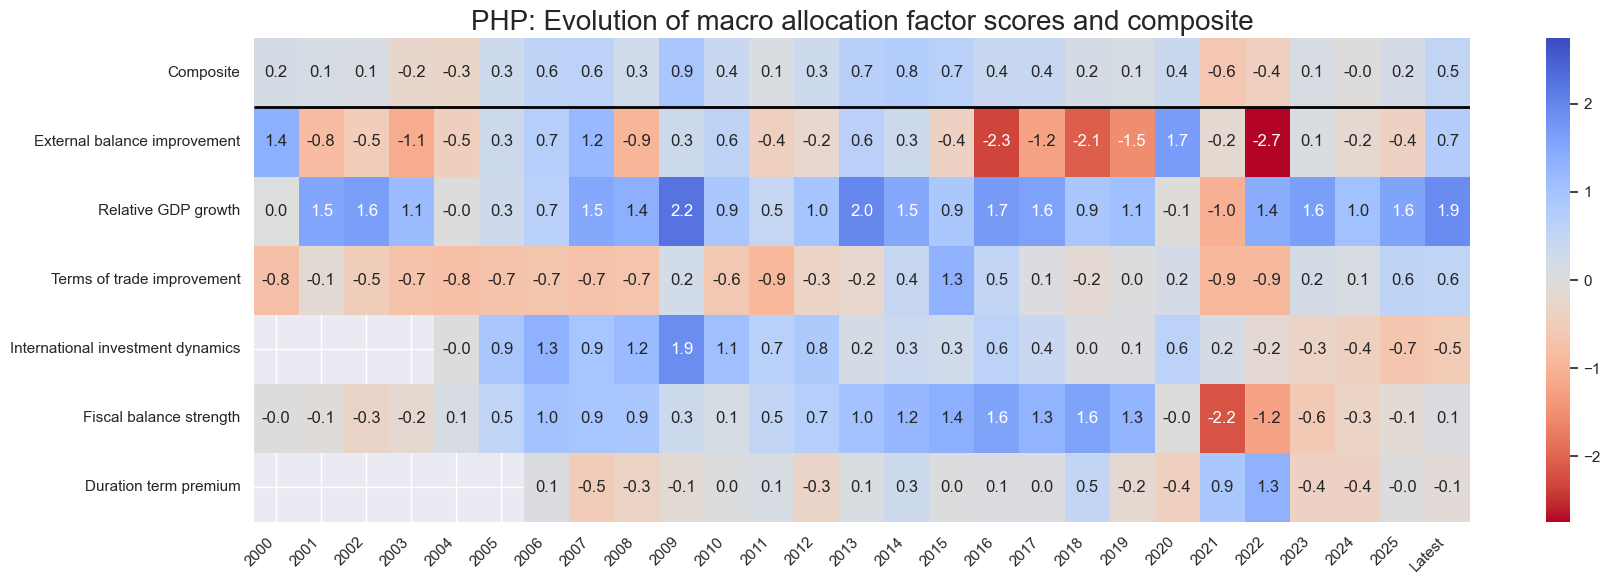
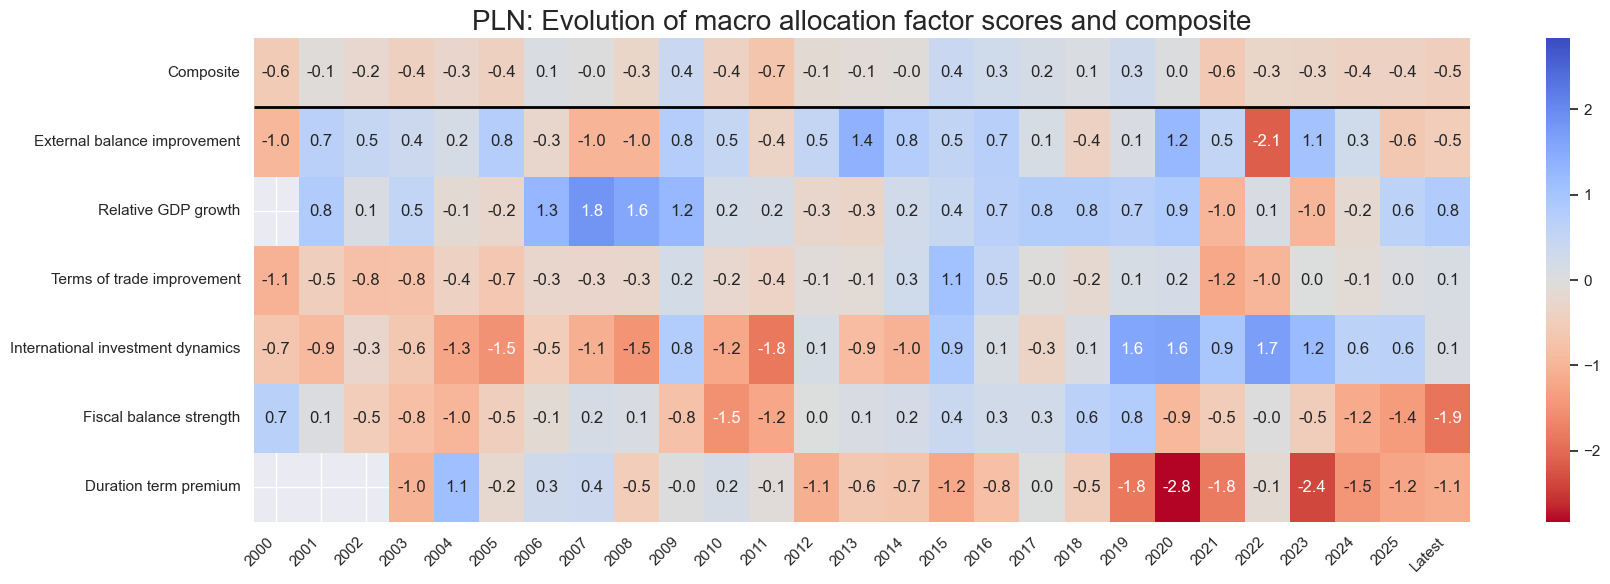
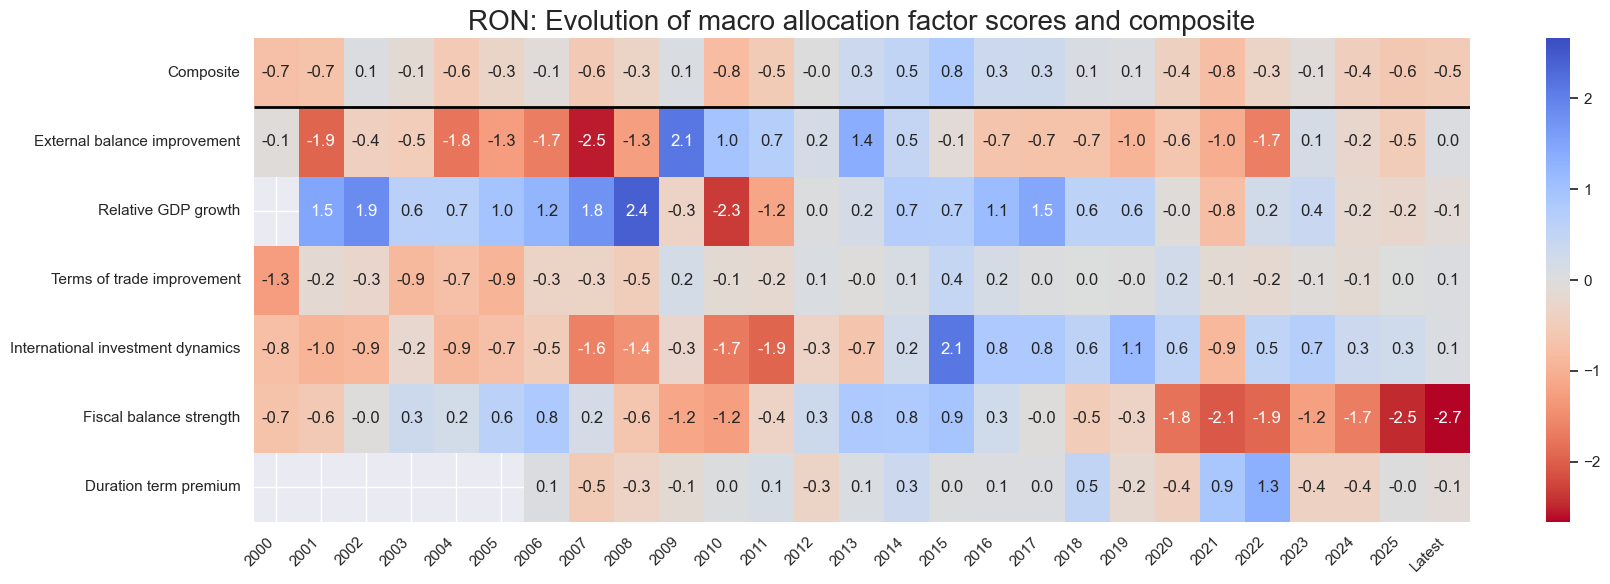
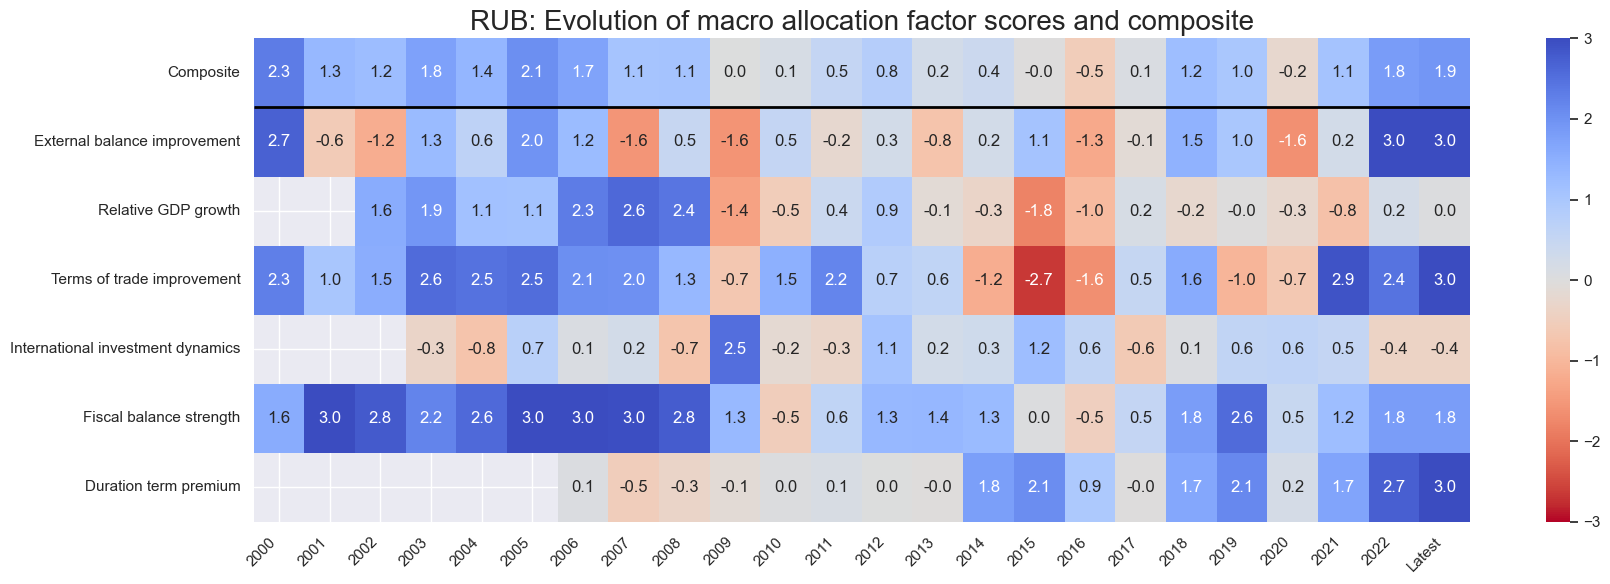
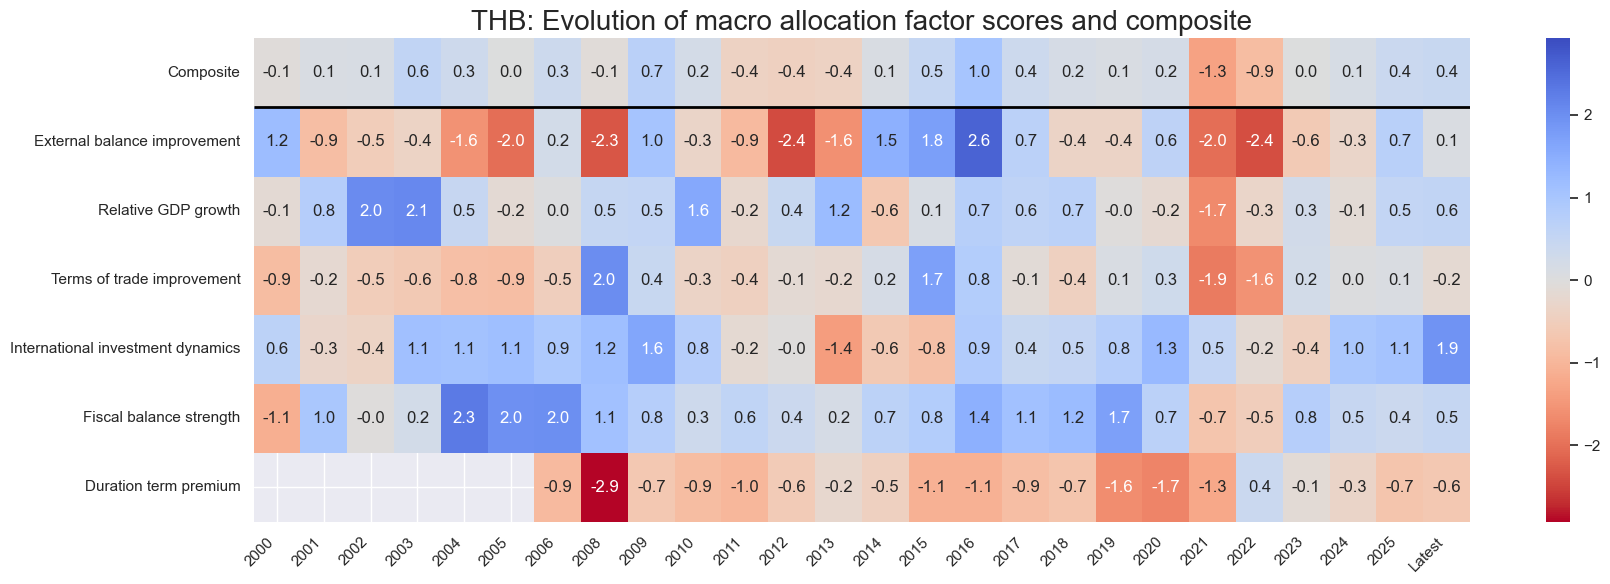
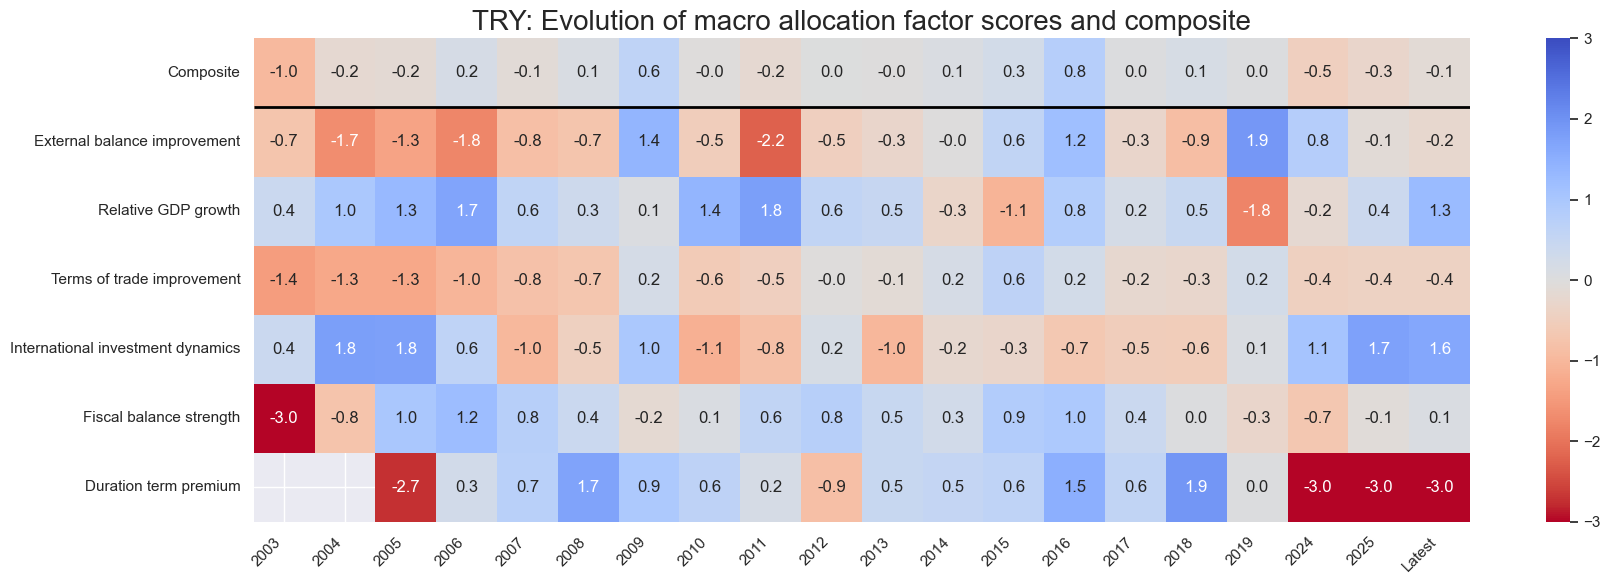
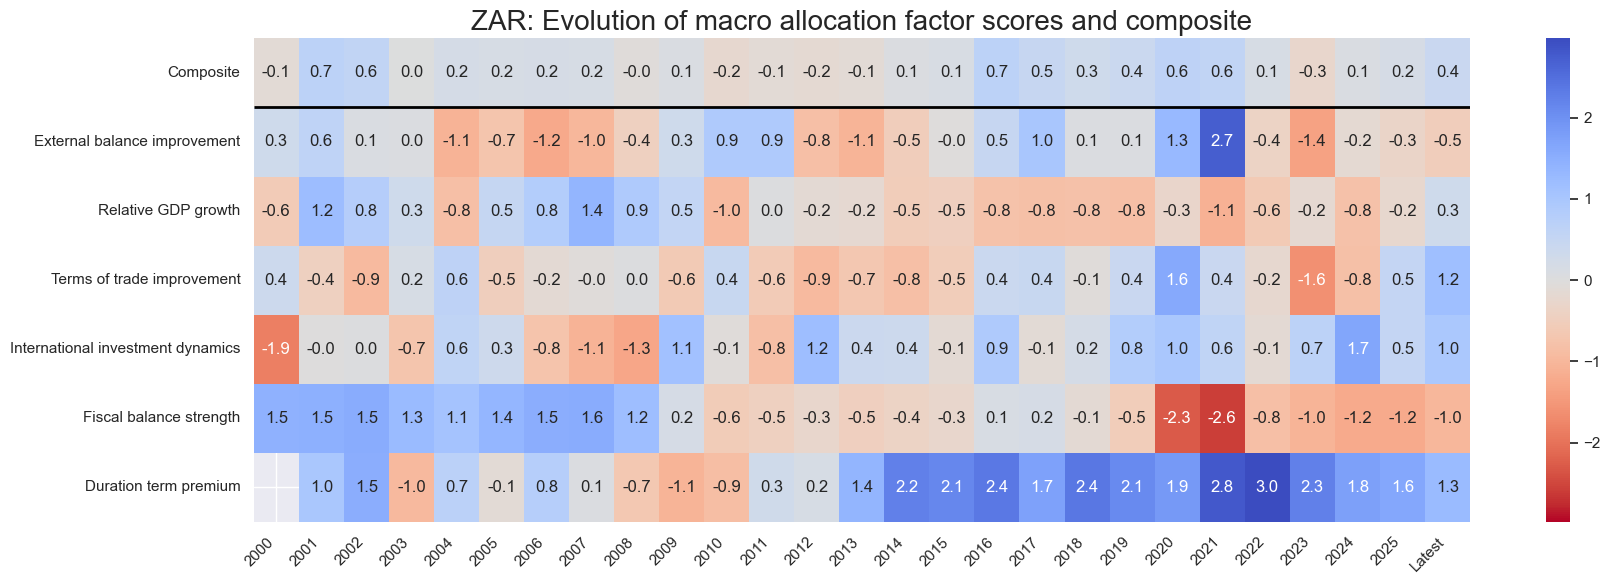
Country history #
xcatx = list(concept_factors_zn.keys())
cidx = cids_em

for cid in cidx:

    sv.view_cid_evolution(
        cid=cid,
        xcats=xcatx,
        xcat_labels=concept_factors_zn,
        freq="A",
        transpose=False,
        title=f"{cid}: Evolution of macro allocation factor scores and composite",
        title_fontsize=20,
        figsize=(18, 6),
        round_decimals=1,
        start="2000-01-01",
    )
Latest day: 2025-11-04 00:00:00
Latest day: 2025-11-04 00:00:00
Latest day: 2025-11-04 00:00:00
Latest day: 2025-11-04 00:00:00
Latest day: 2025-11-04 00:00:00
Latest day: 2025-11-04 00:00:00
Latest day: 2025-11-04 00:00:00
Latest day: 2018-06-29 00:00:00
Latest day: 2025-11-04 00:00:00
Latest day: 2025-11-04 00:00:00
Latest day: 2025-11-04 00:00:00
Latest day: 2025-11-04 00:00:00
Latest day: 2022-01-31 00:00:00
Latest day: 2025-11-04 00:00:00
Latest day: 2025-11-04 00:00:00
Latest day: 2025-11-04 00:00:00
Value checks #
Specs and panel test #
dict_lm = {
    "sigs": list(concept_factors_zn.keys()),
    "targ": "LCBIXRUSD_VT10",
    "cidx": cids_em,
    "black": fxblack,
    "start": "2000-01-01",
    "srr": None,
    "pnls": None,
}
dix = dict_lm
sigs = [k for k in concept_factors_zn.keys() if k != 'COMP_ZN']
targ = dix["targ"]
cidx = dix["cidx"]
blax = dix["black"]
start = dix["start"]
# Dictionary to store CategoryRelations objects
crx = []
# Create CategoryRelations objects for all signals
for sig in sigs:
crx.append(
msp.CategoryRelations(
dfx,
xcats=[sig, targ],
cids=cidx,
freq="M",
lag=1,
xcat_aggs=["last", "sum"],
start=start,
blacklist=blax,
xcat_trims=[None, None],
)
)
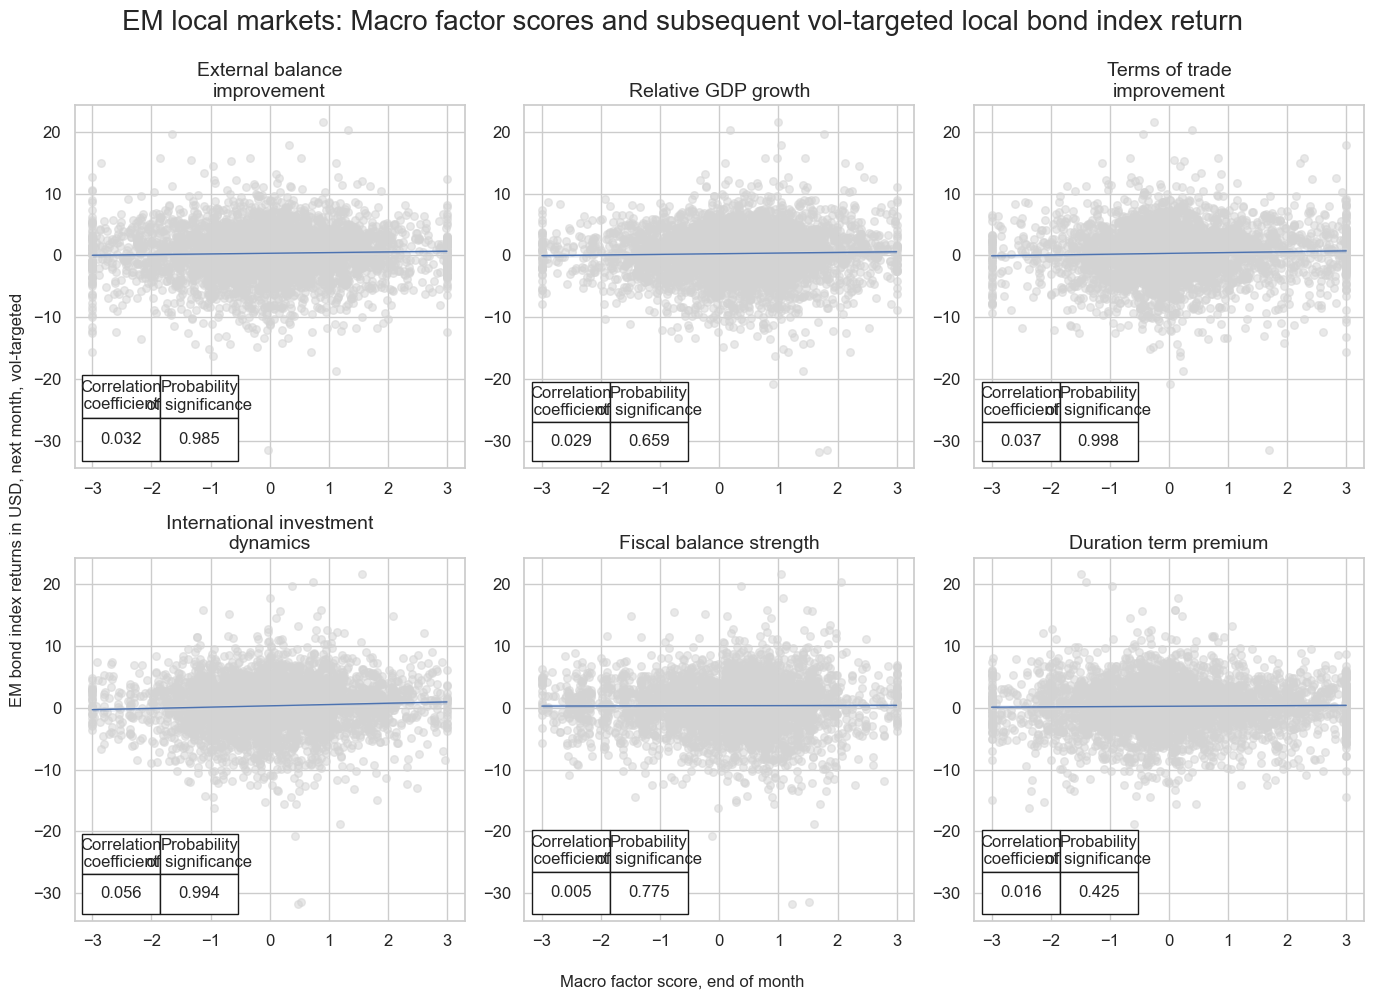
# Display scatter plots for all signals
msv.multiple_reg_scatter(
cat_rels=crx,
coef_box="lower left",
ncol=3,
nrow=2,
xlab="Macro factor score, end of month",
ylab="EM bond index returns in USD, next month, vol-targeted",
title="EM local markets: Macro factor scores and subsequent vol-targeted local bond index return",
title_fontsize=20,
figsize=(14, 10),
prob_est="map",
subplot_titles=[concept_factors_zn[sig] for sig in sigs],
share_axes=False,
)
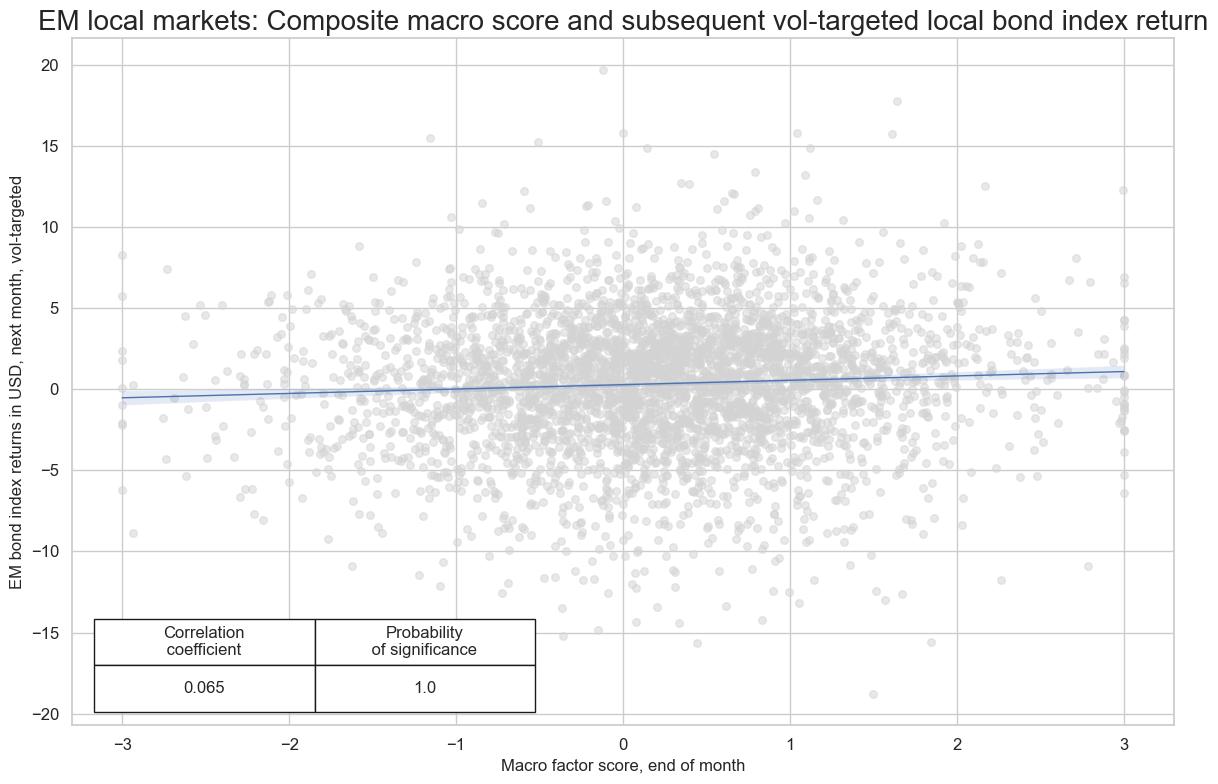
dix = dict_lm

sig = "COMP_ZN"
targ = dix["targ"]
cidx = dix["cidx"]
blax = dix["black"]
start = dix["start"]

crx = msp.CategoryRelations(
    dfx,
    xcats=[sig, targ],
    cids=cidx,
    freq="m",
    lag=1,
    slip=1,
    xcat_aggs=["last", "sum"],
    start=start,
    blacklist=blax,
    xcat_trims=[20, 20],  # purely for better plot viewing, little impact on results
)

crx.reg_scatter(
    labels=False,
    coef_box="lower left",
    xlab="Macro factor score, end of month",
    ylab="EM bond index returns in USD, next month, vol-targeted",
    title="EM local markets: Composite macro score and subsequent vol-targeted local bond index return",
    title_fontsize=20,
    size=(12, 8),
    prob_est="map",
)
Accuracy and correlation check #
dix = dict_lm

sigs = dix["sigs"]
targ = dix["targ"]
cidx = dix["cidx"]
blax = dix["black"]
start = dix["start"]

srr = mss.SignalReturnRelations(
    dfx,
    cids=cidx,
    sigs=sigs,
    rets=targ,
    freqs="M",
    start=start,
    blacklist=blax,
)

dix["srr"] = srr
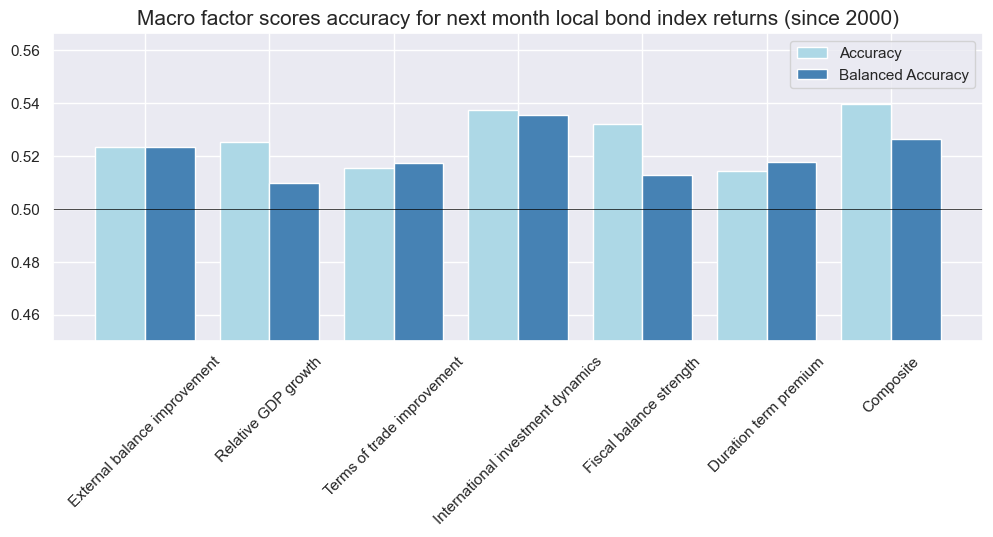
dix = dict_lm
srrx = dix["srr"]
display(srrx.multiple_relations_table().round(3))

srrx.accuracy_bars(type="signals",
                  freq="m",
                  size=(12, 4),
                  title="Macro factor scores accuracy for next month local bond index returns (since 2000)",
                  title_fontsize=15,
                  x_labels=concept_factors_zn,
                  x_labels_rotate=45,
                  )
| accuracy | bal_accuracy | pos_sigr | pos_retr | pos_prec | neg_prec | pearson | pearson_pval | kendall | kendall_pval | auc | ||||
|---|---|---|---|---|---|---|---|---|---|---|---|---|---|---|
| Return | Signal | Frequency | Aggregation | |||||||||||
| LCBIXRUSD_VT10 | COMP_ZN | M | last | 0.540 | 0.527 | 0.606 | 0.568 | 0.589 | 0.464 | 0.066 | 0.000 | 0.051 | 0.000 | 0.526 |
| DUTP_ZN | M | last | 0.515 | 0.518 | 0.473 | 0.558 | 0.577 | 0.459 | 0.016 | 0.326 | 0.014 | 0.226 | 0.518 | |
| IIPD_ZN | M | last | 0.538 | 0.536 | 0.514 | 0.567 | 0.602 | 0.470 | 0.056 | 0.000 | 0.046 | 0.000 | 0.536 | |
| RGDP_ZN | M | last | 0.525 | 0.510 | 0.626 | 0.565 | 0.572 | 0.447 | 0.029 | 0.075 | 0.022 | 0.039 | 0.509 | |
| TOT_ZN | M | last | 0.515 | 0.517 | 0.486 | 0.568 | 0.586 | 0.449 | 0.037 | 0.020 | 0.027 | 0.012 | 0.518 | |
| XBCH_ZN | M | last | 0.524 | 0.524 | 0.500 | 0.568 | 0.591 | 0.456 | 0.032 | 0.044 | 0.023 | 0.034 | 0.524 | |
| XGBAL_ZN | M | last | 0.532 | 0.513 | 0.651 | 0.568 | 0.577 | 0.449 | 0.005 | 0.744 | 0.010 | 0.348 | 0.512 |
Naive PnLs #
dix = dict_lm

sig = "COMP_ZN"
targ = dix["targ"]
cidx = dix["cidx"]
blax = dix["black"]
start = dix["start"]

pnls = msn.NaivePnL(
    df=dfx,
    ret=targ,
    sigs=[sig],
    cids=cidx,
    start=sdate,
    blacklist=fxblack,
    bms=["USD_GB10YXR_NSA", "EUR_FXXR_NSA", "USD_EQXR_NSA"],
)

pnls.make_pnl(
    sig=sig,
    sig_add=0,
    sig_op="raw", # "zn_score_pan",
    rebal_freq="monthly",
    neutral="zero",
    thresh=2,
    rebal_slip=1,
    vol_scale=10,
    pnl_name="PNL0",
)

pnls.make_pnl(
    sig=sig,
    sig_add=1,
    sig_op="zn_score_pan", # "zn_score_pan",
    rebal_freq="monthly",
    neutral="zero",
    thresh=1,
    rebal_slip=1,
    vol_scale=10,
    pnl_name="PNL1",
    winsorize_first=True,
)

pnls.make_long_pnl(vol_scale=10, label="Risk parity")
dix["pnls"] = pnls
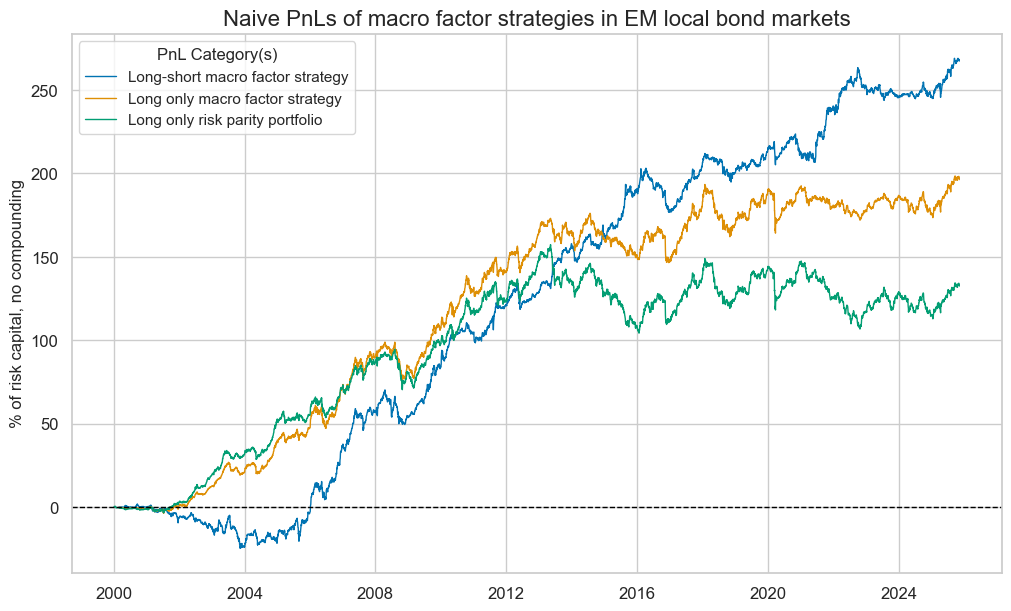
pnls = dix["pnls"]
pnl_labels = {
"PNL0": "Long-short macro factor strategy",
"PNL1": "Long only macro factor strategy",
"Risk parity": "Long only risk parity portfolio",
}
pnls.plot_pnls(
title="Naive PnLs of macro factor strategies in EM local bond markets",
title_fontsize=16,
figsize=(12, 7),
xcat_labels=pnl_labels,
)
display(pnls.evaluate_pnls(["PNL0", "PNL1", "Risk parity"]))
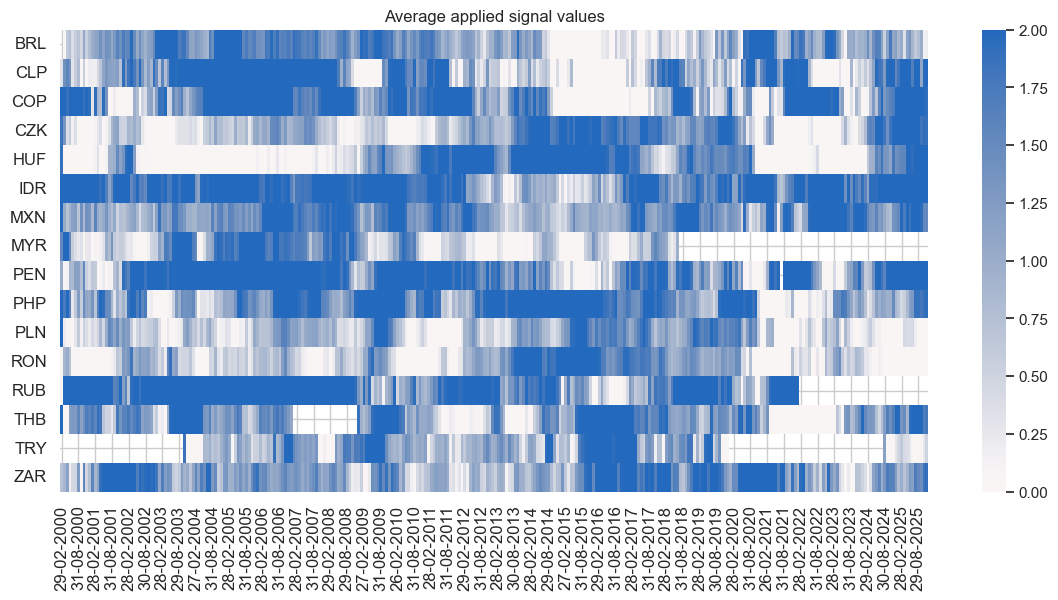
pnls.signal_heatmap(
pnl_name="PNL1",
freq="M",
title="Average applied signal values",
title_fontsize=None,
figsize=(14, 6)
)
| xcat | PNL0 | PNL1 | Risk parity |
|---|---|---|---|
| Return % | 10.410447 | 7.645079 | 5.130162 |
| St. Dev. % | 10.0 | 10.0 | 10.0 |
| Sharpe Ratio | 1.041045 | 0.764508 | 0.513016 |
| Sortino Ratio | 1.526962 | 1.075313 | 0.710554 |
| Max 21-Day Draw % | -16.146929 | -22.946575 | -22.638608 |
| Max 6-Month Draw % | -18.377232 | -24.691496 | -25.167761 |
| Peak to Trough Draw % | -26.572656 | -31.286012 | -53.009082 |
| Top 5% Monthly PnL Share | 0.520985 | 0.631905 | 0.902861 |
| USD_GB10YXR_NSA correl | -0.027386 | 0.023568 | 0.038606 |
| EUR_FXXR_NSA correl | 0.128432 | 0.526235 | 0.575365 |
| USD_EQXR_NSA correl | 0.079573 | 0.243739 | 0.257852 |
| Traded Months | 311 | 311 | 311 |
cids_em
['BRL',
 'CLP',
 'COP',
 'CZK',
 'HUF',
 'IDR',
 'MXN',
 'MYR',
 'PEN',
 'PHP',
 'PLN',
 'RON',
 'RUB',
 'THB',
 'TRY',
 'ZAR']
dix = dict_lm
sigs = sigs = list(set(dix["sigs"]) - set(["COMP_ZN"]))
ret = dix["targ"]
cidx = dix["cidx"]
blax = dix["black"]
start = dix["start"]
single_pnls = msn.NaivePnL(
df=dfx,
ret=targ,
sigs=sigs,
cids=cidx,
start=start,
blacklist=blax,
bms=["USD_GB10YXR_NSA", "EUR_FXXR_NSA", "USD_EQXR_NSA"],
)
for sig in sigs:
single_pnls.make_pnl(
sig=sig,
sig_op="raw",
rebal_freq="monthly",
neutral="zero",
thresh=2,
rebal_slip=1,
vol_scale=10,
)
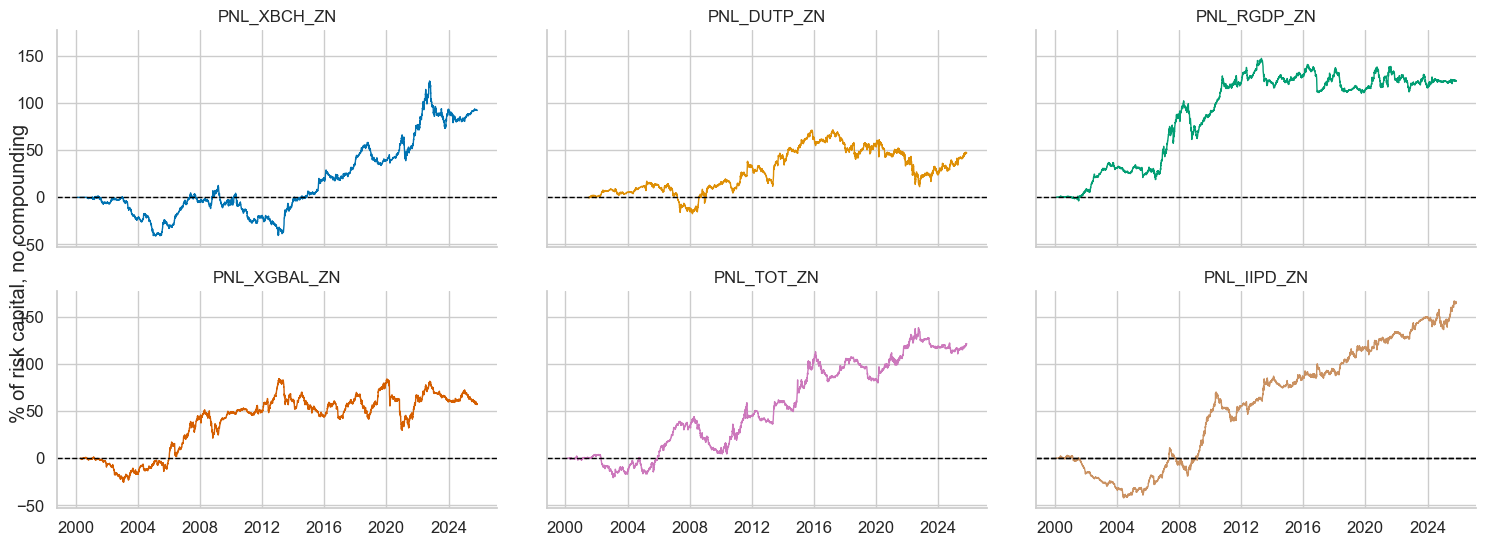
single_pnls.plot_pnls(
title=None,
title_fontsize=18,
xcat_labels=None,
facet=True,
figsize=(12, 10)
)