Terms of trade as trading signals #
import pandas as pd
import numpy as np
import matplotlib.pyplot as plt
import os

import macrosynergy.management as msm
import macrosynergy.panel as msp
import macrosynergy.signal as mss
import macrosynergy.pnl as msn
import macrosynergy.visuals as msv

from IPython.display import display, Markdown
from macrosynergy.management.types import QuantamentalDataFrame

from macrosynergy.download import JPMaQSDownload
from IPython.display import HTML, display

import warnings

warnings.simplefilter("ignore")
# G3 and credit cross-sections

cids_g3 = ["EUR", "JPY", "USD"]

# FX cross-section lists

cids_dmsc_fx = [
    "AUD",
    "CAD",
    "CHF",
    "GBP",
    "NOK",
    "NZD",
    "SEK",
]  # DM small currency areas
cids_latm_fx = ["BRL", "COP", "CLP", "MXN", "PEN"]  # Latam
cids_emea_fx = ["CZK", "HUF", "ILS", "PLN", "RON", "RUB", "TRY", "ZAR"]  # EMEA
cids_emas_fx = ["IDR", "INR", "KRW", "MYR", "PHP", "THB", "TWD"] # Asia

cids_dmfx = cids_dmsc_fx
cids_emfx = cids_latm_fx + cids_emea_fx + cids_emas_fx
cids_fx = cids_dmfx + cids_emfx

cids_eur = ["CHF", "CZK", "HUF", "NOK", "PLN", "RON", "SEK"]  # trading against EUR
cids_eud = ["GBP", "RUB", "TRY"]  # trading against EUR and USD
cids_usd = list(set(cids_fx) - set(cids_eur + cids_eud))  # trading against USD

# Equity-specific lists
cids_dmeq = ["AUD", "CAD", "CHF", "EUR", "GBP", "JPY", "SEK", "USD"]
cids_emeq = ["BRL", "INR", "KRW", "MXN", "MYR", "PLN", "THB", "TRY", "TWD", "ZAR"]
cids_eq = cids_dmeq + cids_emeq
cids_eq.sort()

# Duration-specific lists
cids_dmdu = cids_dmeq + ["NOK", "NZD"]
cids_emdu = cids_emeq + ["CLP", "COP", "CZK", "HUF", "IDR", "ILS", "SGD"]
cids_du = cids_dmdu + cids_emdu

cids_eqdu = [cid for cid in cids_eq if cid in cids_du]


# Full set of cross-sections

cids = list(set(cids_fx) | set(cids_g3))
cids = list(np.sort(cids))
# Categories

ctots = [
    "CTOT_NSA_P1M1ML12",
    "CTOT_NSA_P1W4WL1",
    "CTOT_NSA_P1M12ML1",
    "CTOT_NSA_P1M60ML1",
]

xtra = [
   "REEROADJ_NSA_P1W4WL1",
   "REEROADJ_NSA_P1M1ML12",
   "REEROADJ_NSA_P1M12ML1",
   "REEROADJ_NSA_P1M60ML1",
   "USDGDPWGT_SA_3YMA",
]

rets = [
   "FXTARGETED_NSA",  # Exchange rate target dummy
   "FXUNTRADABLE_NSA",  # Exchange rate untradable dummy
   "FXXR_NSA", # FX forward return, % of notional: dominant cross
   "FXXR_VT10",  # FX forward return for 10% vol target: dominant cross
   "EQXR_NSA",  # Equity index future returns in % of notional
   "EQXR_VT10",  # Equity index future return for 10% vol target
   "DU05YXR_VT10",  # Duration return, for 10% vol target: 5-year maturity
   "DU05YXR_NSA", # Duration return, 5-year maturity

]

xcats = ctots + xtra + rets

# Resultant tickers

tickers = [cid + "_" + xcat for cid in cids for xcat in xcats]
print(f"Maximum number of tickers is {len(tickers)}")
Maximum number of tickers is 510
start_date = "2000-01-01"

# Retrieve credentials

client_id: str = os.getenv("DQ_CLIENT_ID")
client_secret: str = os.getenv("DQ_CLIENT_SECRET")

with JPMaQSDownload(client_id=client_id, client_secret=client_secret) as dq:
    df = dq.download(
        tickers=tickers,
        start_date=start_date,
        suppress_warning=True,
        metrics=["all"],
        report_time_taken=True,
        show_progress=True,
    )
Downloading data from JPMaQS.
Timestamp UTC:  2025-10-06 14:26:51
Connection successful!
Requesting data: 100%|██████████| 128/128 [00:28<00:00,  4.45it/s]
Downloading data: 100%|██████████| 128/128 [00:49<00:00,  2.57it/s]
Time taken to download data: 	86.31 seconds.
Some expressions are missing from the downloaded data. Check logger output for complete list.
170 out of 2550 expressions are missing. To download the catalogue of all available expressions and filter the unavailable expressions, set `get_catalogue=True` in the call to `JPMaQSDownload.download()`.
dfx = df.copy().sort_values(["cid", "xcat", "real_date"])
dfx.info()
<class 'pandas.core.frame.DataFrame'>
Index: 3106836 entries, 0 to 3106835
Data columns (total 8 columns):
 #   Column        Dtype
---  ------        -----
 0   real_date     datetime64[ns]
 1   cid           object
 2   xcat          object
 3   value         float64
 4   grading       float64
 5   eop_lag       float64
 6   mop_lag       float64
 7   last_updated  datetime64[ns]
dtypes: datetime64[ns](2), float64(4), object(2)
memory usage: 213.3+ MB
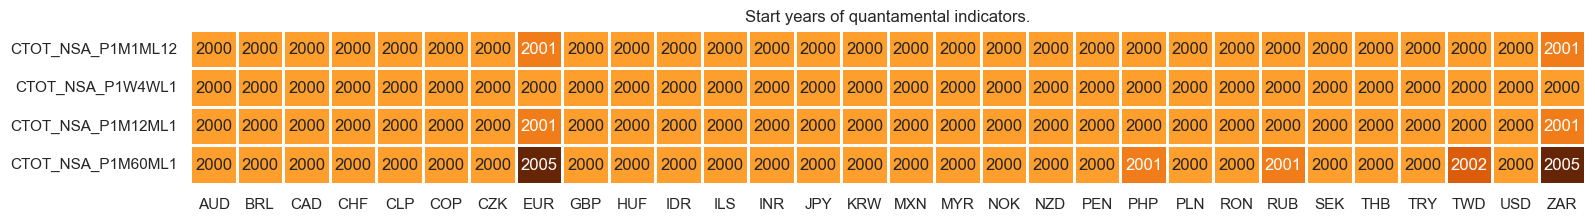
xcatx = ctots
msm.check_availability(dfx, xcats=xcatx, cids=cids, missing_recent=False),
(None,)
dfb = df[df["xcat"].isin(["FXTARGETED_NSA", "FXUNTRADABLE_NSA"])].loc[
    :, ["cid", "xcat", "real_date", "value"]
]
dfba = (
    dfb.groupby(["cid", "real_date"])
    .aggregate(value=pd.NamedAgg(column="value", aggfunc="max"))
    .reset_index()
)
dfba["xcat"] = "FXBLACK"
fxblack = msp.make_blacklist(dfba, "FXBLACK")
fxblack
{'BRL': (Timestamp('2012-12-03 00:00:00'), Timestamp('2013-09-30 00:00:00')),
 'CHF': (Timestamp('2011-10-03 00:00:00'), Timestamp('2015-01-30 00:00:00')),
 'CZK': (Timestamp('2014-01-01 00:00:00'), Timestamp('2017-07-31 00:00:00')),
 'ILS': (Timestamp('2000-01-03 00:00:00'), Timestamp('2005-12-30 00:00:00')),
 'INR': (Timestamp('2000-01-03 00:00:00'), Timestamp('2004-12-31 00:00:00')),
 'MYR_1': (Timestamp('2000-01-03 00:00:00'), Timestamp('2007-11-30 00:00:00')),
 'MYR_2': (Timestamp('2018-07-02 00:00:00'), Timestamp('2025-10-03 00:00:00')),
 'PEN': (Timestamp('2021-07-01 00:00:00'), Timestamp('2021-07-30 00:00:00')),
 'RON': (Timestamp('2000-01-03 00:00:00'), Timestamp('2005-11-30 00:00:00')),
 'RUB_1': (Timestamp('2000-01-03 00:00:00'), Timestamp('2005-11-30 00:00:00')),
 'RUB_2': (Timestamp('2022-02-01 00:00:00'), Timestamp('2025-10-03 00:00:00')),
 'THB': (Timestamp('2007-01-01 00:00:00'), Timestamp('2008-11-28 00:00:00')),
 'TRY_1': (Timestamp('2000-01-03 00:00:00'), Timestamp('2003-09-30 00:00:00')),
 'TRY_2': (Timestamp('2020-01-01 00:00:00'), Timestamp('2024-07-31 00:00:00'))}
Transformations and setups #
Features #
Adjusted terms of trade changes #
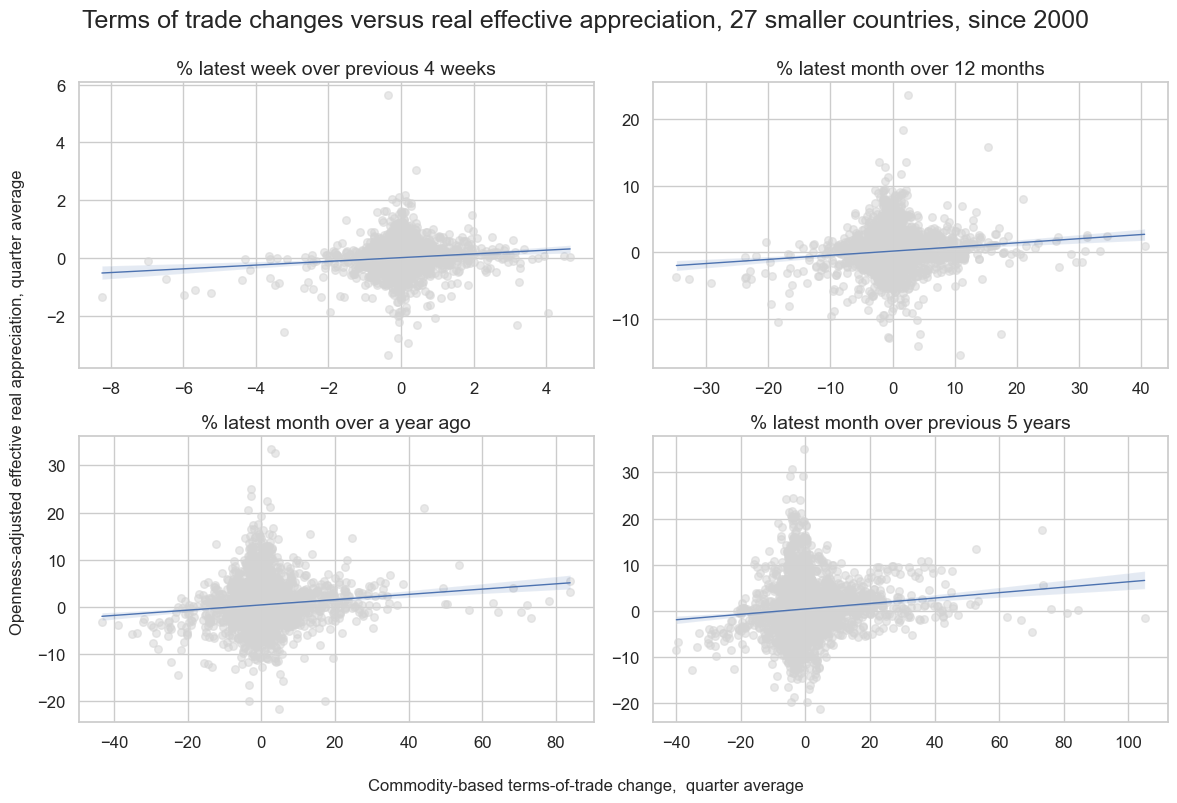
# Check for positive relation

cidx = cids_fx

dict_looks = {
    "P1W4WL1": "% latest week over previous 4 weeks",
    "P1M12ML1": "% latest month over 12 months",
    "P1M1ML12": "% latest month over a year ago",
    "P1M60ML1": "% latest month over previous 5 years",
}

cr = {
    k: msp.CategoryRelations(
        dfx,
        xcats=["CTOT_NSA_" + k, "REEROADJ_NSA_" + k],
        cids=cidx,
        freq="Q",
        lag=0,
        xcat_aggs=["mean", "mean"],
        start="2000-01-01",
    )
    for k in dict_looks.keys()
}

cat_rels = [cr[k] for k in dict_looks.keys()]
subtitles = [v for v in dict_looks.values()]

msv.multiple_reg_scatter(
    cat_rels=cat_rels,
    title="Terms of trade changes versus real effective appreciation, 27 smaller countries, since 2000",
    title_fontsize=18,
    xlab="Commodity-based terms-of-trade change,  quarter average",
    ylab="Openness-adjusted effective real appreciation, quarter average",
    ncol=2,
    nrow=2,
    figsize=(12, 8),
    prob_est="map",
    coef_box=None,
    subplot_titles=subtitles,
    share_axes=False,
)
# Normalized changes

base_cats =["CTOT_NSA", "REEROADJ_NSA"]
xcatx = [b + "_" + k for b in base_cats for k in dict_looks.keys()]

for xcat in xcatx:
    dfa = msp.make_zn_scores(
        dfx,
        xcat=xcat,
        cids=cids,
        sequential=True,
        min_obs=261 * 5,
        neutral="zero",
        pan_weight=0,  # very different panels
        thresh=3,
        postfix="_ZN",
        est_freq="m",
    )
    dfx = msm.update_df(dfx, dfa)
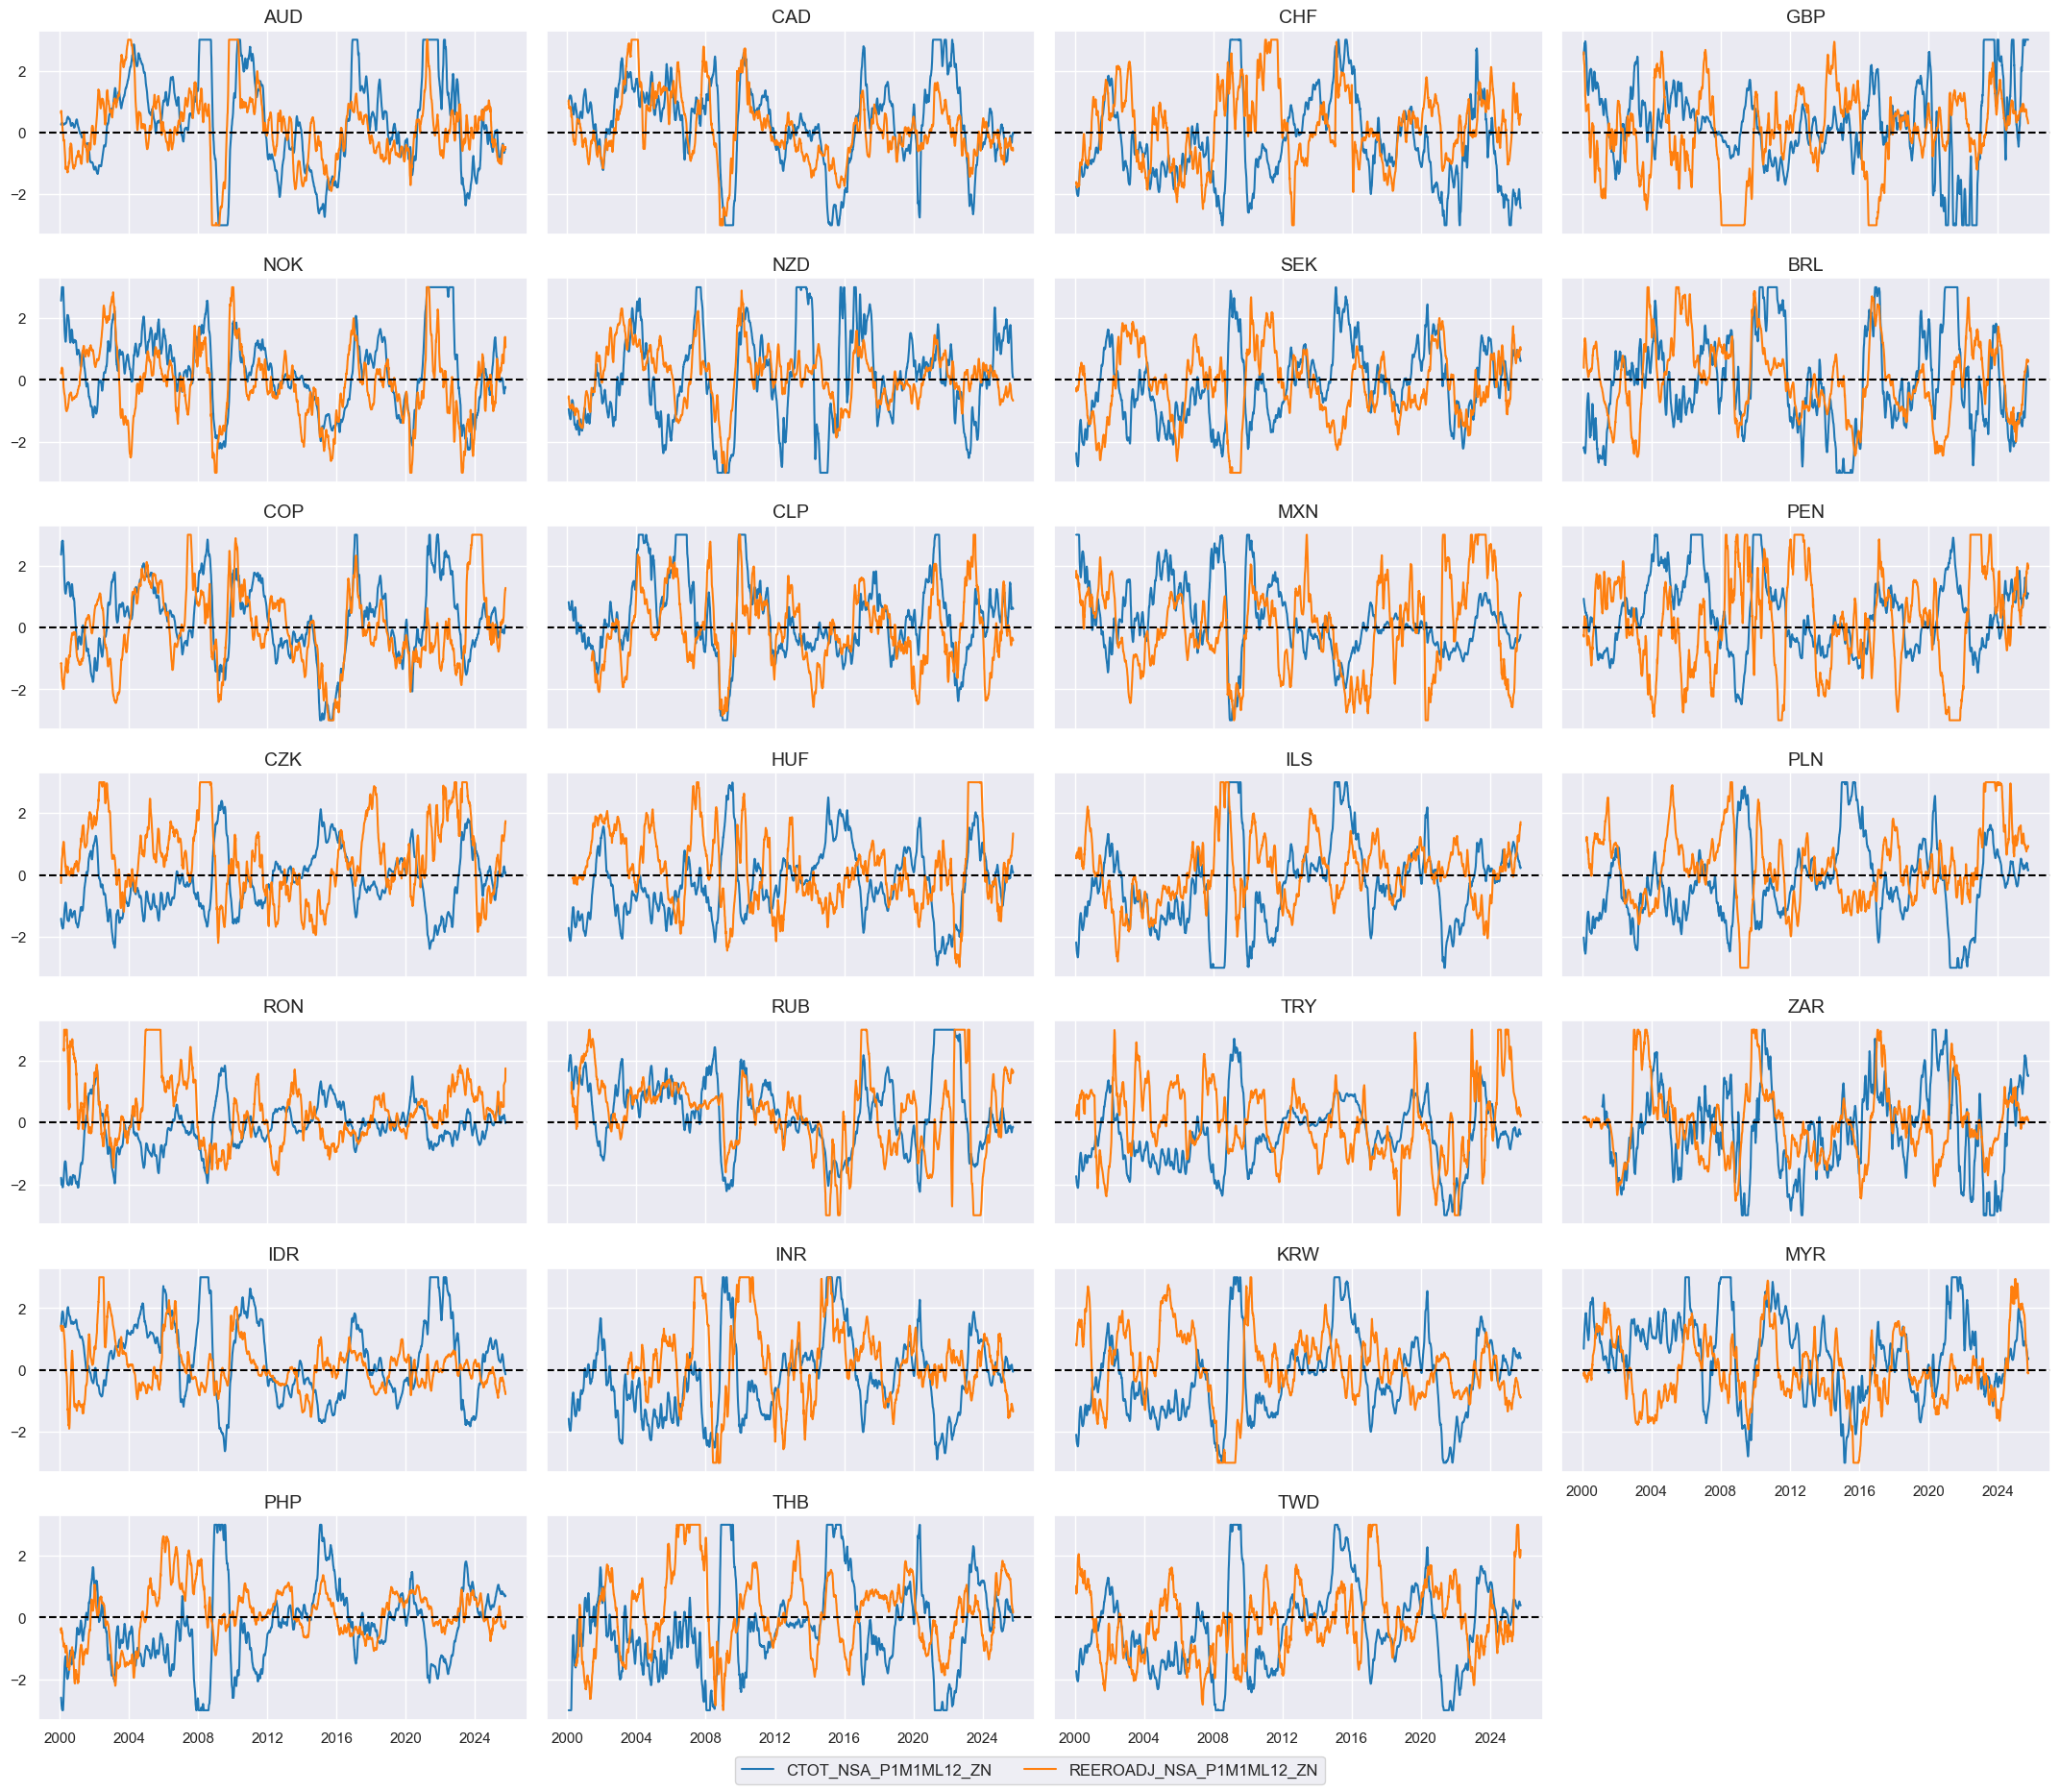
# Inspection

chg = "P1M1ML12"
xcatx = [b + "_" + chg + "_ZN" for b in base_cats]
cidx = cids_fx

msp.view_timelines(
    dfx,
    xcats=xcatx,
    cids=cidx,
    ncol=4,
    aspect=2,
    height=1.8,
    start="2000-01-01",
    same_y=True,
)
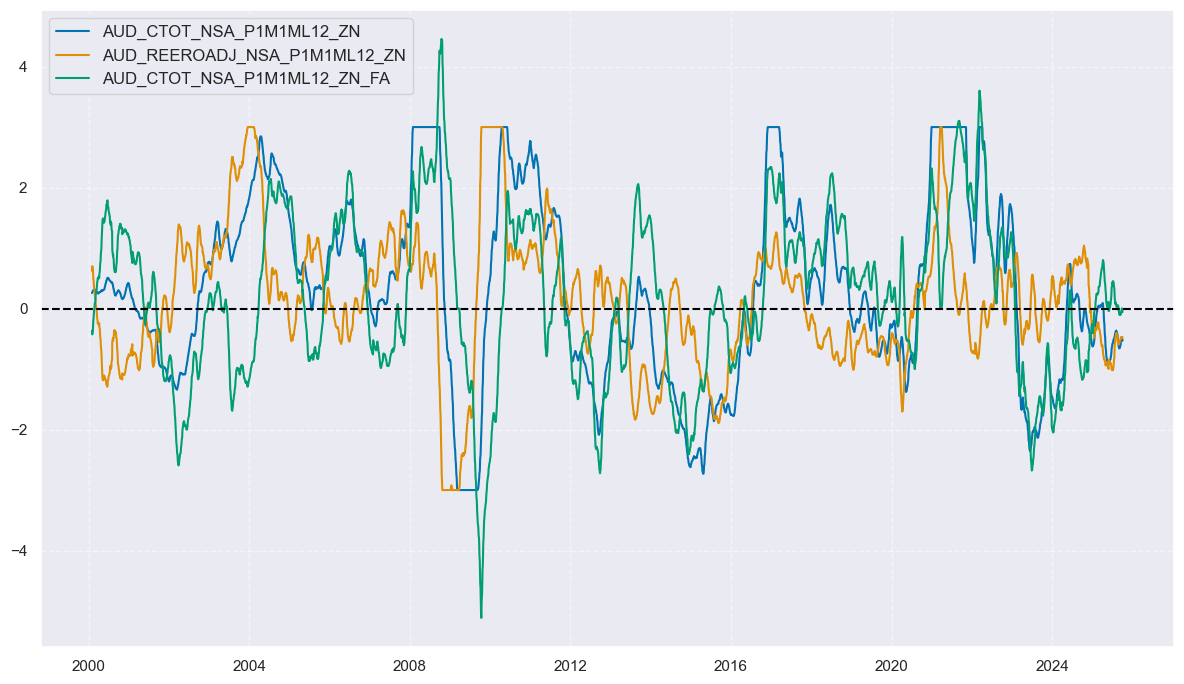
# Full and half adjustment of terms of trade changes

cidx = cids

calcs = []
dict_weights = {"_FA": 1, "_HA": 0.5}

for k, v in dict_weights.items():
    for chg in dict_looks.keys():
        calcs += [f"CTOT_NSA_{chg}_ZN{k} = CTOT_NSA_{chg}_ZN - REEROADJ_NSA_{chg}_ZN * {v}"]

dfa = msp.panel_calculator(dfx, calcs=calcs, cids=cidx)
dfx = msm.update_df(dfx, dfa)
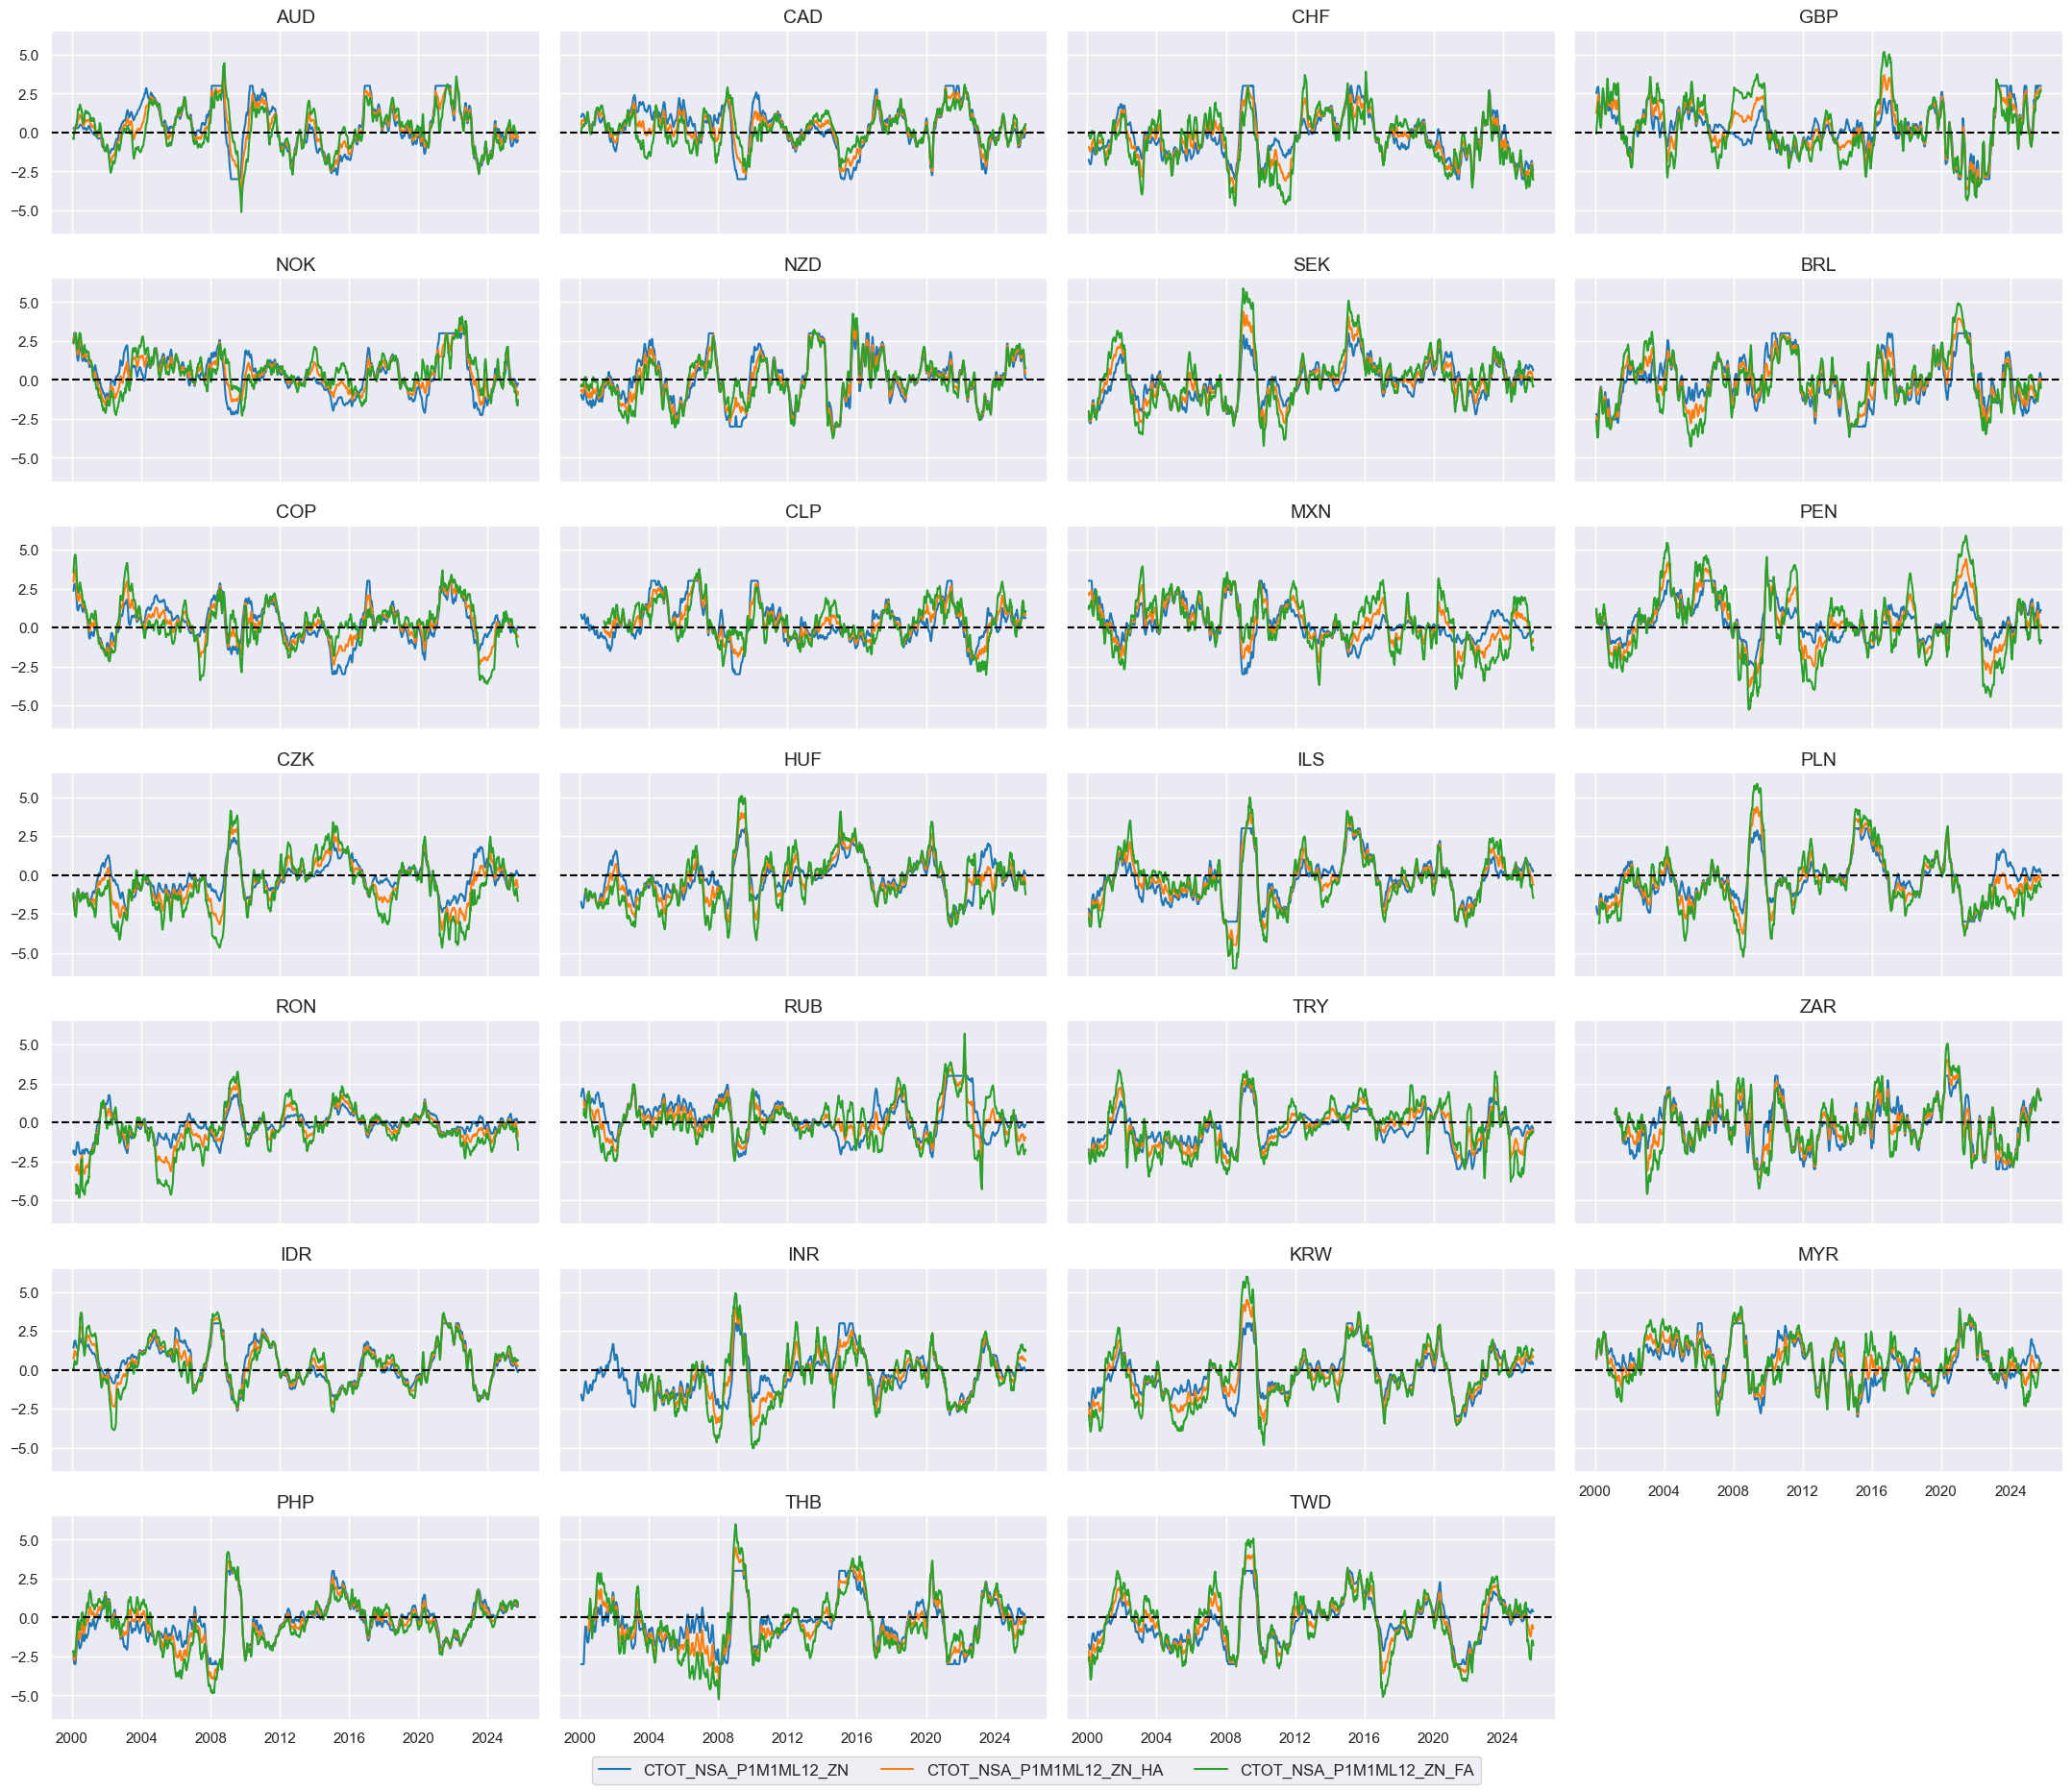
# Inspection

chg = "P1M1ML12"
xcatx = [
    f"CTOT_NSA_{chg}_ZN",
    f"REEROADJ_NSA_{chg}_ZN",
    f"CTOT_NSA_{chg}_ZN_FA",
]
cidx = cids_fx[:1]

msp.view_timelines(
    dfx,
    xcats=xcatx,
    cids=cidx,
    ncol=1,
    start="2000-01-01",
    same_y=True,
)
# Inspection
chg = "P1M1ML12"
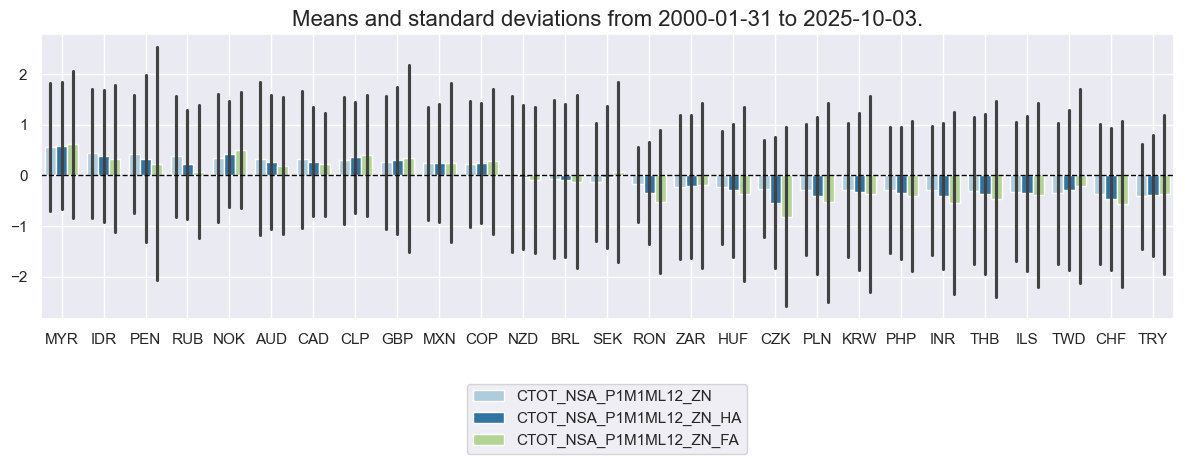
xcatx = [f"CTOT_NSA_{chg}_ZN" , f"CTOT_NSA_{chg}_ZN_HA" , f"CTOT_NSA_{chg}_ZN_FA"]
cidx = cids_fx
msp.view_ranges(
dfx,
xcats=xcatx,
cids=cidx,
sort_cids_by="mean",
size=(12, 5)
)
msp.view_timelines(
dfx,
xcats=xcatx,
cids=cidx,
ncol=4,
aspect=2,
height=1.8,
start="2000-01-01",
same_y=True,
)
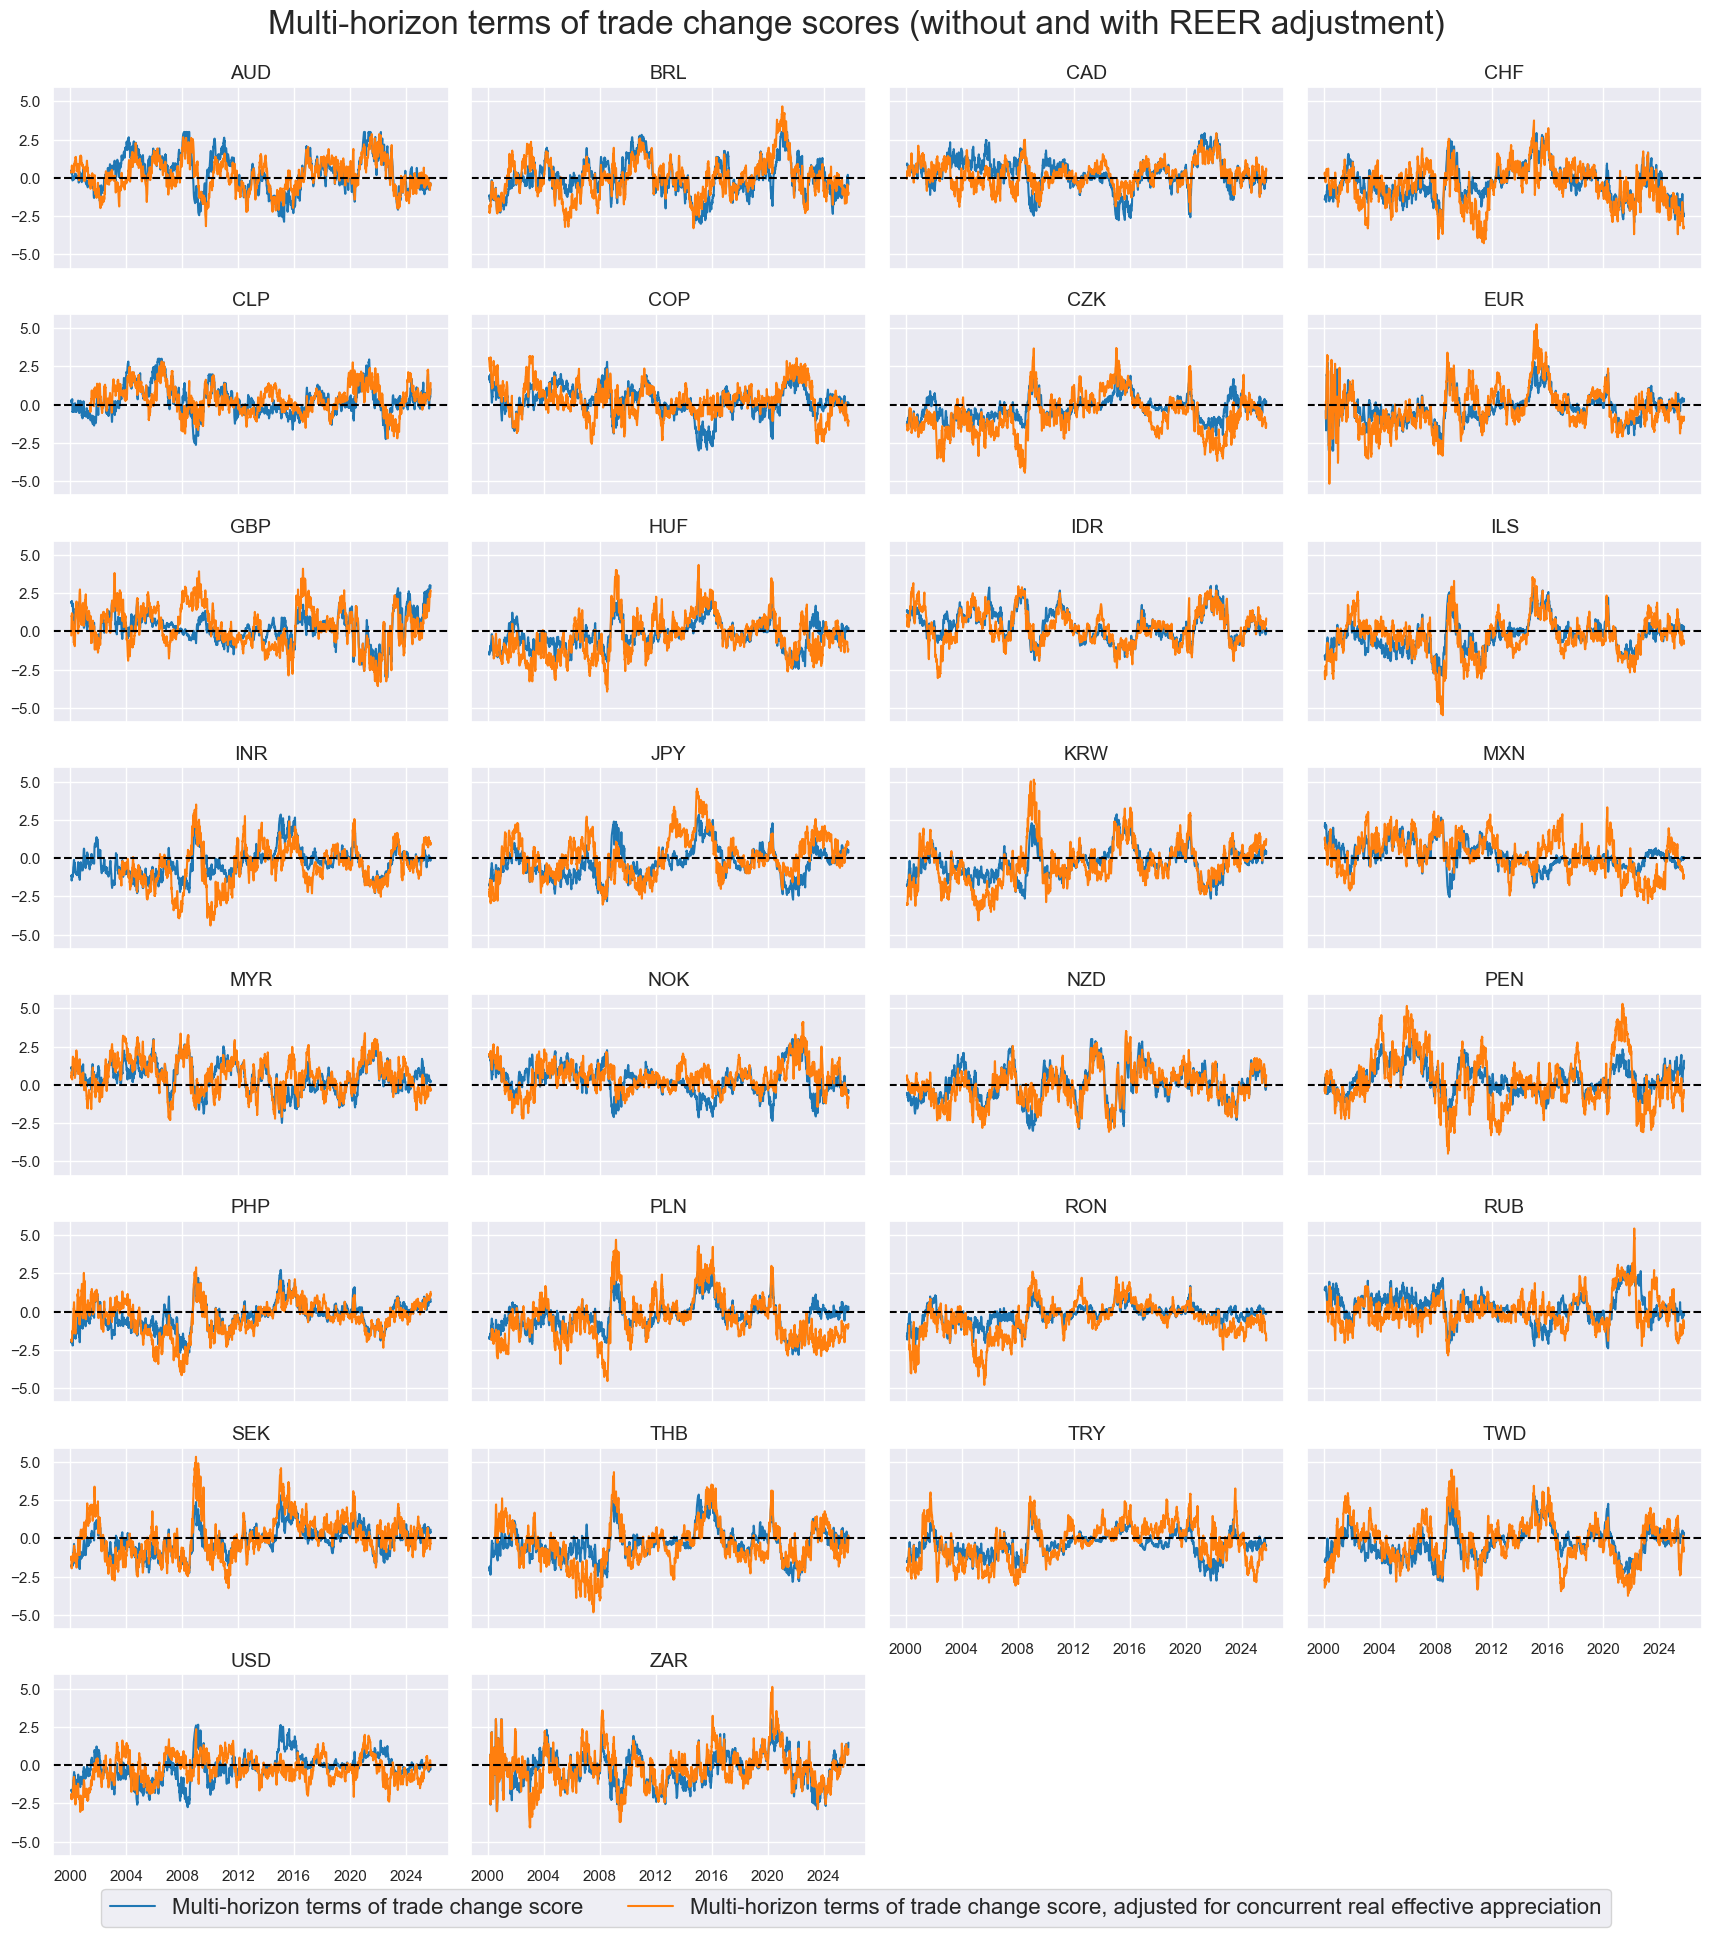
Multi-horizon terms of trade changes #
# Governance dictionary of multi-horizon changes

ads = ["", "_HA", "_FA"]
chgs = [k for k in dict_looks.keys()]
dict_horizons = {f"CTOT_NSA_CHG_ZN{ad}": [f"CTOT_NSA_{chg}_ZN{ad}" for chg in chgs] for ad in ads}

cidx = cids

dfa = pd.DataFrame(columns=list(dfx.columns))

for new, xcatx in dict_horizons.items():
    dfaa = msp.linear_composite(
        df=dfx,
        xcats=xcatx,
        cids=cidx,
        complete_xcats=False,
        new_xcat=new,
    )
    dfa = msm.update_df(dfa, dfaa)

dfx = msm.update_df(dfx, dfa)

multis = list(dict_horizons.keys())
# Inspection

multis_labs = {
    "CTOT_NSA_CHG_ZN": "Multi-horizon terms of trade change score",
    "CTOT_NSA_CHG_ZN_FA": "Multi-horizon terms of trade change score, adjusted for concurrent real effective appreciation",
}

xcatx = ['CTOT_NSA_CHG_ZN', 'CTOT_NSA_CHG_ZN_FA']
cidx = cids

msp.view_timelines(
    dfx,
    xcats=xcatx,
    cids=cidx,
    ncol=4,
    aspect=1.8,
    height=1.6,
    start="2000-01-01",
    same_y=True,
    title="Multi-horizon terms of trade change scores (without and with REER adjustment)",
    title_fontsize=24,
    xcat_labels=multis_labs,
    legend_fontsize=16,
)
Group terms of trade changes #
# All terms of trade changes

chgs = [k for k in dict_looks.keys()]
all_tots = []
for chg in chgs:
    all_tots.extend([f"CTOT_NSA_{chg}_ZN", f"CTOT_NSA_{chg}_ZN_HA", f"CTOT_NSA_{chg}_ZN_FA"])

all_tots.extend(multis)
# Global weighted composites of changes metrics

xcatx = all_tots

dict_globals = {"GLED": cids_eq}

dfa = pd.DataFrame(columns=dfx.columns)

for k, v in dict_globals.items():
    for xc in xcatx:
        dfaa = msp.linear_composite(
            dfx,
            xcats=[xc],
            cids=v,
            weights="USDGDPWGT_SA_3YMA",  # USD GDP weights
            new_cid=k,
        )
        dfa = msm.update_df(dfa, dfaa)

dfx = msm.update_df(dfx, dfa)
Relative terms-of-trade changes #
Equity #
# Custom blacklist for equity

xcatx = ["EQXR_NSA"]


dfxx = dfx[dfx["xcat"].isin(xcatx) & dfx["cid"].isin(cidx)]

dfxx_m = (
    dfxx.groupby(["cid", "xcat"], as_index=True)
       .resample("M", on="real_date")
       .agg(value=("value", "sum"))
       .reset_index()
)

calcs = [f"EQ_BLACK = {xcatx[0]} / {xcatx[0]} - 1"] # returns zero if data present
dfa = msp.panel_calculator(dfxx_m, cids=cidx, calcs=calcs)
eq_black = msp.make_blacklist(dfa, "EQ_BLACK", nan_black=True) # blacklist if no data to avoid inclusion in relative basket calculations

eq_black
{'AUD': (Timestamp('2000-01-31 00:00:00'), Timestamp('2000-04-30 00:00:00')),
 'INR': (Timestamp('2000-01-31 00:00:00'), Timestamp('2000-08-31 00:00:00')),
 'PLN': (Timestamp('2000-01-31 00:00:00'), Timestamp('2013-08-31 00:00:00')),
 'SEK': (Timestamp('2000-01-31 00:00:00'), Timestamp('2005-01-31 00:00:00')),
 'THB': (Timestamp('2000-01-31 00:00:00'), Timestamp('2006-04-30 00:00:00')),
 'TRY': (Timestamp('2000-01-31 00:00:00'), Timestamp('2005-01-31 00:00:00'))}
# Relative terms of trade changes versus equity baskets

xcatx = all_tots
cidx = cids_eq

region_map = {"vGEQ": cids_eq}

for postfix, cidx in region_map.items():
    dfa = msp.make_relative_value(
        dfx,
        xcats=xcatx,
        cids=cidx,
        start="2000-01-01",
        rel_meth="subtract",
        complete_cross=False,
        blacklist=eq_black,
        postfix=postfix,
    )
    dfx = msm.update_df(dfx, dfa)
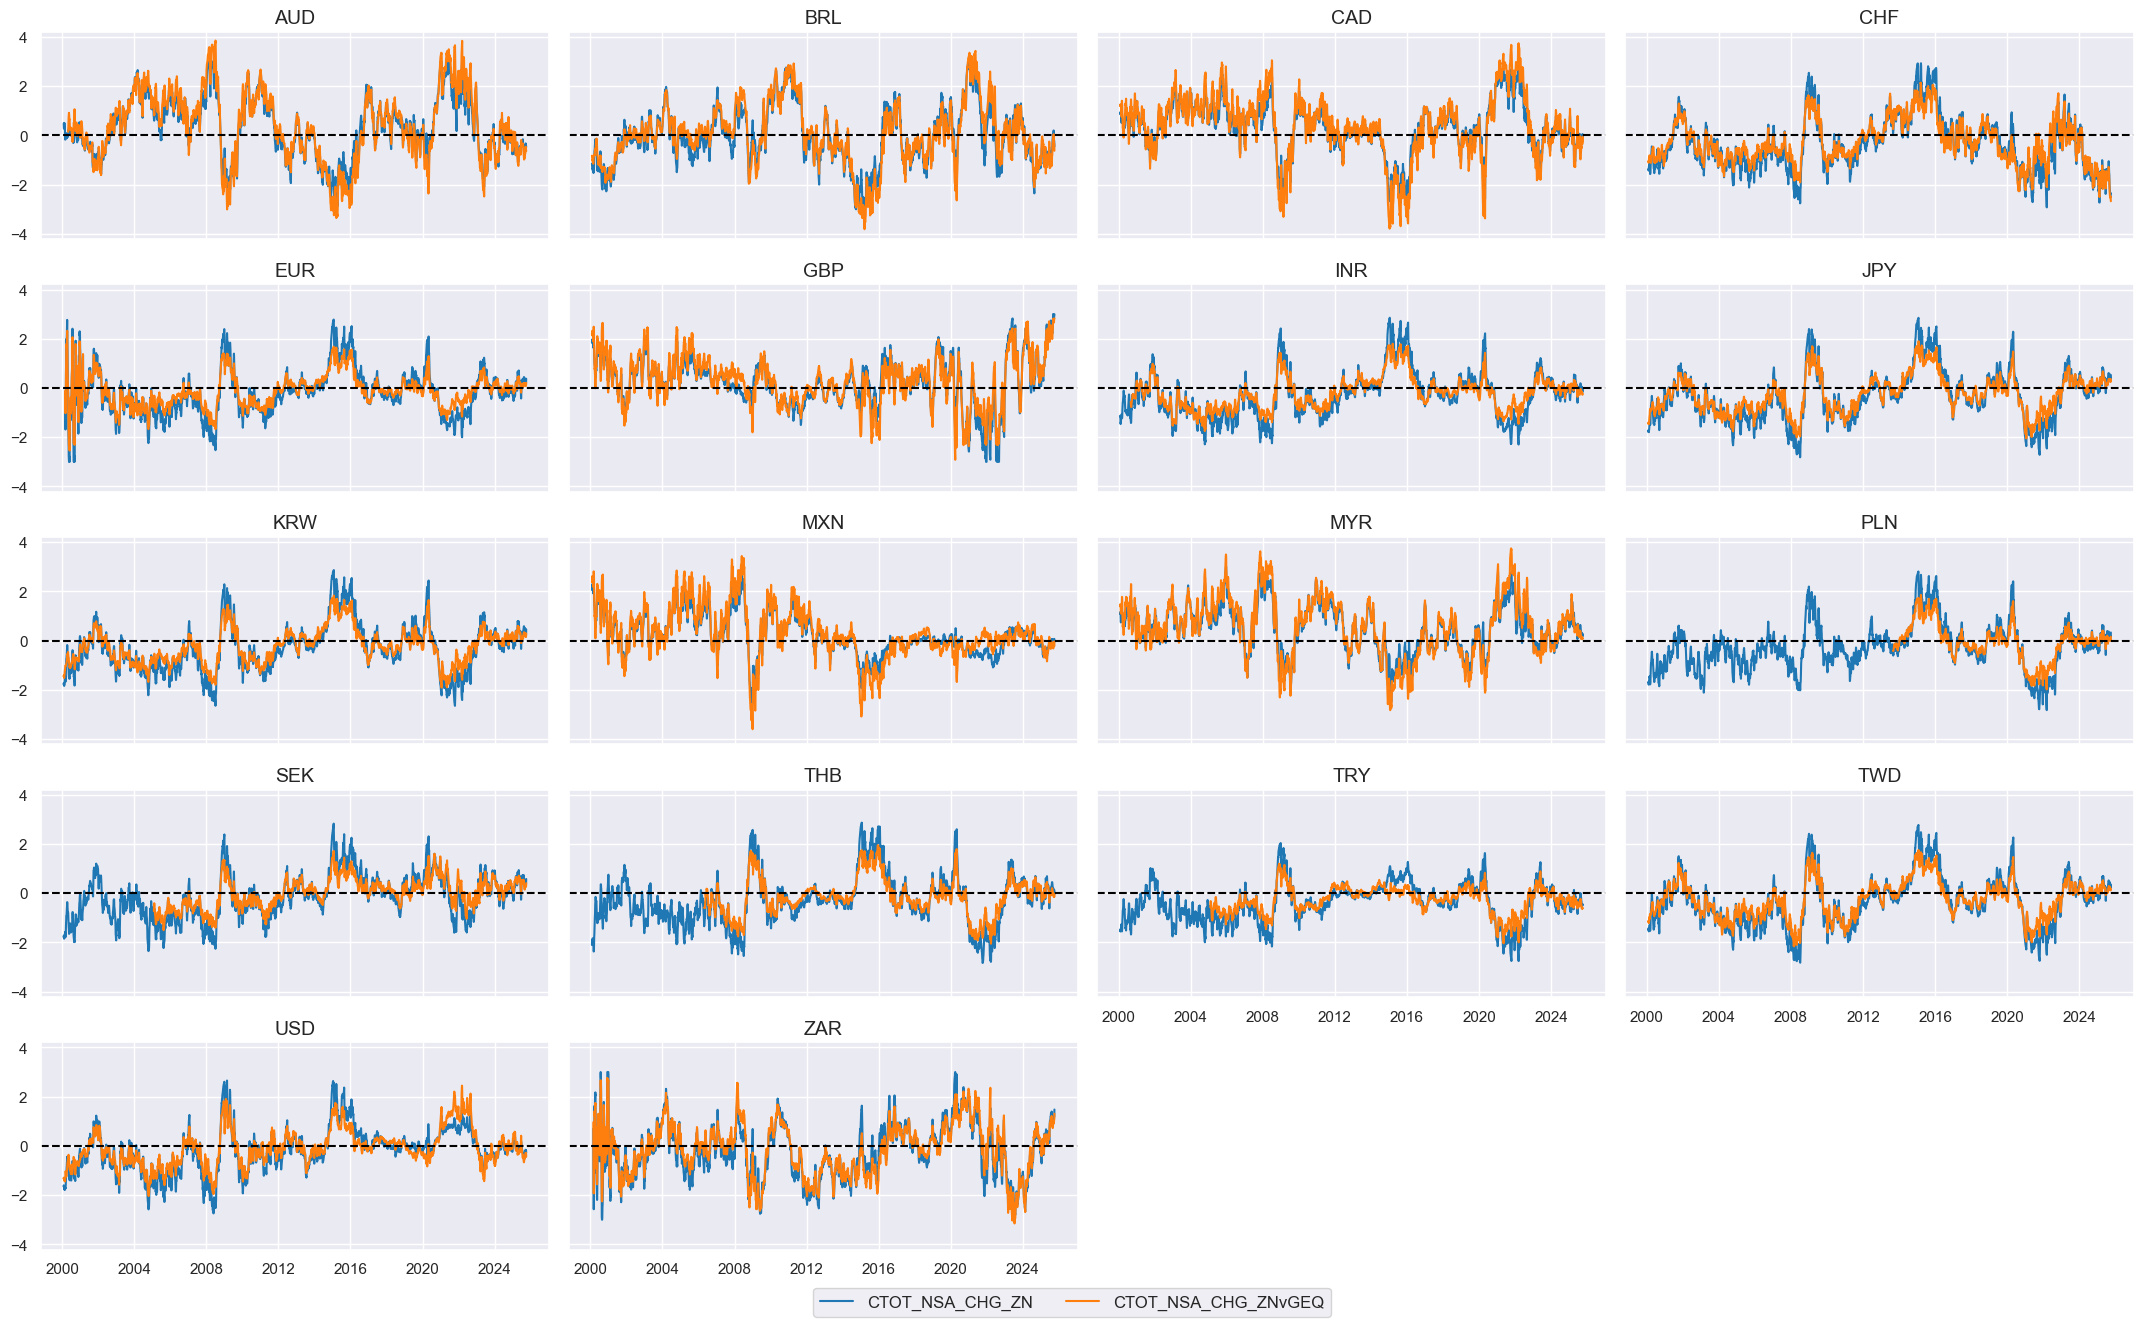
# Inspection

chg = "CHG"  # 'P1W4WL1', 'P1M1ML12', 'P1M12ML1', 'P1M60ML1' 'CHG'
xcatx = [f"CTOT_NSA_{chg}_ZN" , f"CTOT_NSA_{chg}_ZNvGEQ"]
cidx = cids_eq

msp.view_timelines(
    dfx,
    xcats=xcatx,
    cids=cidx,
    ncol=4,
    aspect=2,
    height=1.8,
    start="2000-01-01",
    same_y=True,
)
Equity duration risk parity #
# Custom blacklist for equity duration

cidx = cids_eqdu
xcatx = ["EQXR_VT10", "DU05YXR_VT10"]

dfxx = dfx[dfx["xcat"].isin(xcatx) & dfx["cid"].isin(cidx)]

# use monthly resumplig to reduce calculation time for blacklist creation
dfxx_m = (
    dfxx.groupby(["cid", "xcat"])
    .resample("M", on="real_date")
    .agg(value=("value", "sum"))
    .reset_index()
)

calcs = [f"EQDU_BLACK = {xcatx[0]} / {xcatx[0]} + {xcatx[1]} / {xcatx[1]} - 2"] # returns zero if data present for both equity and duration returns
dfa = msp.panel_calculator(dfxx_m, cids=cidx, calcs=calcs)
eqdu_black = msp.make_blacklist(dfa, "EQDU_BLACK" ,nan_black=True)
eqdu_black
{'AUD': (Timestamp('2000-01-31 00:00:00'), Timestamp('2001-06-30 00:00:00')),
 'BRL': (Timestamp('2000-01-31 00:00:00'), Timestamp('2008-07-31 00:00:00')),
 'INR': (Timestamp('2000-01-31 00:00:00'), Timestamp('2006-04-30 00:00:00')),
 'KRW': (Timestamp('2000-01-31 00:00:00'), Timestamp('2006-04-30 00:00:00')),
 'MXN': (Timestamp('2000-01-31 00:00:00'), Timestamp('2005-12-31 00:00:00')),
 'MYR': (Timestamp('2000-01-31 00:00:00'), Timestamp('2005-12-31 00:00:00')),
 'PLN': (Timestamp('2000-01-31 00:00:00'), Timestamp('2013-08-31 00:00:00')),
 'SEK_1': (Timestamp('2000-01-31 00:00:00'), Timestamp('2005-01-31 00:00:00')),
 'SEK_2': (Timestamp('2008-04-30 00:00:00'), Timestamp('2008-05-31 00:00:00')),
 'THB': (Timestamp('2000-01-31 00:00:00'), Timestamp('2006-04-30 00:00:00')),
 'TRY': (Timestamp('2000-01-31 00:00:00'), Timestamp('2009-07-31 00:00:00')),
 'TWD': (Timestamp('2000-01-31 00:00:00'), Timestamp('2006-04-30 00:00:00')),
 'ZAR': (Timestamp('2000-01-31 00:00:00'), Timestamp('2001-05-31 00:00:00'))}
Relative values for FX countries #
# Relative values for FX countries

cidx = cids_fx
xcatx = all_tots

dfa = msp.make_relative_value(
    dfx,
    xcats=xcatx,
    cids=cidx,
    blacklist=fxblack,
    complete_cross=False,
    postfix="vGFX",
)

dfx = msm.update_df(dfx, dfa)
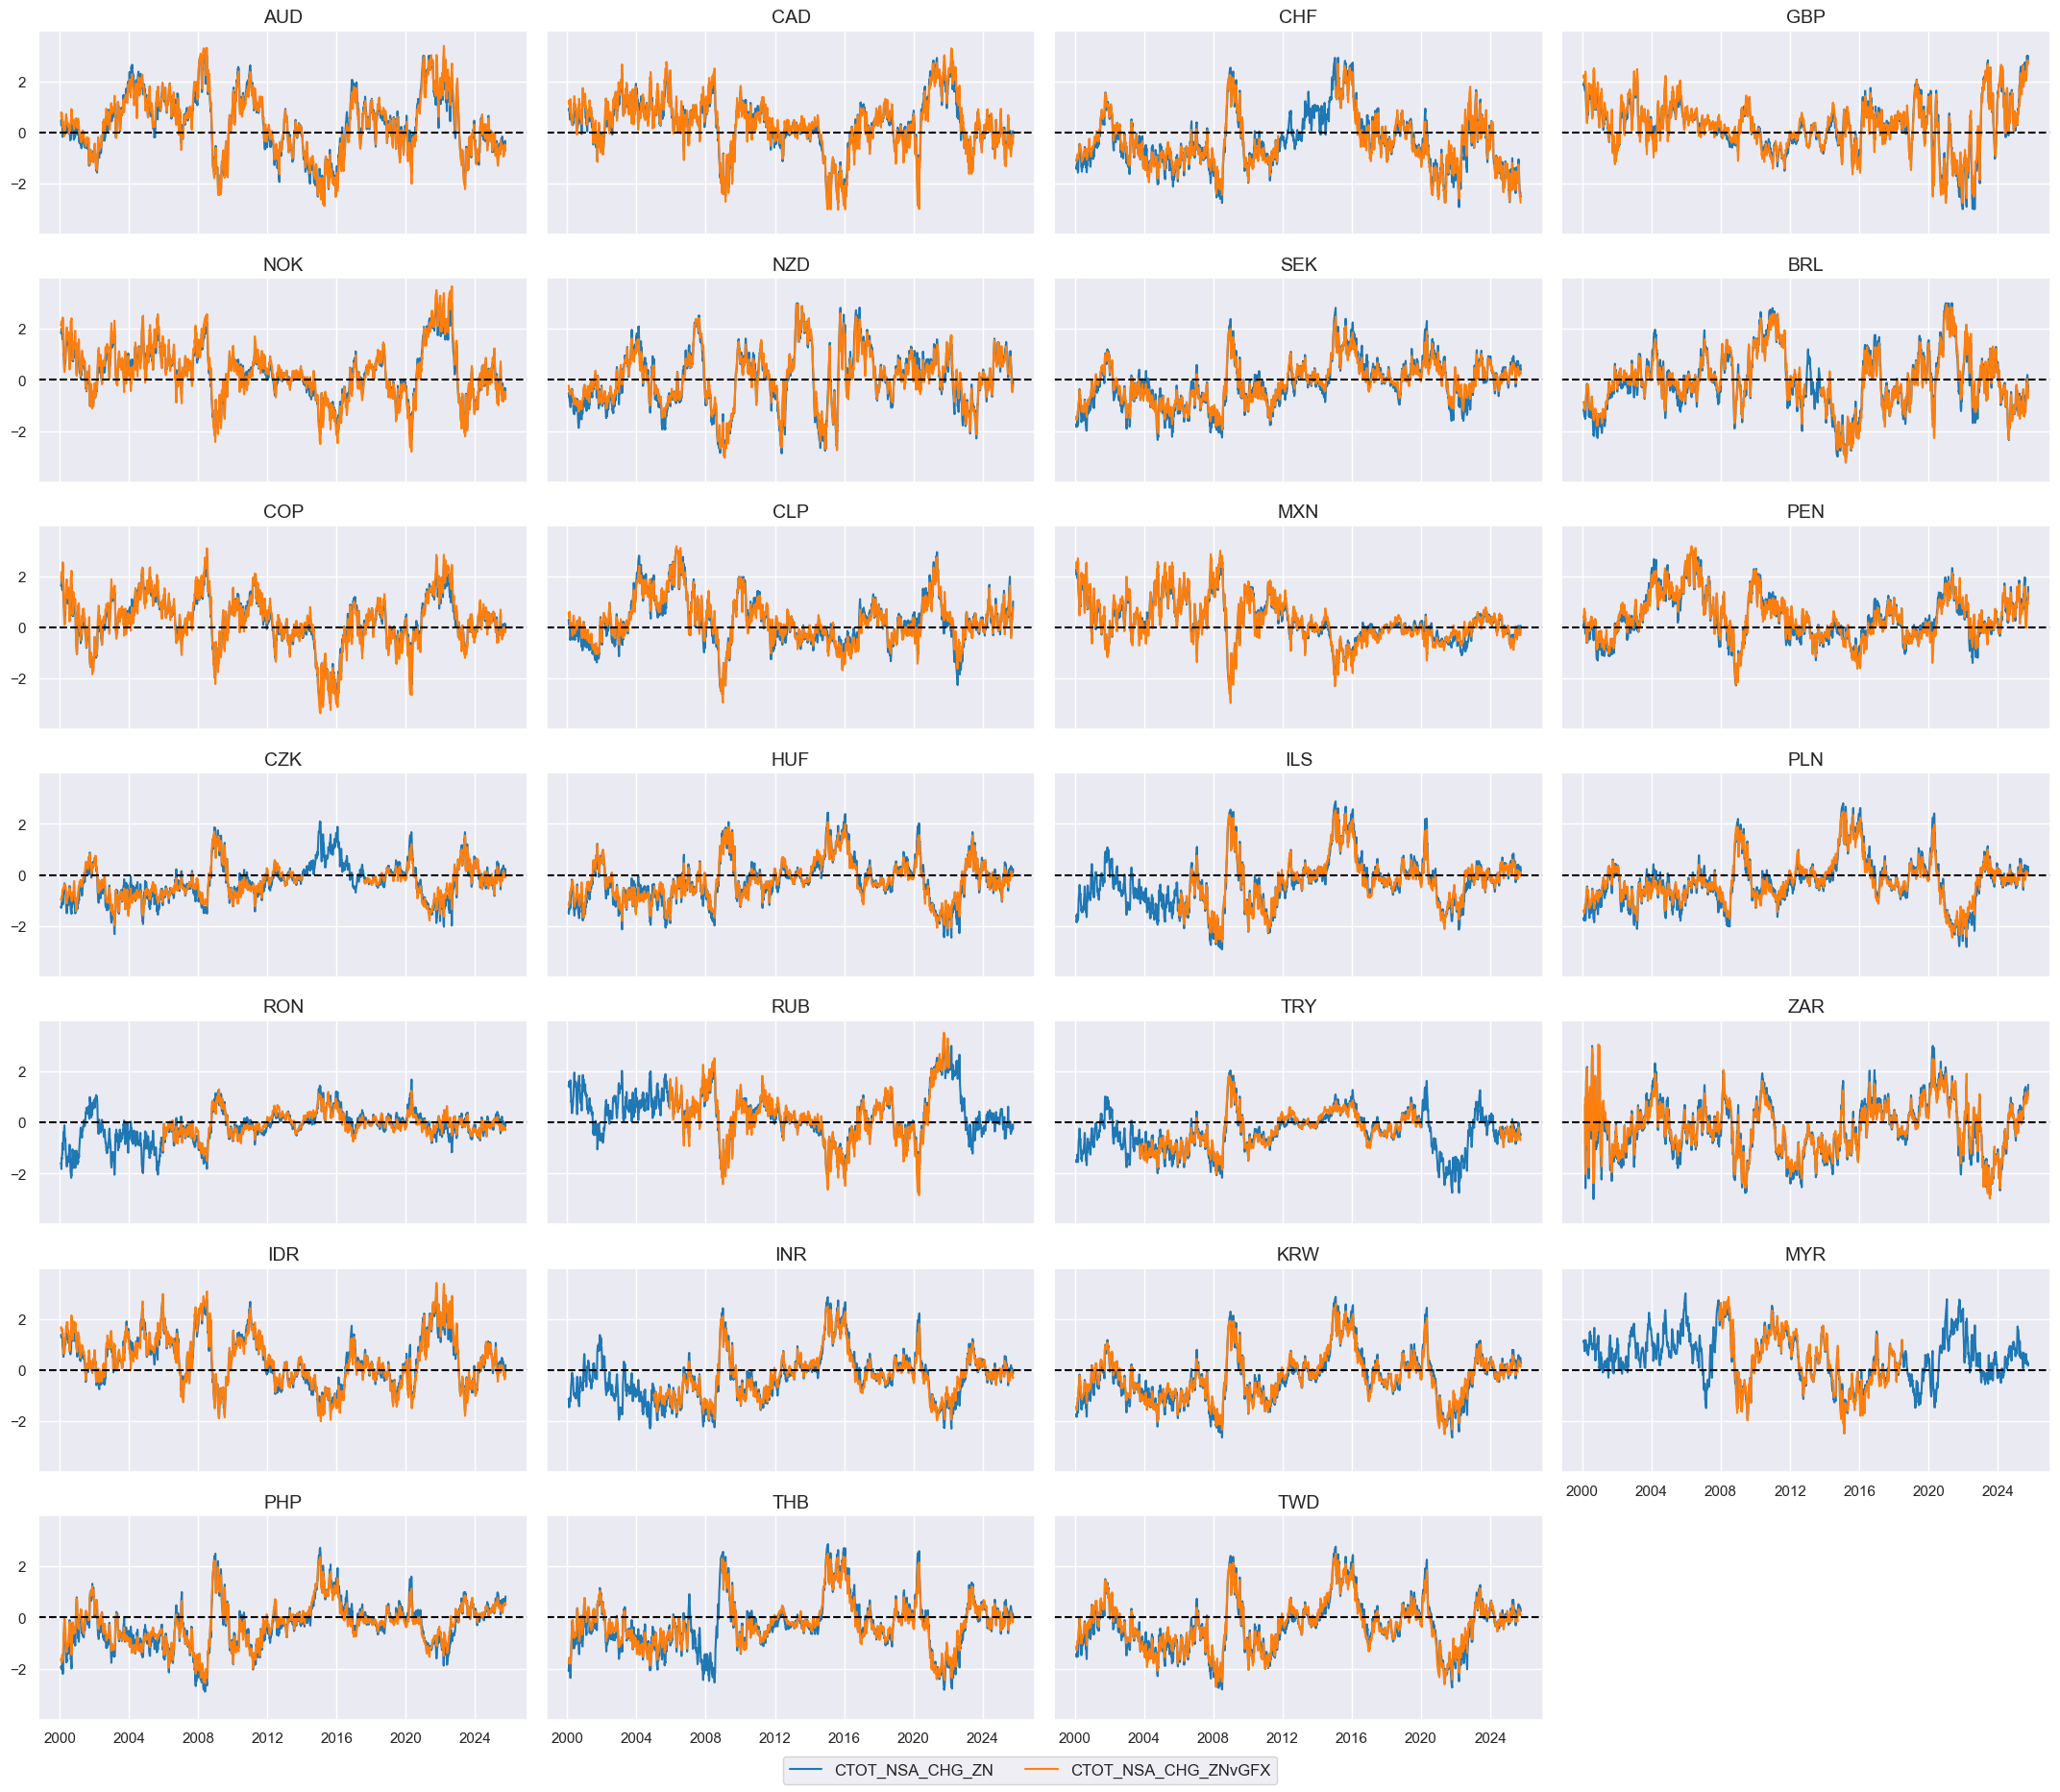
# Inspection

chg = "CHG"
xcatx = [f"CTOT_NSA_{chg}_ZN" , f"CTOT_NSA_{chg}_ZNvGFX"]
cidx = cids_fx

msp.view_timelines(
    dfx,
    xcats=xcatx,
    cids=cidx,
    ncol=4,
    aspect=2,
    height=1.8,
    start="2000-01-01",
    same_y=True,
)
Targets #
Additonal directional returns #
# Risk parity returns

cidx = cids_eqdu

calc_edc = ["EQDUXR_RP = EQXR_VT10 + DU05YXR_VT10",
            "EQvDUXR_RP = EQXR_VT10 - DU05YXR_VT10"]

dfa = msp.panel_calculator(dfx, calcs=calc_edc, cids=cidx)
dfx = msm.update_df(dfx, dfa)

# Vol estimation of long-long risk parity positions

dfa = msp.historic_vol(
    dfx, xcat="EQDUXR_RP", cids=cidx, lback_meth="xma", postfix="_ASD"
)
dft = dfa.pivot(index="real_date", columns="cid", values="value")
dftx = dft.resample("BM").last().reindex(dft.index).ffill().shift(1)
dfax = dftx.unstack().reset_index().rename({0: "value"}, axis=1)
dfax["xcat"] = "EQDUXR_RP_ASDML1"
dfx = msm.update_df(dfx, dfax)

# Vol estimation of long-short risk parity positions

dfa = msp.historic_vol(
    dfx, xcat="EQvDUXR_RP", cids=cidx, lback_meth="xma", postfix="_ASD"
)
dft = dfa.pivot(index="real_date", columns="cid", values="value")
dftx = dft.resample("BM").last().reindex(dft.index).ffill().shift(1)
dfax = dftx.unstack().reset_index().rename({0: "value"}, axis=1)
dfax["xcat"] = "EQvDUXR_RP_ASDML1"
dfx = msm.update_df(dfx, dfax)

# Vol-target risk parity returns

calc_vaj = [
    "EQDUXR_RPVT10 = 10 * EQDUXR_RP / EQDUXR_RP_ASDML1",
    "EQvDUXR_RPVT10 = 10 * EQvDUXR_RP / EQvDUXR_RP_ASDML1",
]
dfa = msp.panel_calculator(dfx, calcs=calc_vaj, cids=cidx)
dfx = msm.update_df(dfx, dfa)
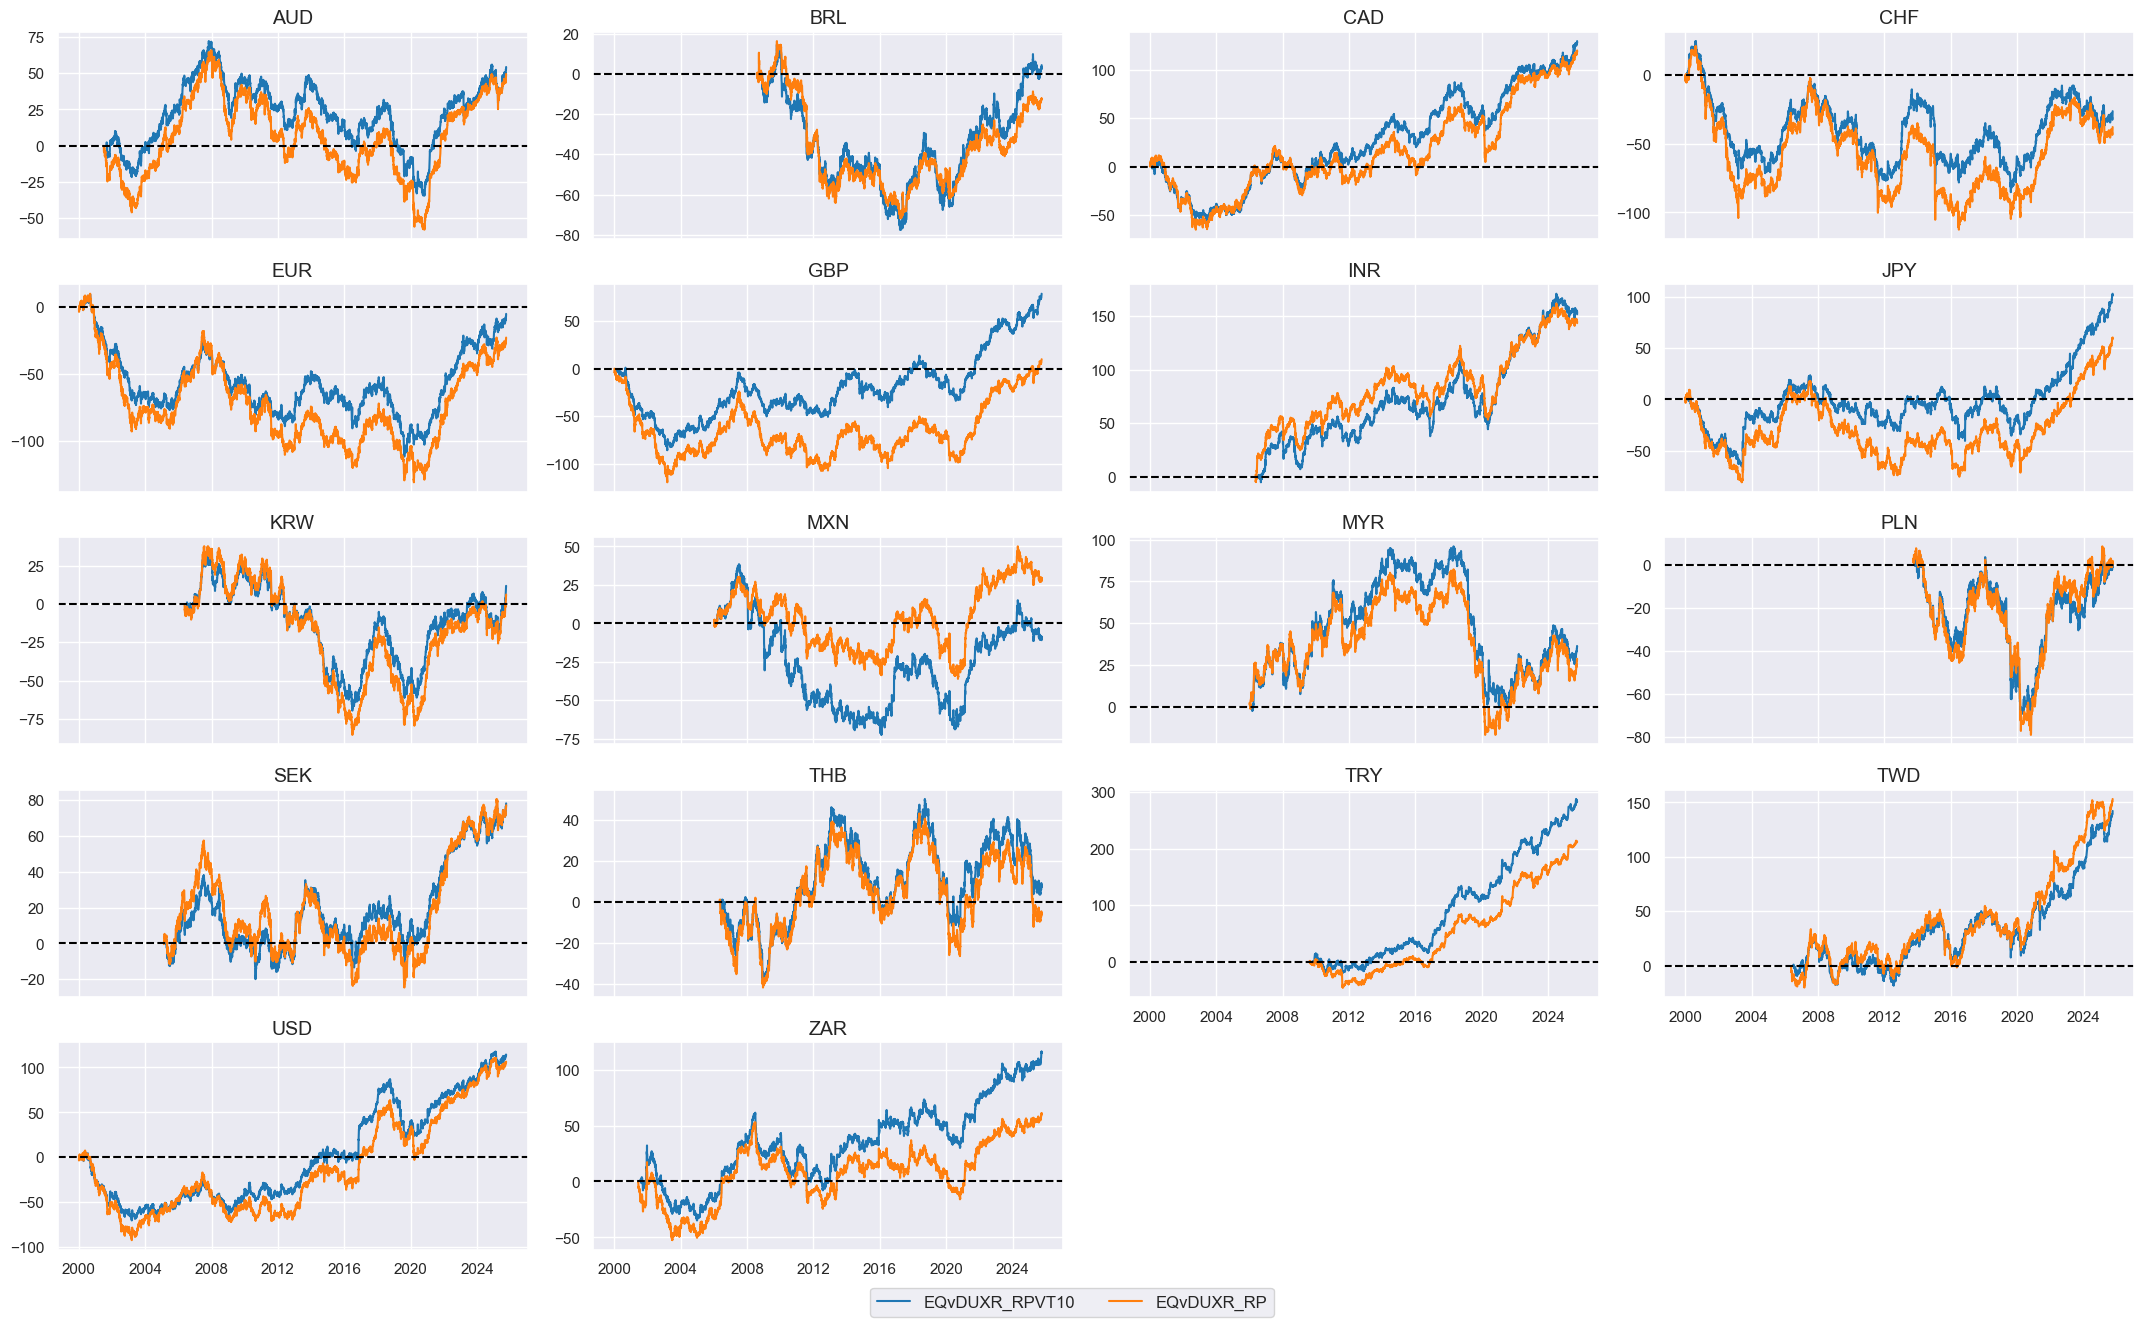
# Inspection

xcatx = ["EQvDUXR_RPVT10", "EQvDUXR_RP"]
cidx = cids_eqdu

msp.view_timelines(
    dfx,
    xcats=xcatx,
    cids=cidx,
    cumsum=True,
    ncol=4,
    aspect=2,
    height=1.8,
    start="2000-01-01",
    same_y=False,
)
Basket returns #
# Global basket proxy returns

dict_brets = {"GLED": [cids_eq, eqdu_black, ["EQDUXR_RP", "EQDUXR_RPVT10", "EQvDUXR_RP", "EQvDUXR_RPVT10"]]}

dfa = pd.DataFrame(columns=dfx.columns)

for cid, params in dict_brets.items():
    cidx, black, xcatx = params
    for xc in xcatx:
        dfaa = msp.linear_composite(
            dfx,
            xcats=[xc],
            blacklist=black,
            cids=cidx,
            new_cid=cid,
        )
        dfa = msm.update_df(dfa, dfaa)

dfx = msm.update_df(dfx, dfa)

brets = [k + "_" + v[2][0] for k, v in dict_brets.items()]
brets_vt = [k + "_" + v[2][1] for k, v in dict_brets.items()]
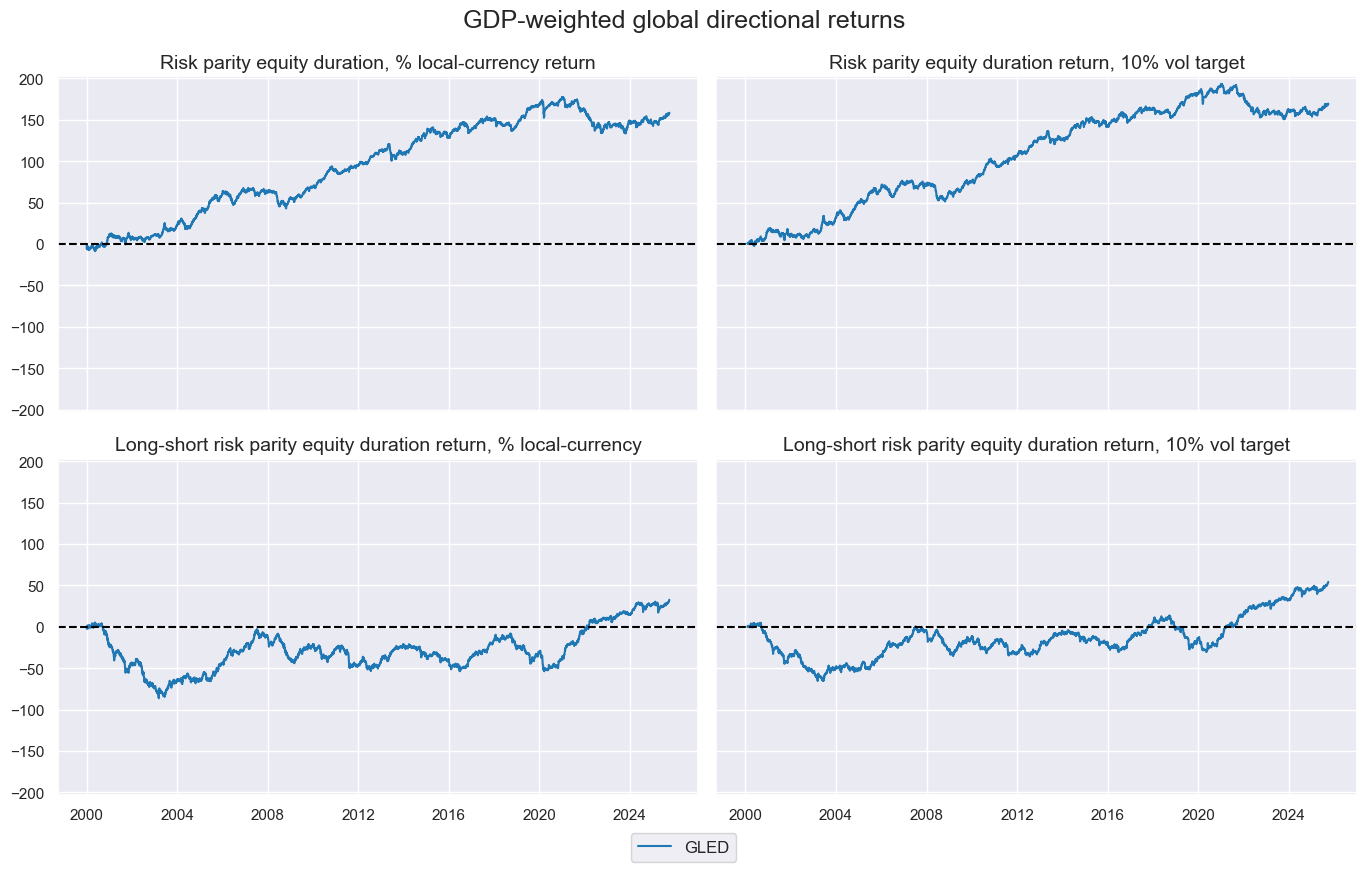
# Visualize new global aggregates

gcid = "GLED"
xcatx = dict_brets[gcid][2]

dict_xcat_labs = {
    "EQDUXR_RP": "Risk parity equity duration, % local-currency return",
    "EQDUXR_RPVT10": "Risk parity equity duration return, 10% vol target",
    "EQvDUXR_RP": "Long-short risk parity equity duration return, % local-currency",
    "EQvDUXR_RPVT10": "Long-short risk parity equity duration return, 10% vol target",
}


msp.view_timelines(
    dfx,
    xcats=xcatx,
    cids=[gcid],
    cumsum=True,
    xcat_grid=True,
    ncol=2,
    start="2000-01-01",
    size=(10, 5),
    xcat_labels=dict_xcat_labs,
    title="GDP-weighted global directional returns",
)
Relative vol-targeted returns #
# Approximate relative vol-targeted returns

dict_rels = {
    "EQXR_VT10": [(cids_eq,   eq_black,  "vGEQ")],
    "FXXR_VT10": [(cids_fx, fxblack, "vGFX")],
}

dfa = pd.DataFrame(columns=list(dfx.columns))
for ret, param_list in dict_rels.items():
    for cids_ac, blacklist, postfix in param_list:
        dfaa = msp.make_relative_value(
            dfx, xcats=[ret], cids=cids_ac, postfix=postfix, blacklist=blacklist
        )
        dfa = msm.update_df(dfa, dfaa)

dfx = msm.update_df(dfx, dfa)
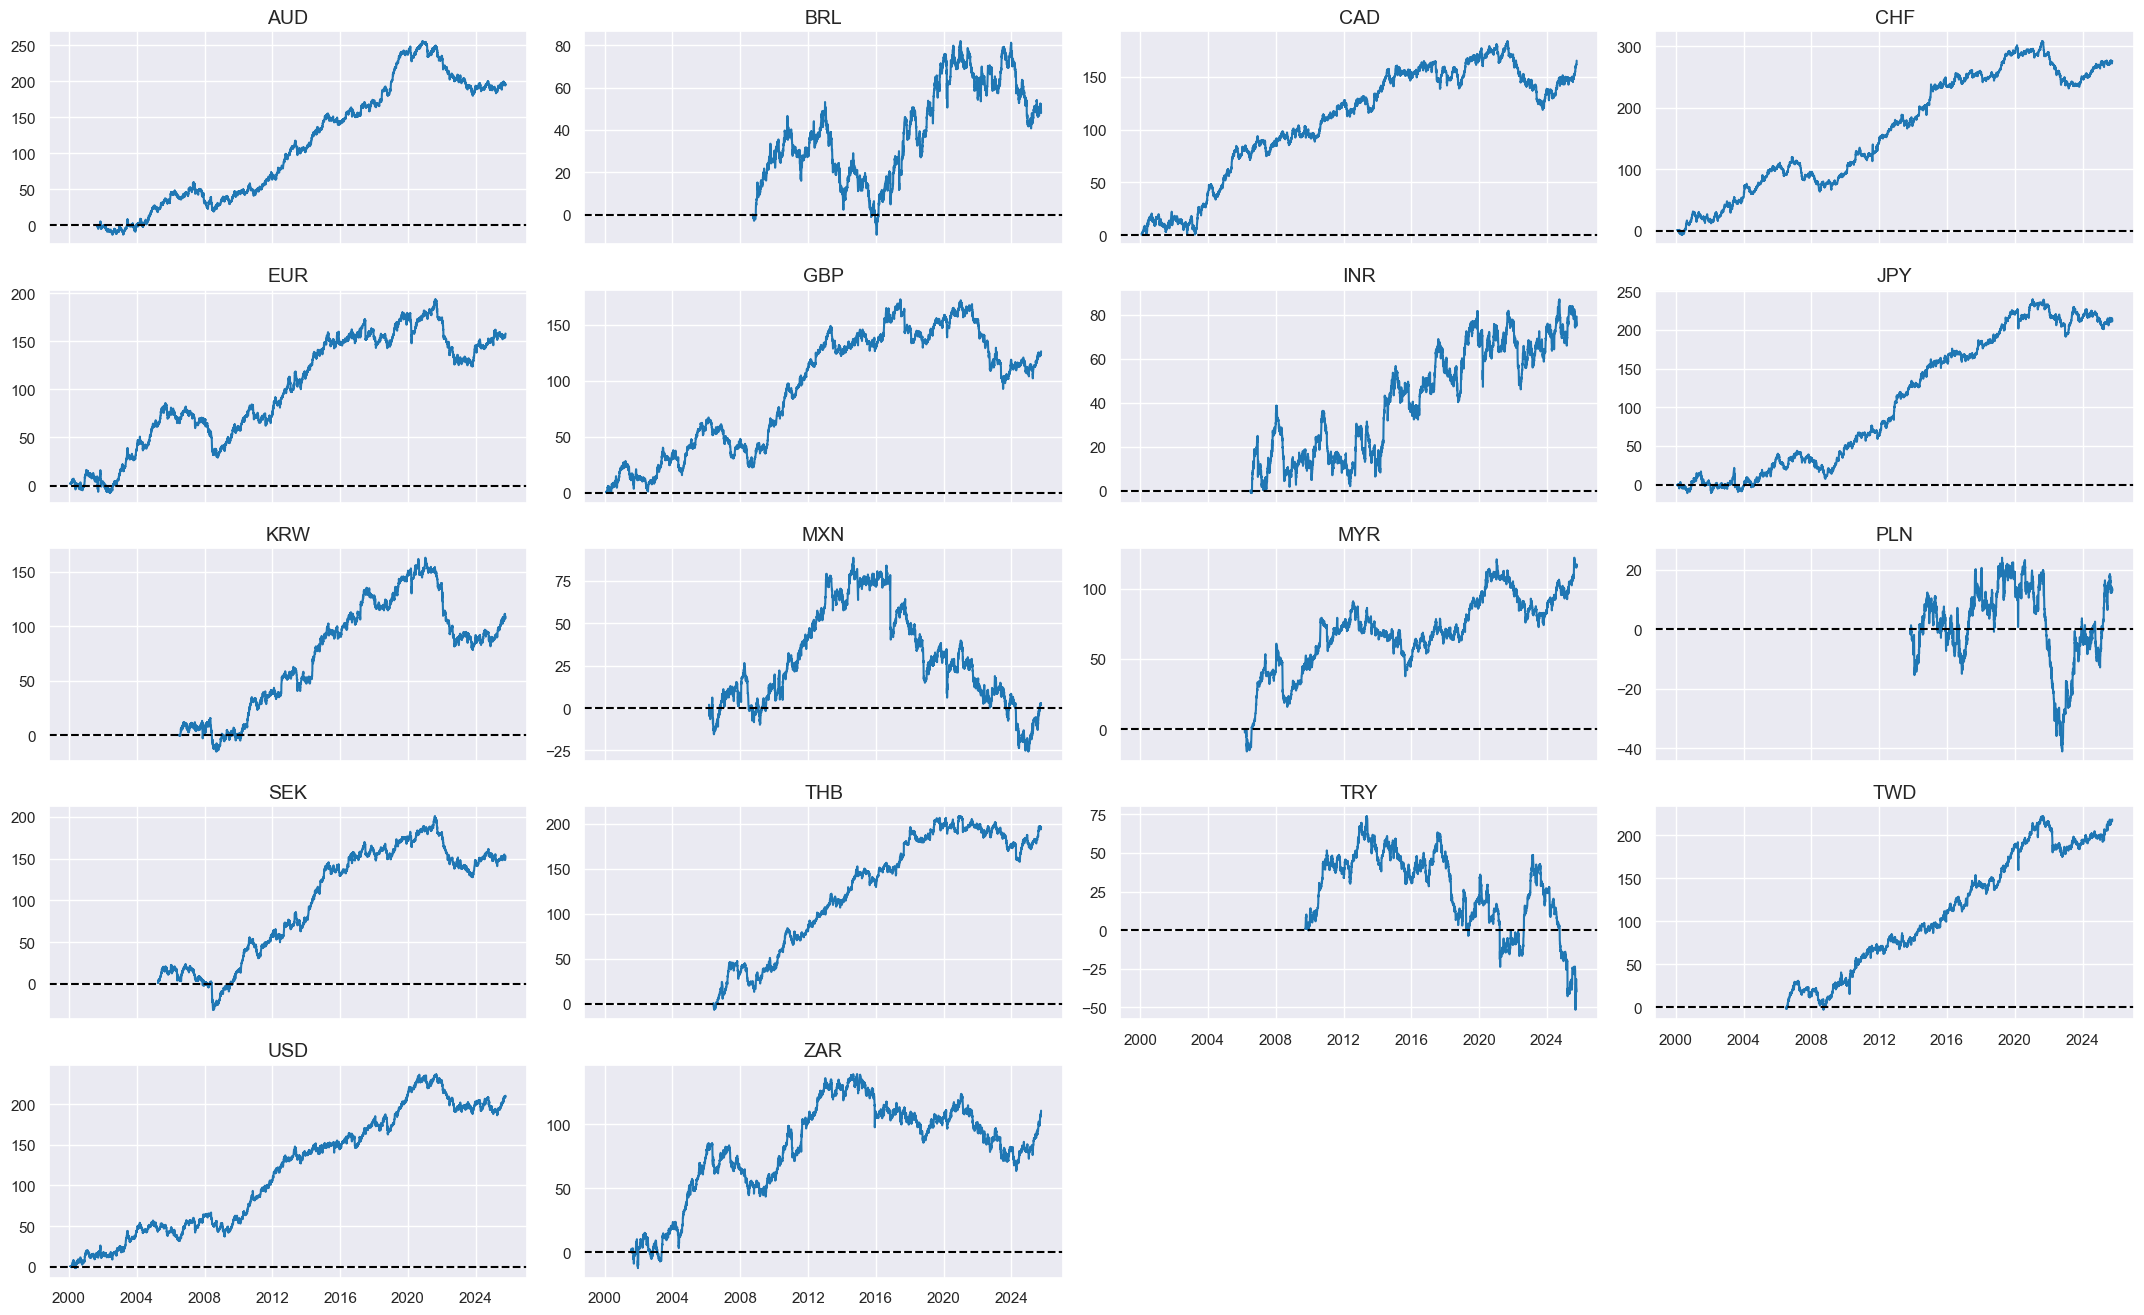
xcatx = ["EQDUXR_RPVT10", ]
cidx = cids_eq

msp.view_timelines(
    dfx,
    xcats=xcatx,
    cids=cidx,
    cumsum=True,
    ncol=4,
    aspect=2,
    height=1.8,
    start="2000-01-01",
    same_y=False,
)
Value checks #
Directional FX #
Specs and panel test #
# Basic specs

dict_fxd = {
    "sigs": [
        "CTOT_NSA_CHG_ZN",
        "CTOT_NSA_P1W4WL1_ZN",
        "CTOT_NSA_P1M12ML1_ZN",
        "CTOT_NSA_P1M60ML1_ZN",
    ],
    "targ": "FXXR_VT10",
    "cids": cids_fx,
    "start": "2000-01-01",
    "black": fxblack,
    "crs": None,
    "srr": None,
    "pnls": None,
}
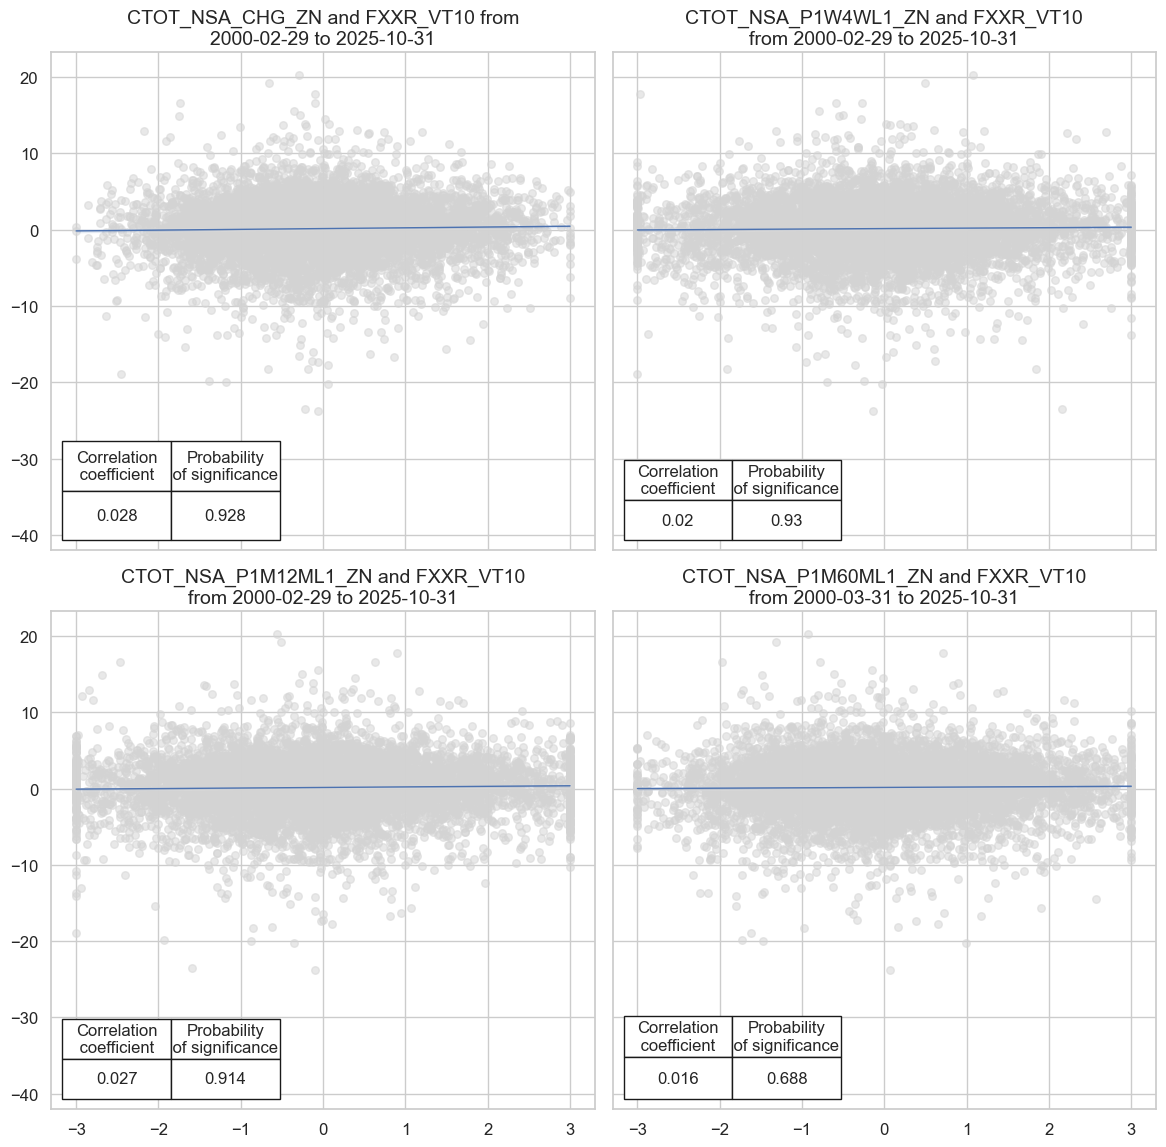
# Panel correlation test

dix = dict_fxd
sigx = dix["sigs"]
targ = dix["targ"]
cidx = dix["cids"]
start = dix["start"]
blax = dix["black"]

# Store correlation results

crs = [
    msp.CategoryRelations(
        dfx,
        xcats=[sig, targ],
        cids=cidx,
        freq="m",
        lag=1,
        xcat_aggs=["last", "sum"],
        start=start,
        blacklist=blax,
    )
    for sig in sigx
]

dix["crs"] = crs
# Display tests

dix = dict_fxd
crs = dix['crs']

msv.multiple_reg_scatter(
    cat_rels=crs,
    ncol=2,
    nrow=2,
    figsize=(12, 12),
    prob_est="map",
    coef_box="lower left",
)
Accuracy and correlation check #
# Signal-return relations object and results

dix = dict_fxd
sigx = dix["sigs"]
targ = dix["targ"]
cidx = dix["cids"]
start = dix["start"]
blax = dix["black"]

srr = mss.SignalReturnRelations(
    dfx,
    sigs=sigx,
    cosp=True,
    rets=targ,
    freqs=["M"],
    blacklist=blax,
    slip=1
)

display(srr.signals_table().sort_index().astype("float").round(3).T)

dix["srr"] = srr
| Return | FXXR_VT10 | |||
|---|---|---|---|---|
| Signal | CTOT_NSA_CHG_ZN | CTOT_NSA_P1M12ML1_ZN | CTOT_NSA_P1M60ML1_ZN | CTOT_NSA_P1W4WL1_ZN |
| Frequency | M | M | M | M |
| Aggregation | last | last | last | last |
| accuracy | 0.511 | 0.507 | 0.507 | 0.514 |
| bal_accuracy | 0.514 | 0.509 | 0.513 | 0.514 |
| pos_sigr | 0.466 | 0.475 | 0.432 | 0.490 |
| pos_retr | 0.541 | 0.541 | 0.541 | 0.541 |
| pos_prec | 0.556 | 0.551 | 0.555 | 0.555 |
| neg_prec | 0.473 | 0.468 | 0.471 | 0.474 |
| pearson | 0.029 | 0.025 | 0.020 | 0.022 |
| pearson_pval | 0.010 | 0.028 | 0.071 | 0.050 |
| kendall | 0.018 | 0.015 | 0.013 | 0.016 |
| kendall_pval | 0.014 | 0.040 | 0.072 | 0.036 |
| auc | 0.514 | 0.510 | 0.513 | 0.515 |
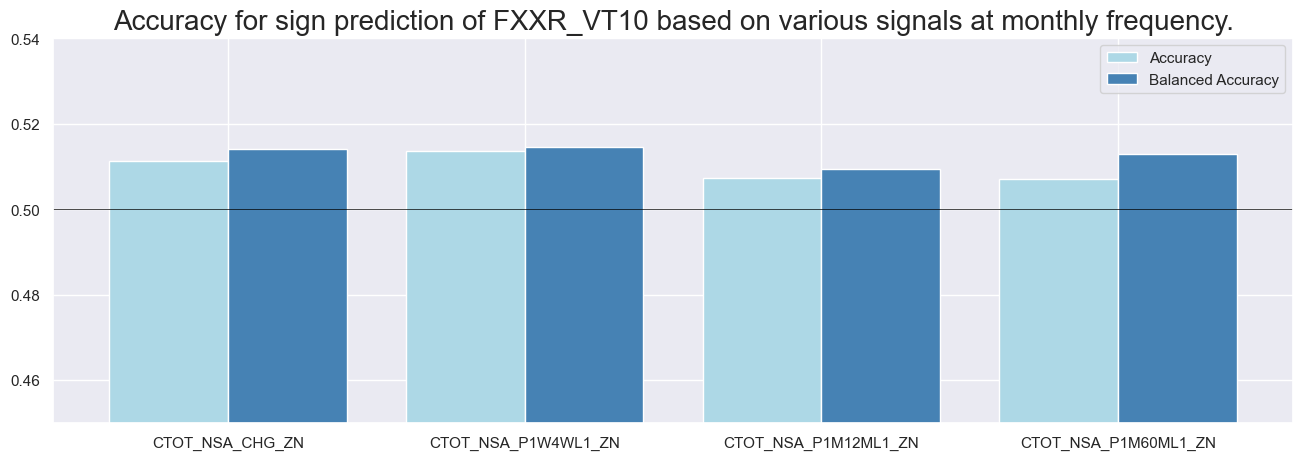
# Accuracy bars

dix = dict_fxd
srr = dix["srr"]
sigs = dix["sigs"]

srr.accuracy_bars(
    type="signals", sigs=sigs, title=None, size=(16, 5), title_fontsize=20
)
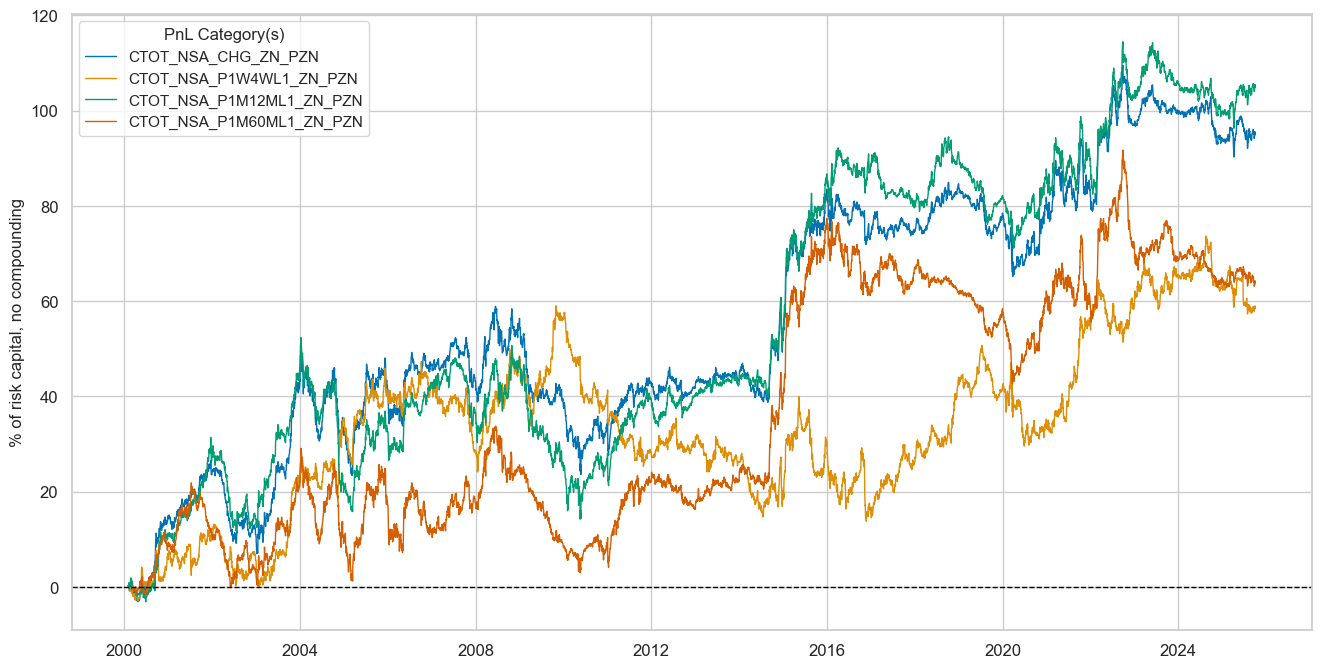
Naive PnL #
dix = dict_fxd
sigx = dix["sigs"]
targ = dix["targ"]
cidx = dix["cids"]
start = dix["start"]
blax = dix["black"]

naive_pnl = msn.NaivePnL(
    dfx,
    ret=targ,
    sigs=sigx,
    cids=cidx,
    start=start,
    blacklist=blax,
    bms=["EUR_FXXR_NSA", "USD_EQXR_NSA", "USD_DU05YXR_NSA"],
)

for sig in list(sigx):
    naive_pnl.make_pnl(
        sig,
        sig_add=0,
        sig_op="zn_score_pan",
        thresh=2,
        rebal_freq="weekly",
        vol_scale=10,
        rebal_slip=1,
        pnl_name=sig + "_PZN",
    )

naive_pnl.make_long_pnl(label="Long only", vol_scale=10)
dix["pnls"] = naive_pnl
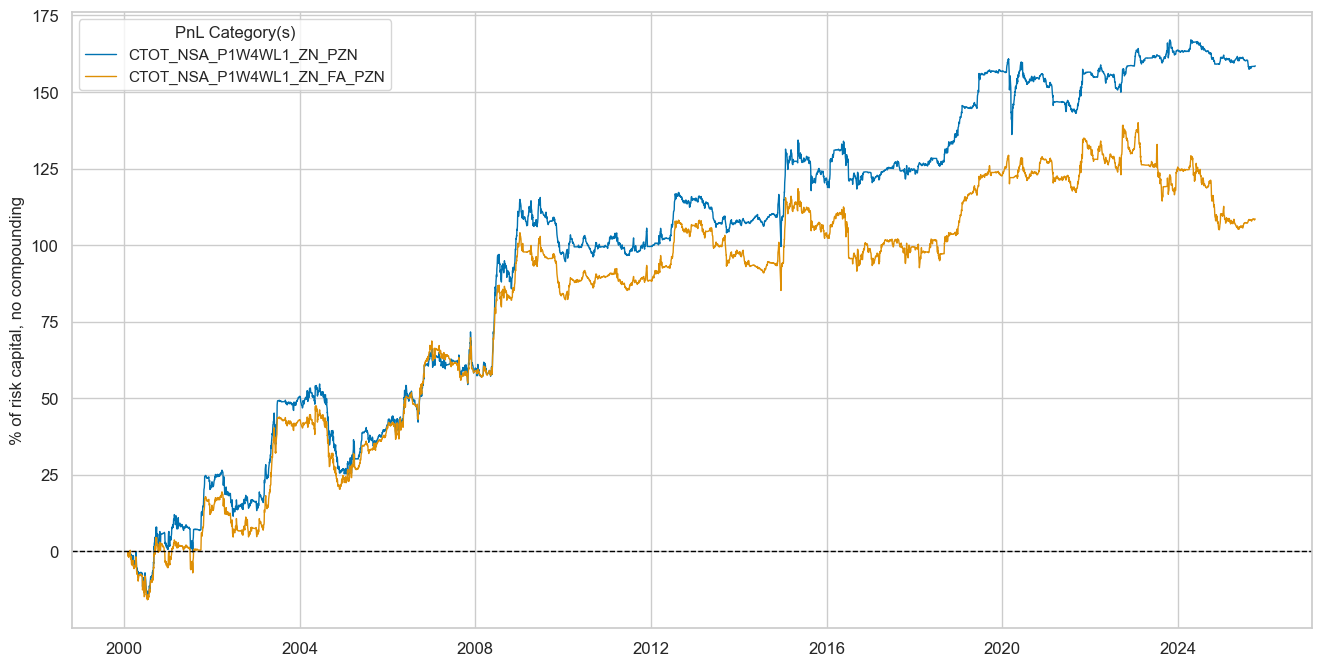
dix = dict_fxd
sigx = dix["sigs"]
cidx = dix["cids"]
start = dix["start"]
naive_pnl = dix["pnls"]

pnls = [sig + "_PZN" for sig in sigx]

naive_pnl.plot_pnls(
    pnl_cats=pnls,
    pnl_cids=["ALL"],
    start=start,
    title=None,
    title_fontsize=16,
    figsize=(16, 8),
    compounding=False,
    xcat_labels=None,
)

display(naive_pnl.evaluate_pnls(pnl_cats=pnls).astype("float").round(2))
| xcat | CTOT_NSA_CHG_ZN_PZN | CTOT_NSA_P1W4WL1_ZN_PZN | CTOT_NSA_P1M12ML1_ZN_PZN | CTOT_NSA_P1M60ML1_ZN_PZN |
|---|---|---|---|---|
| Return % | 3.72 | 2.29 | 4.10 | 2.51 |
| St. Dev. % | 10.00 | 10.00 | 10.00 | 10.00 |
| Sharpe Ratio | 0.37 | 0.23 | 0.41 | 0.25 |
| Sortino Ratio | 0.54 | 0.33 | 0.59 | 0.36 |
| Max 21-Day Draw % | -13.18 | -13.61 | -16.94 | -15.76 |
| Max 6-Month Draw % | -19.32 | -17.98 | -25.33 | -23.62 |
| Peak to Trough Draw % | -35.28 | -45.24 | -38.11 | -34.70 |
| Top 5% Monthly PnL Share | 1.40 | 1.91 | 1.21 | 1.94 |
| EUR_FXXR_NSA correl | 0.03 | -0.01 | 0.01 | 0.04 |
| USD_EQXR_NSA correl | -0.01 | -0.02 | -0.02 | 0.01 |
| USD_DU05YXR_NSA correl | 0.00 | 0.02 | -0.00 | -0.02 |
| Traded Months | 310.00 | 310.00 | 310.00 | 310.00 |
Directional equity strategy #
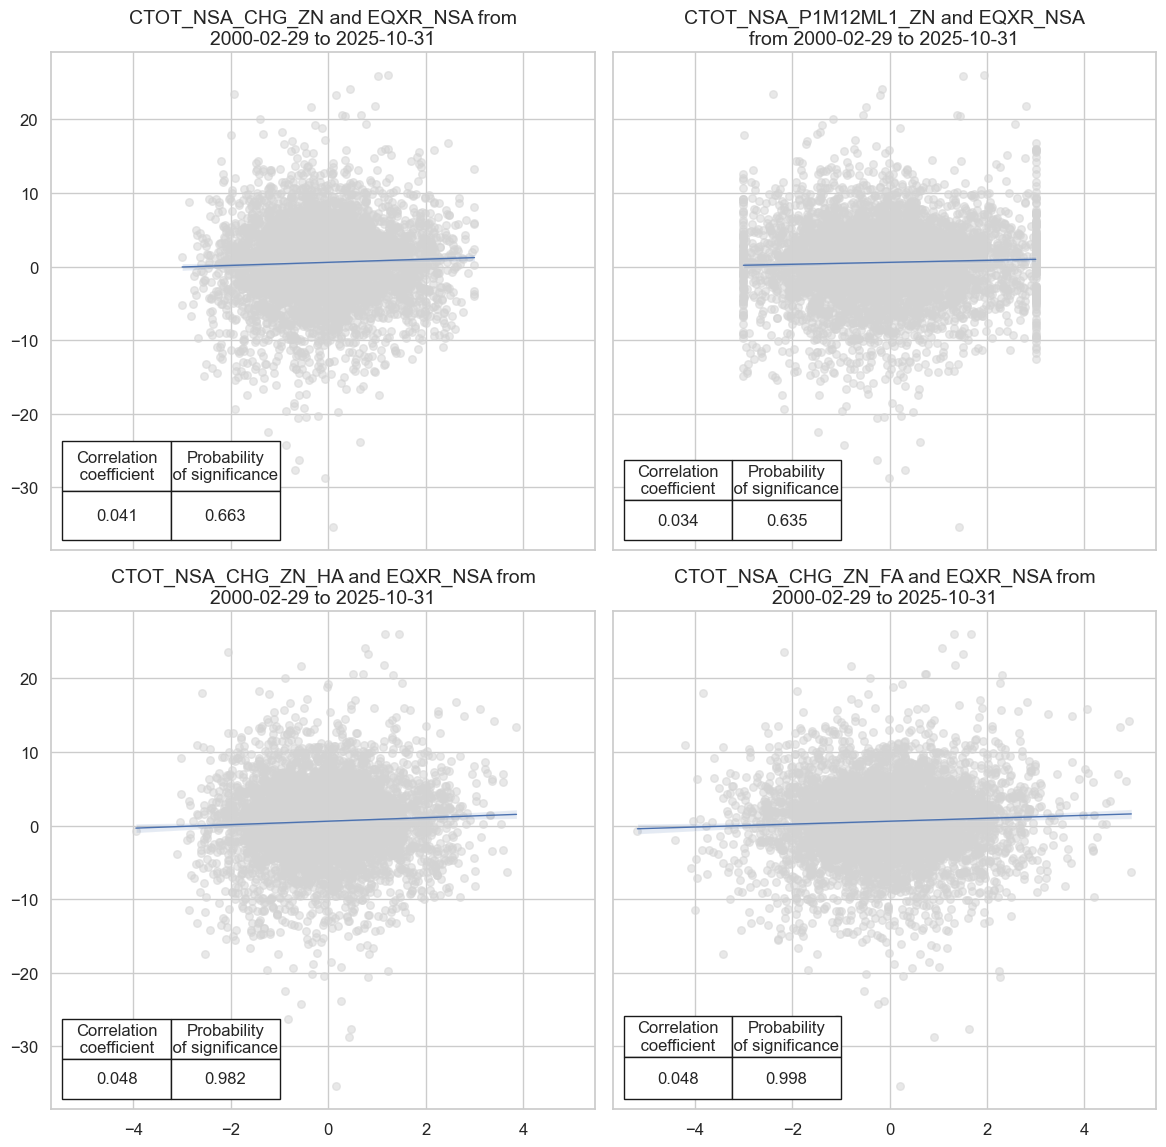
Specs and panel test #
# Basic specs

dict_deq = {
    "sigs": [
        "CTOT_NSA_CHG_ZN",
        "CTOT_NSA_P1M12ML1_ZN",
        "CTOT_NSA_CHG_ZN_HA",
        "CTOT_NSA_CHG_ZN_FA",
    ],
    "targ": "EQXR_NSA",
    "cids": cids_eq,
    "start": "2000-01-01",
    "black": eq_black,
    "crs": None,
    "srr": None,
    "pnls": None,
}
# Panel correlation test

dix = dict_deq
sigx = dix["sigs"]
targ = dix["targ"]
cidx = dix["cids"]
start = dix["start"]
blax = dix["black"]

# Store correlation results

crs = [
    msp.CategoryRelations(
        dfx,
        xcats=[sig, targ],
        cids=cidx,
        freq="m",
        lag=1,
        xcat_aggs=["last", "sum"],
        start=start,
        blacklist=blax,
    )
    for sig in sigx
]

dix["crs"] = crs
# Display tests

dix = dict_deq
crs = dix['crs']

msv.multiple_reg_scatter(
    cat_rels=crs,
    ncol=2,
    nrow=2,
    figsize=(12, 12),
    prob_est="map",
    coef_box="lower left",
)
Accuracy and correlation check #
# Signal-return relations object and results

dix = dict_deq
sigx = dix["sigs"]
targ = dix["targ"]
cidx = dix["cids"]
start = dix["start"]
blax = dix["black"]

srr = mss.SignalReturnRelations(
    dfx,
    sigs=sigx,
    cosp=True,
    rets=targ,
    freqs=["M"],
    blacklist=blax,
    slip=1
)

display(srr.signals_table().sort_index().astype("float").round(3).T)

dix["srr"] = srr
| Return | EQXR_NSA | |||
|---|---|---|---|---|
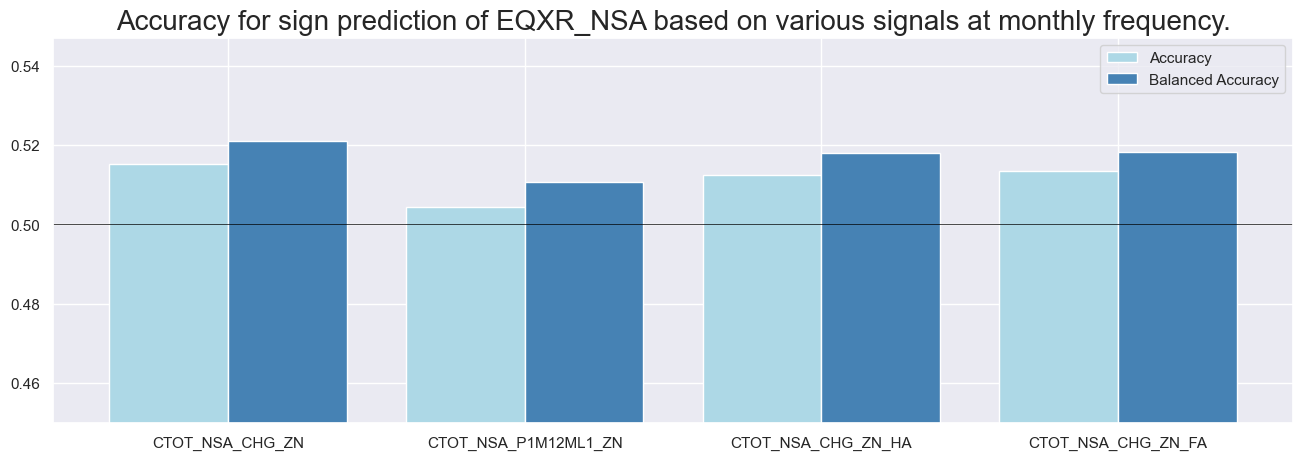
| Signal | CTOT_NSA_CHG_ZN | CTOT_NSA_CHG_ZN_FA | CTOT_NSA_CHG_ZN_HA | CTOT_NSA_P1M12ML1_ZN |
| Frequency | M | M | M | M |
| Aggregation | last | last | last | last |
| accuracy | 0.515 | 0.513 | 0.512 | 0.504 |
| bal_accuracy | 0.521 | 0.518 | 0.518 | 0.511 |
| pos_sigr | 0.466 | 0.471 | 0.467 | 0.463 |
| pos_retr | 0.584 | 0.584 | 0.584 | 0.584 |
| pos_prec | 0.607 | 0.604 | 0.603 | 0.596 |
| neg_prec | 0.435 | 0.433 | 0.433 | 0.426 |
| pearson | 0.037 | 0.046 | 0.045 | 0.031 |
| pearson_pval | 0.009 | 0.001 | 0.001 | 0.026 |
| kendall | 0.021 | 0.025 | 0.024 | 0.015 |
| kendall_pval | 0.028 | 0.008 | 0.010 | 0.099 |
| auc | 0.522 | 0.519 | 0.518 | 0.511 |
# Accuracy bars

dix = dict_deq
srr = dix["srr"]
sigs = dix["sigs"]

srr.accuracy_bars(
    type="signals", sigs=sigs, title=None, size=(16, 5), title_fontsize=20
)
Naive PnL #
dix = dict_deq
sigx = dix["sigs"]
targ = dix["targ"]
cidx = dix["cids"]
start = dix["start"]
blax = dix["black"]

naive_pnl = msn.NaivePnL(
    dfx,
    ret=targ,
    sigs=sigx,
    cids=cidx,
    start=start,
    blacklist=blax,
    bms=["EUR_FXXR_NSA", "USD_EQXR_NSA", "USD_DU05YXR_NSA"],
)

for sig in list(sigx):
    naive_pnl.make_pnl(
        sig,
        sig_add=0,
        sig_op="zn_score_pan",
        thresh=3,
        rebal_freq="monthly",
        vol_scale=10,
        rebal_slip=1,
        pnl_name=sig + "_PZN",
    )

naive_pnl.make_long_pnl(label="Long only", vol_scale=10)
dix["pnls"] = naive_pnl
dix = dict_deq
sigx = dix["sigs"]
cidx = dix["cids"]
start = dix["start"]
naive_pnl = dix["pnls"]

pnls = [sig + "_PZN" for sig in sigx]

naive_pnl.plot_pnls(
    pnl_cats=pnls,
    pnl_cids=["ALL"],
    start=start,
    title=None,
    title_fontsize=16,
    figsize=(16, 8),
    compounding=False,
    xcat_labels=None,
)

display(naive_pnl.evaluate_pnls(pnl_cats=pnls).astype("float").round(2))
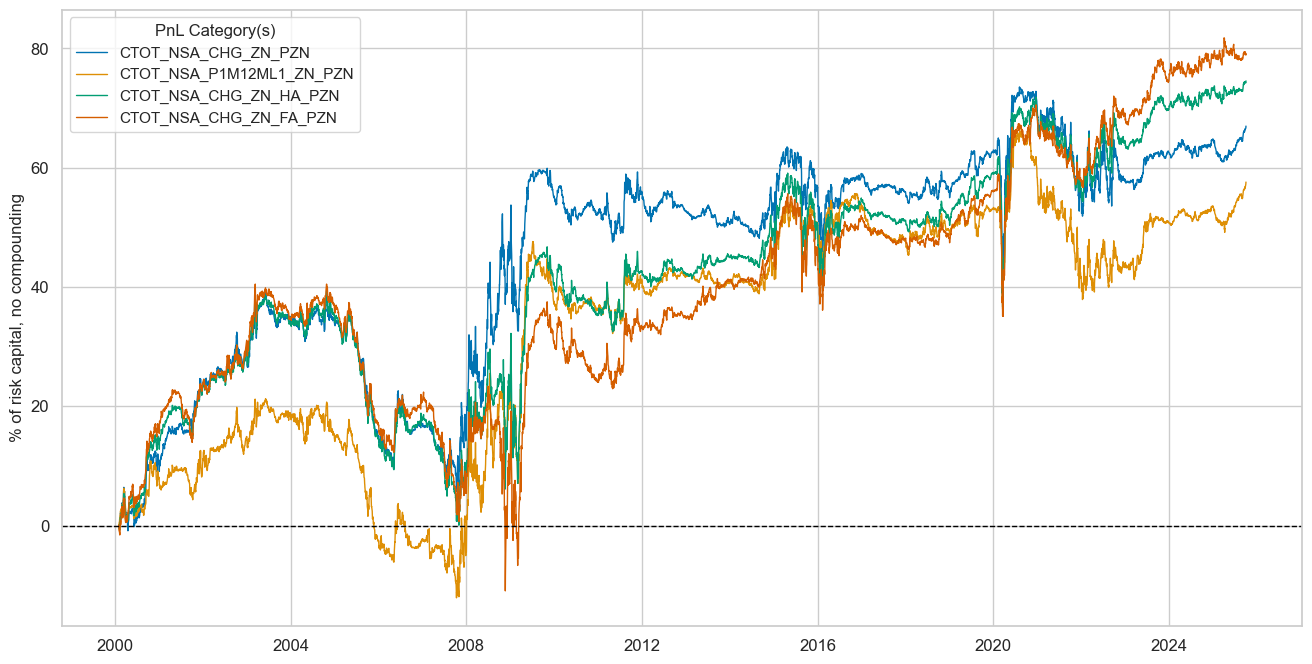
| xcat | CTOT_NSA_CHG_ZN_PZN | CTOT_NSA_P1M12ML1_ZN_PZN | CTOT_NSA_CHG_ZN_HA_PZN | CTOT_NSA_CHG_ZN_FA_PZN |
|---|---|---|---|---|
| Return % | 2.61 | 2.24 | 2.90 | 3.08 |
| St. Dev. % | 10.00 | 10.00 | 10.00 | 10.00 |
| Sharpe Ratio | 0.26 | 0.22 | 0.29 | 0.31 |
| Sortino Ratio | 0.38 | 0.33 | 0.42 | 0.45 |
| Max 21-Day Draw % | -23.46 | -16.92 | -24.77 | -23.49 |
| Max 6-Month Draw % | -20.63 | -16.45 | -21.04 | -29.01 |
| Peak to Trough Draw % | -33.43 | -33.38 | -39.34 | -51.43 |
| Top 5% Monthly PnL Share | 1.92 | 2.26 | 1.73 | 1.51 |
| EUR_FXXR_NSA correl | -0.05 | -0.01 | -0.01 | 0.03 |
| USD_EQXR_NSA correl | 0.00 | 0.04 | 0.08 | 0.14 |
| USD_DU05YXR_NSA correl | 0.03 | 0.02 | -0.00 | -0.02 |
| Traded Months | 310.00 | 310.00 | 310.00 | 310.00 |
Directional global equity duration strategy #
Specs and panel test #
# Basic specs

dict_ged = {
    "sigs": [
        "CTOT_NSA_P1W4WL1_ZN",
        "CTOT_NSA_P1W4WL1_ZN_FA",
    ],
    "targ": "EQDUXR_RP",
    "cids": ["GLED"],
    "start": "2000-01-01",
    "black": eq_black,
    "crs": None,
    "srr": None,
    "pnls": None,
}
# Panel correlation test

dix = dict_ged
sigx = dix["sigs"]
targ = dix["targ"]
cidx = dix["cids"]
start = dix["start"]
blax = dix["black"]

# Store correlation results

crs = [
    msp.CategoryRelations(
        dfx,
        xcats=[sig, targ],
        cids=cidx,
        freq="m",
        lag=1,
        xcat_aggs=["last", "sum"],
        start=start,
        blacklist=blax,
    )
    for sig in sigx
]

dix["crs"] = crs
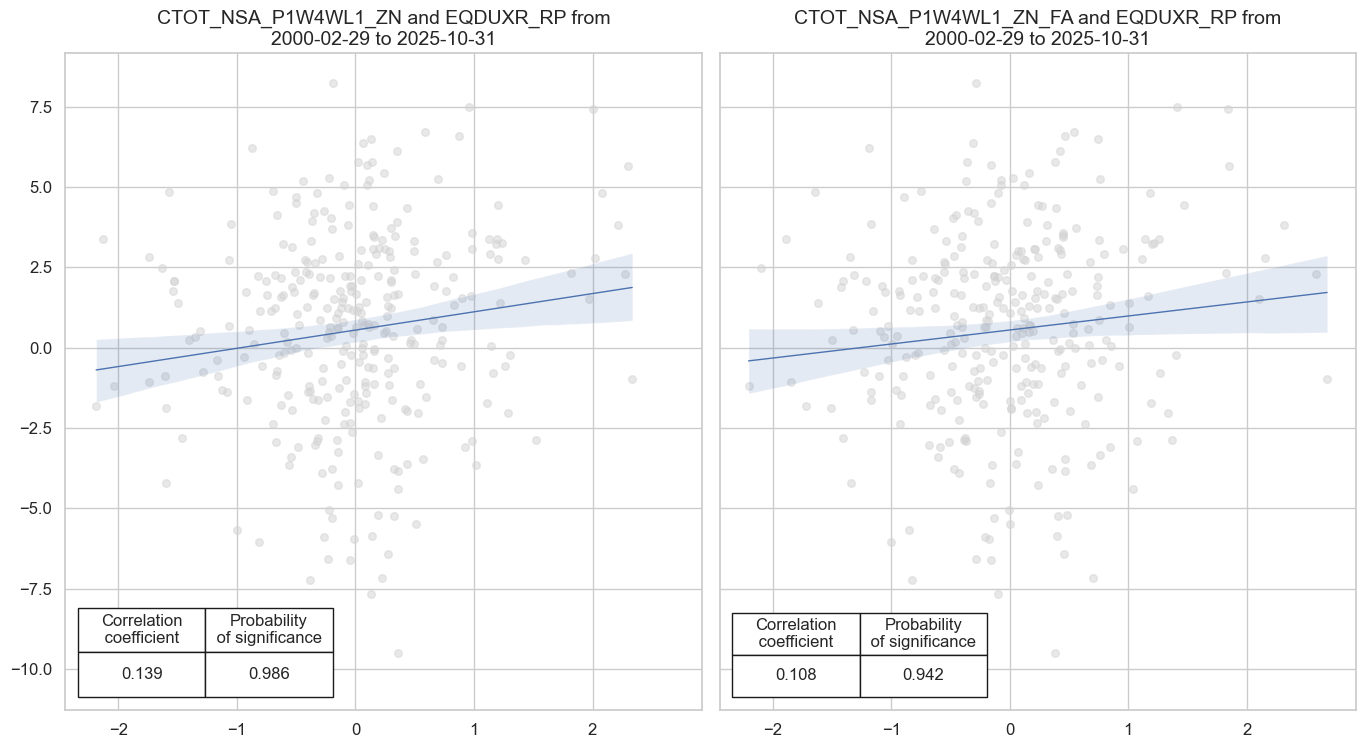
# Display tests

dix = dict_ged
crs = dix['crs']

msv.multiple_reg_scatter(
    cat_rels=crs,
    ncol=2,
    nrow=1,
    figsize=(14, 8),
    prob_est="map",
    coef_box="lower left",
)
Accuracy and correlation check #
# Signal-return relations object and results

dix = dict_ged
sigx = dix["sigs"]
targ = dix["targ"]
cidx = dix["cids"]
start = dix["start"]
blax = dix["black"]

srr = mss.SignalReturnRelations(
    dfx,
    sigs=sigx,
    cosp=True,
    rets=targ,
    freqs=["M"],
    blacklist=blax,
    slip=1
)

display(srr.signals_table().astype("float").round(3).T)

dix["srr"] = srr
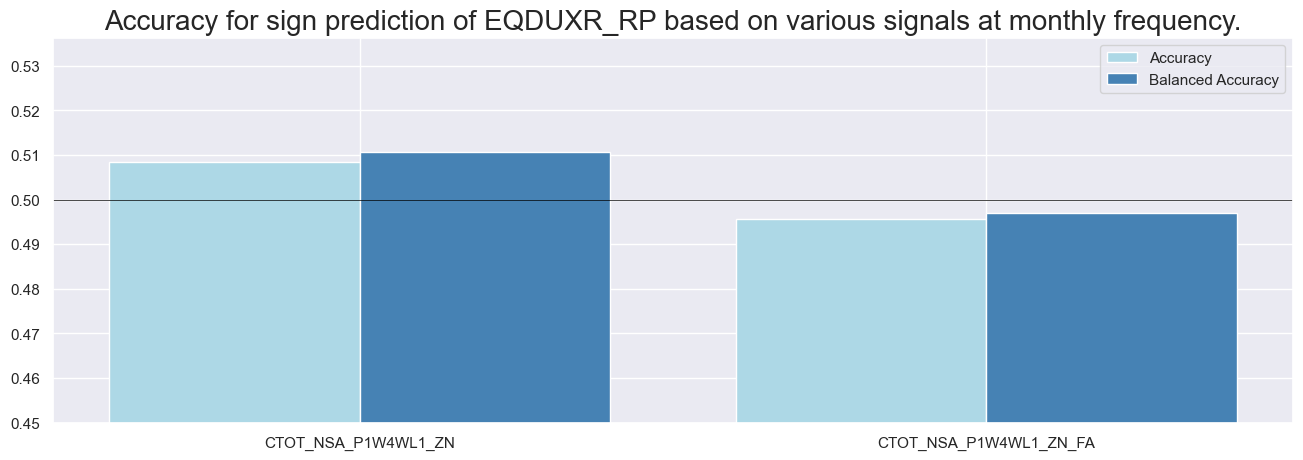
| Return | EQDUXR_RP | |
|---|---|---|
| Signal | CTOT_NSA_P1W4WL1_ZN | CTOT_NSA_P1W4WL1_ZN_FA |
| Frequency | M | M |
| Aggregation | last | last |
| accuracy | 0.508 | 0.496 |
| bal_accuracy | 0.511 | 0.497 |
| pos_sigr | 0.487 | 0.491 |
| pos_retr | 0.587 | 0.587 |
| pos_prec | 0.598 | 0.584 |
| neg_prec | 0.423 | 0.410 |
| pearson | 0.045 | 0.019 |
| pearson_pval | 0.002 | 0.176 |
| kendall | 0.028 | 0.014 |
| kendall_pval | 0.004 | 0.142 |
| auc | 0.511 | 0.497 |
# Accuracy bars

dix = dict_ged
srr = dix["srr"]
sigs = dix["sigs"]

srr.accuracy_bars(
    type="signals", sigs=sigs, title=None, size=(16, 5), title_fontsize=20
)
Naive PnL #
dix = dict_ged
sigx = dix["sigs"]
targ = dix["targ"]
cidx = dix["cids"]
start = dix["start"]
blax = dix["black"]

naive_pnl = msn.NaivePnL(
    dfx,
    ret=targ,
    sigs=sigx,
    cids=cidx,
    start=start,
    blacklist=blax,
    bms=["EUR_FXXR_NSA", "USD_EQXR_NSA", "USD_DU05YXR_NSA"],
)

for sig in list(sigx):
    naive_pnl.make_pnl(
        sig,
        sig_add=0,
        sig_op="zn_score_pan",
        thresh=2,
        rebal_freq="monthly",
        vol_scale=10,
        rebal_slip=1,
        pnl_name=sig + "_PZN",
    )

naive_pnl.make_long_pnl(label="Long only", vol_scale=10)
dix["pnls"] = naive_pnl
dix = dict_ged
sigx = dix["sigs"]
cidx = dix["cids"]
start = dix["start"]
naive_pnl = dix["pnls"]

pnls = [sig + "_PZN" for sig in sigx]

naive_pnl.plot_pnls(
    pnl_cats=pnls,
    pnl_cids=["ALL"],
    start=start,
    title=None,
    title_fontsize=16,
    figsize=(16, 8),
    compounding=False,
    xcat_labels=None,
)

display(naive_pnl.evaluate_pnls(pnl_cats=pnls).astype("float").round(2))
| xcat | CTOT_NSA_P1W4WL1_ZN_PZN | CTOT_NSA_P1W4WL1_ZN_FA_PZN |
|---|---|---|
| Return % | 6.18 | 4.23 |
| St. Dev. % | 10.00 | 10.00 |
| Sharpe Ratio | 0.62 | 0.42 |
| Sortino Ratio | 0.93 | 0.63 |
| Max 21-Day Draw % | -24.64 | -13.74 |
| Max 6-Month Draw % | -28.67 | -25.14 |
| Peak to Trough Draw % | -29.66 | -34.97 |
| Top 5% Monthly PnL Share | 1.18 | 1.65 |
| EUR_FXXR_NSA correl | -0.05 | -0.07 |
| USD_EQXR_NSA correl | 0.05 | -0.02 |
| USD_DU05YXR_NSA correl | -0.04 | -0.05 |
| Traded Months | 309.00 | 309.00 |
Relative FX strategy #
Specs and panel test #
# Basic specs

dict_fxr = {
    "sigs": [
        "CTOT_NSA_CHG_ZNvGFX",
        "CTOT_NSA_P1W4WL1_ZNvGFX",
        "CTOT_NSA_P1M12ML1_ZNvGFX",
        "CTOT_NSA_P1M60ML1_ZNvGFX",
    ],
    "targ": "FXXR_VT10vGFX",
    "cids": cids_fx,
    "start": "2000-01-01",
    "black": fxblack,
    "crs": None,
    "srr": None,
    "pnls": None,
}
# Panel correlation test

dix = dict_fxr
sigx = dix["sigs"]
targ = dix["targ"]
cidx = dix["cids"]
start = dix["start"]
blax = dix["black"]

# Store correlation results

crs = [
    msp.CategoryRelations(
        dfx,
        xcats=[sig, targ],
        cids=cidx,
        freq="m",
        lag=1,
        xcat_aggs=["last", "sum"],
        start=start,
        blacklist=blax,
    )
    for sig in sigx
]

dix["crs"] = crs
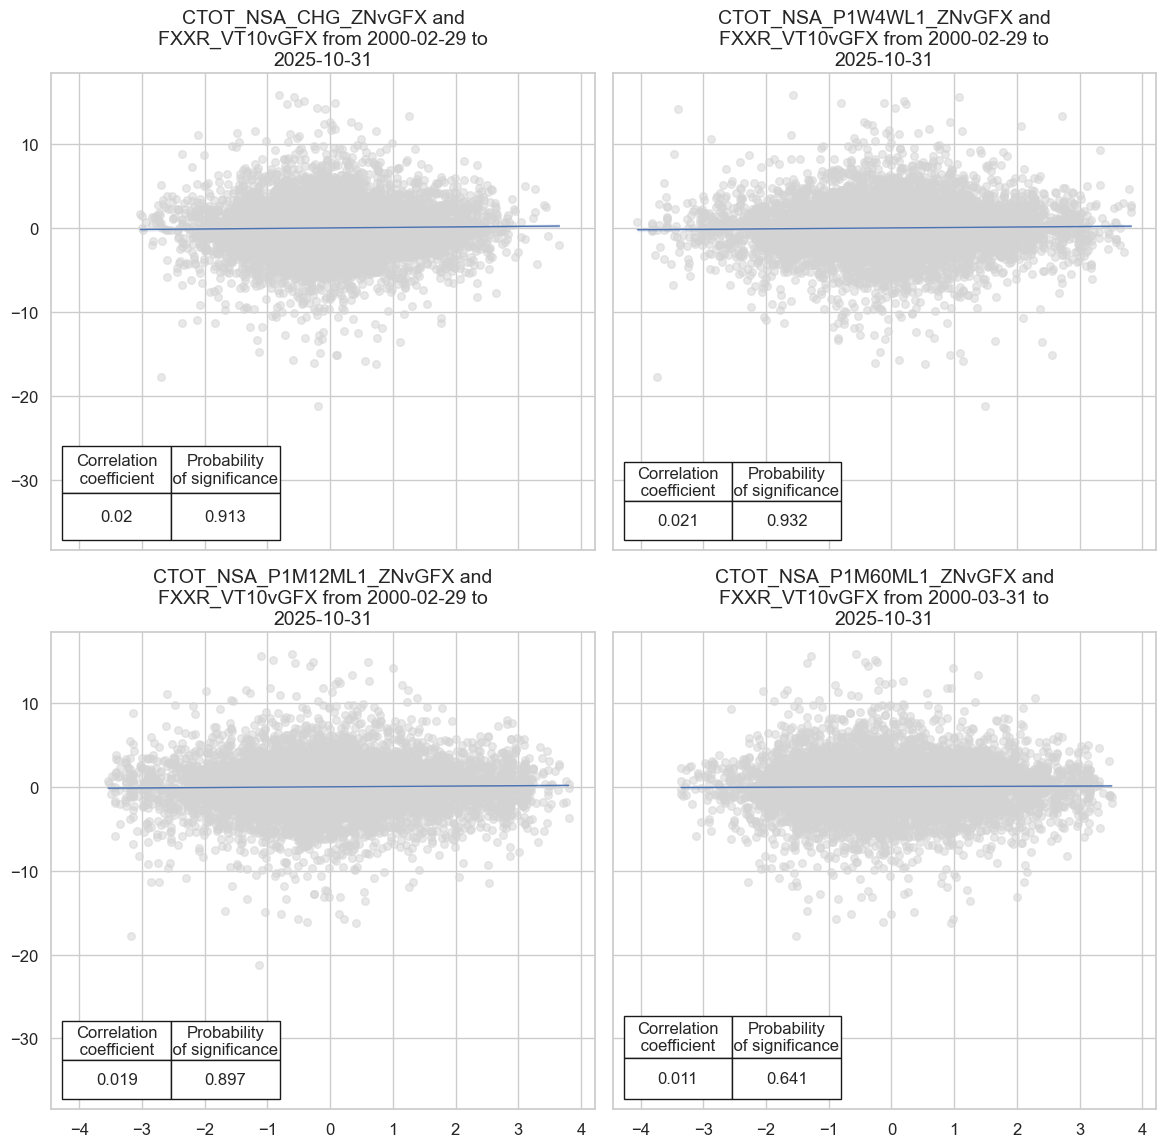
# Display tests

dix = dict_fxr
crs = dix['crs']

msv.multiple_reg_scatter(
    cat_rels=crs,
    ncol=2,
    nrow=2,
    figsize=(12, 12),
    prob_est="map",
    coef_box="lower left",
)
Accuracy and correlation check #
# Signal-return relations object and results

dix = dict_fxr
sigx = dix["sigs"]
targ = dix["targ"]
cidx = dix["cids"]
start = dix["start"]
blax = dix["black"]

srr = mss.SignalReturnRelations(
    dfx,
    sigs=sigx,
    cosp=True,
    rets=targ,
    freqs=["M"],
    blacklist=blax,
    slip=1
)

display(srr.signals_table().astype("float").round(3).T)

dix["srr"] = srr
| Return | FXXR_VT10vGFX | |||
|---|---|---|---|---|
| Signal | CTOT_NSA_CHG_ZNvGFX | CTOT_NSA_P1W4WL1_ZNvGFX | CTOT_NSA_P1M12ML1_ZNvGFX | CTOT_NSA_P1M60ML1_ZNvGFX |
| Frequency | M | M | M | M |
| Aggregation | last | last | last | last |
| accuracy | 0.506 | 0.505 | 0.509 | 0.505 |
| bal_accuracy | 0.507 | 0.505 | 0.509 | 0.507 |
| pos_sigr | 0.472 | 0.498 | 0.485 | 0.457 |
| pos_retr | 0.515 | 0.515 | 0.515 | 0.515 |
| pos_prec | 0.522 | 0.520 | 0.524 | 0.522 |
| neg_prec | 0.491 | 0.491 | 0.494 | 0.491 |
| pearson | 0.018 | 0.023 | 0.016 | 0.011 |
| pearson_pval | 0.127 | 0.052 | 0.179 | 0.359 |
| kendall | 0.009 | 0.015 | 0.009 | 0.007 |
| kendall_pval | 0.260 | 0.055 | 0.256 | 0.366 |
| auc | 0.507 | 0.505 | 0.509 | 0.507 |
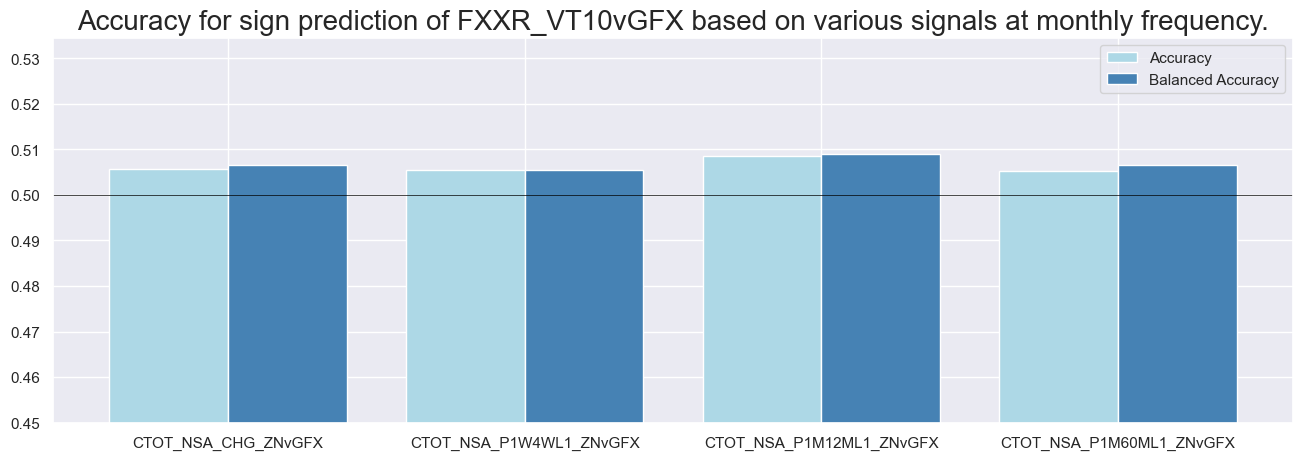
# Accuracy bars

dix = dict_fxr
srr = dix["srr"]
sigs = dix["sigs"]

srr.accuracy_bars(
    type="signals", sigs=sigs, title=None, size=(16, 5), title_fontsize=20
)
Naive PnL #
dix = dict_fxr
sigx = dix["sigs"]
targ = dix["targ"]
cidx = dix["cids"]
start = dix["start"]
blax = dix["black"]

naive_pnl = msn.NaivePnL(
    dfx,
    ret=targ,
    sigs=sigx,
    cids=cidx,
    start=start,
    blacklist=blax,
    bms=["EUR_FXXR_NSA", "USD_EQXR_NSA", "USD_DU05YXR_NSA"],
)

for sig in list(sigx):
    naive_pnl.make_pnl(
        sig,
        sig_add=0,
        sig_op="zn_score_pan",
        thresh=2,
        rebal_freq="monthly",
        vol_scale=10,
        rebal_slip=1,
        pnl_name=sig + "_PZN",
    )

naive_pnl.make_long_pnl(label="Long only", vol_scale=10)
dix["pnls"] = naive_pnl
dix = dict_fxr
sigx = dix["sigs"]
cidx = dix["cids"]
start = dix["start"]
naive_pnl = dix["pnls"]

pnls = [sig + "_PZN" for sig in sigx] # + ["Long only"]

naive_pnl.plot_pnls(
    pnl_cats=pnls,
    pnl_cids=["ALL"],
    start=start,
    title=None,
    title_fontsize=16,
    figsize=(16, 8),
    compounding=False,
    xcat_labels=None,
)

display(naive_pnl.evaluate_pnls(pnl_cats=pnls).astype("float").round(2))
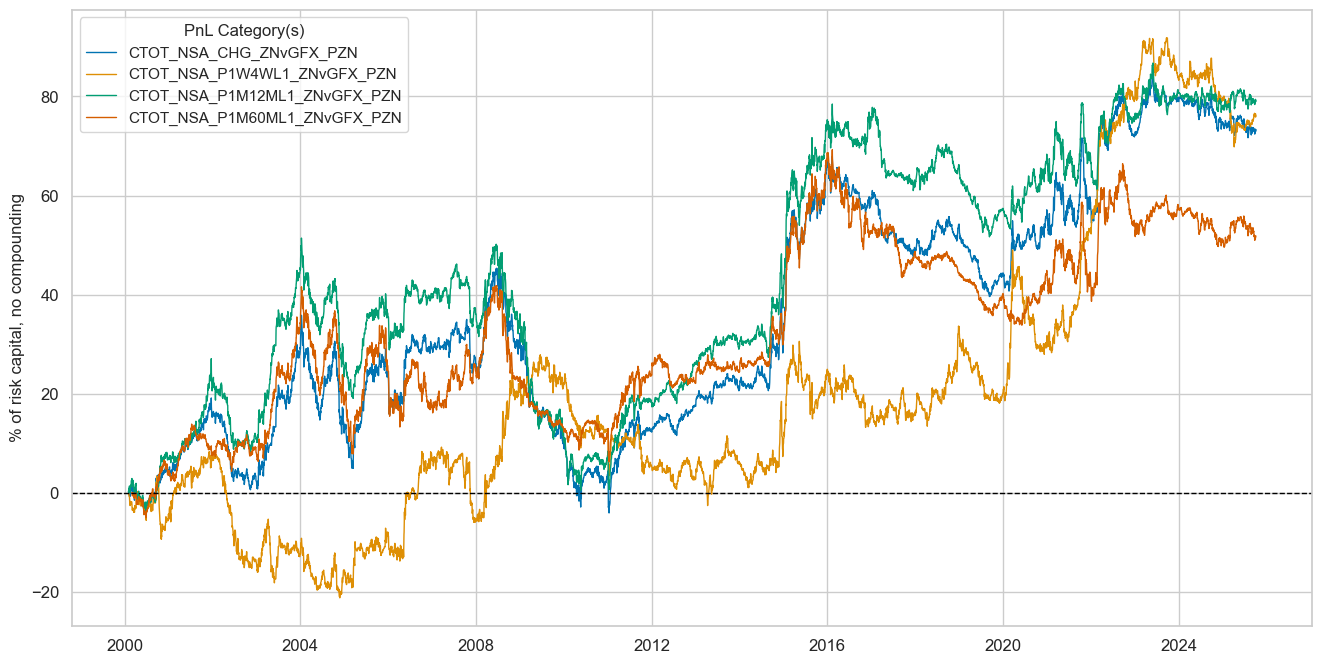
| xcat | CTOT_NSA_CHG_ZNvGFX_PZN | CTOT_NSA_P1W4WL1_ZNvGFX_PZN | CTOT_NSA_P1M12ML1_ZNvGFX_PZN | CTOT_NSA_P1M60ML1_ZNvGFX_PZN |
|---|---|---|---|---|
| Return % | 2.86 | 2.97 | 3.09 | 2.03 |
| St. Dev. % | 10.00 | 10.00 | 10.00 | 10.00 |
| Sharpe Ratio | 0.29 | 0.30 | 0.31 | 0.20 |
| Sortino Ratio | 0.41 | 0.44 | 0.44 | 0.29 |
| Max 21-Day Draw % | -13.32 | -11.73 | -13.00 | -17.48 |
| Max 6-Month Draw % | -20.92 | -20.50 | -23.33 | -24.05 |
| Peak to Trough Draw % | -49.42 | -30.45 | -50.94 | -35.57 |
| Top 5% Monthly PnL Share | 1.76 | 1.67 | 1.50 | 2.25 |
| EUR_FXXR_NSA correl | 0.06 | -0.02 | 0.05 | 0.08 |
| USD_EQXR_NSA correl | 0.01 | -0.02 | 0.00 | 0.04 |
| USD_DU05YXR_NSA correl | -0.00 | 0.01 | -0.01 | -0.01 |
| Traded Months | 310.00 | 310.00 | 310.00 | 310.00 |
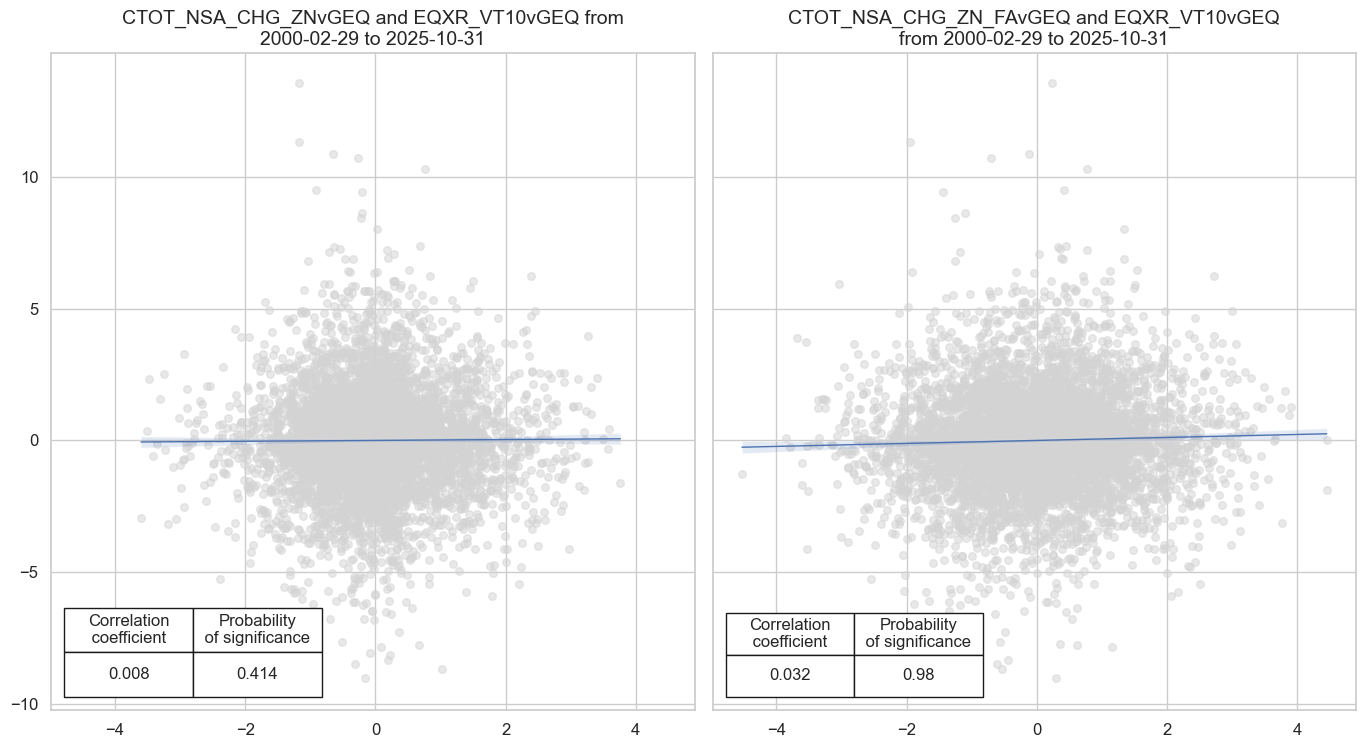
Relative equity strategy #
Specs and panel test #
# Basic specs

dict_req = {
    "sigs": [
        "CTOT_NSA_CHG_ZNvGEQ",
        "CTOT_NSA_CHG_ZN_FAvGEQ",
    ],
    "targ": "EQXR_VT10vGEQ",
    "cids": cids_eq,
    "start": "2000-01-01",
    "black": eq_black,
    "crs": None,
    "srr": None,
    "pnls": None,
}
# Panel correlation test

dix = dict_req
sigx = dix["sigs"]
targ = dix["targ"]
cidx = dix["cids"]
start = dix["start"]
blax = dix["black"]

# Store correlation results

crs = [
    msp.CategoryRelations(
        dfx,
        xcats=[sig, targ],
        cids=cidx,
        freq="m",
        lag=1,
        xcat_aggs=["last", "sum"],
        start=start,
        blacklist=blax,
    )
    for sig in sigx
]

dix["crs"] = crs
# Display tests

dix = dict_req
crs = dix['crs']

msv.multiple_reg_scatter(
    cat_rels=crs,
    ncol=2,
    nrow=1,
    figsize=(14, 8),
    prob_est="map",
    coef_box="lower left",
)
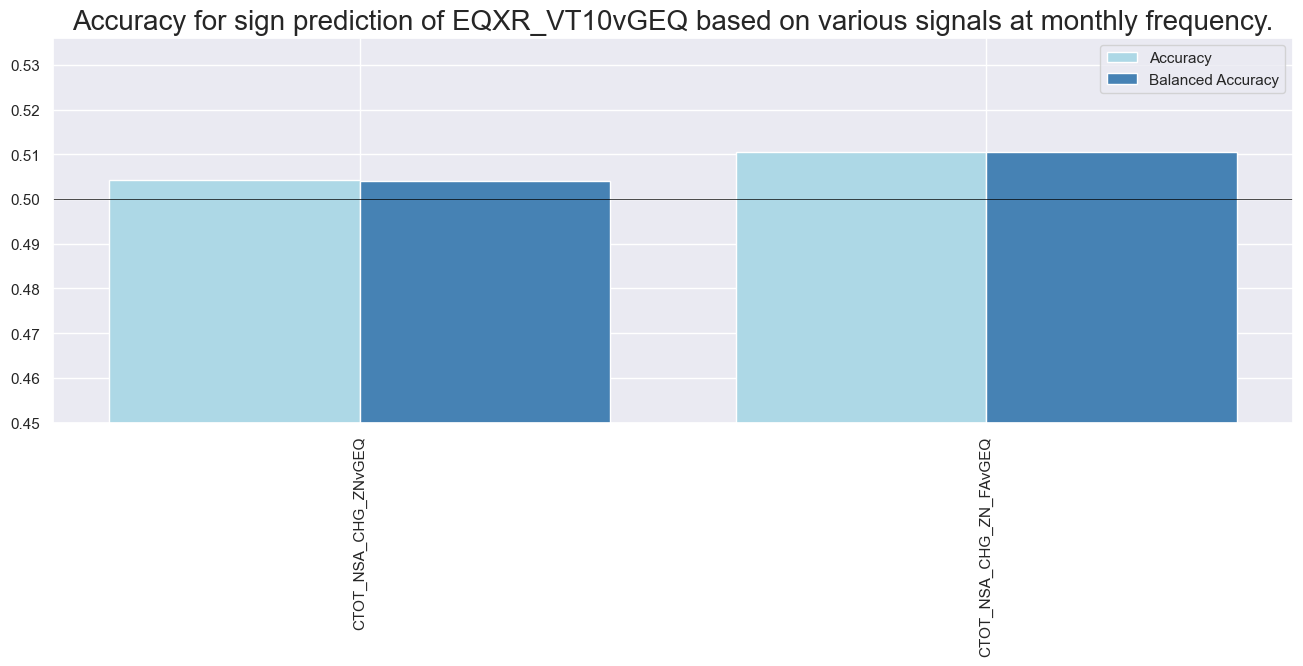
Accuracy and correlation check #
# Signal-return relations object and results

dix = dict_req
sigx = dix["sigs"]
targ = dix["targ"]
cidx = dix["cids"]
start = dix["start"]
blax = dix["black"]

srr = mss.SignalReturnRelations(
    dfx,
    sigs=sigx,
    cosp=True,
    rets=targ,
    freqs=["M"],
    blacklist=blax,
    slip=1
)

display(srr.signals_table().sort_index().astype("float").round(3).T)

dix["srr"] = srr
| Return | EQXR_VT10vGEQ | |
|---|---|---|
| Signal | CTOT_NSA_CHG_ZN_FAvGEQ | CTOT_NSA_CHG_ZNvGEQ |
| Frequency | M | M |
| Aggregation | last | last |
| accuracy | 0.511 | 0.504 |
| bal_accuracy | 0.511 | 0.504 |
| pos_sigr | 0.494 | 0.476 |
| pos_retr | 0.495 | 0.495 |
| pos_prec | 0.506 | 0.500 |
| neg_prec | 0.515 | 0.508 |
| pearson | 0.031 | 0.007 |
| pearson_pval | 0.026 | 0.629 |
| kendall | 0.022 | 0.006 |
| kendall_pval | 0.020 | 0.490 |
| auc | 0.511 | 0.504 |
# Accuracy bars

dix = dict_req
srr = dix["srr"]
sigs = dix["sigs"]

srr.accuracy_bars(
    type="signals",
    sigs=sigs,
    title=None,
    size=(16, 5),
    title_fontsize=20,
    x_labels_rotate=90,
)
Naive PnL #
dix = dict_req
sigx = dix["sigs"]
targ = dix["targ"]
cidx = dix["cids"]
start = dix["start"]
blax = dix["black"]

naive_pnl = msn.NaivePnL(
    dfx,
    ret=targ,
    sigs=sigx,
    cids=cidx,
    start=start,
    blacklist=blax,
    bms=["EUR_FXXR_NSA", "USD_EQXR_NSA", "USD_DU05YXR_NSA"],
)

for sig in list(sigx):
    naive_pnl.make_pnl(
        sig,
        sig_add=0,
        sig_op="zn_score_pan",
        thresh=2,
        rebal_freq="monthly",
        vol_scale=10,
        rebal_slip=1,
        pnl_name=sig + "_PZN",
    )

naive_pnl.make_long_pnl(label="Long only", vol_scale=10)
dix["pnls"] = naive_pnl
dix = dict_req
sigx = dix["sigs"]
cidx = dix["cids"]
start = dix["start"]
naive_pnl = dix["pnls"]

pnls = [sig + "_PZN" for sig in sigx]

naive_pnl.plot_pnls(
    pnl_cats=pnls,
    pnl_cids=["ALL"],
    start=start,
    title=None,
    title_fontsize=16,
    figsize=(16, 8),
    compounding=False,
    xcat_labels=None,
)

display(naive_pnl.evaluate_pnls(pnl_cats=pnls).astype("float").round(2))
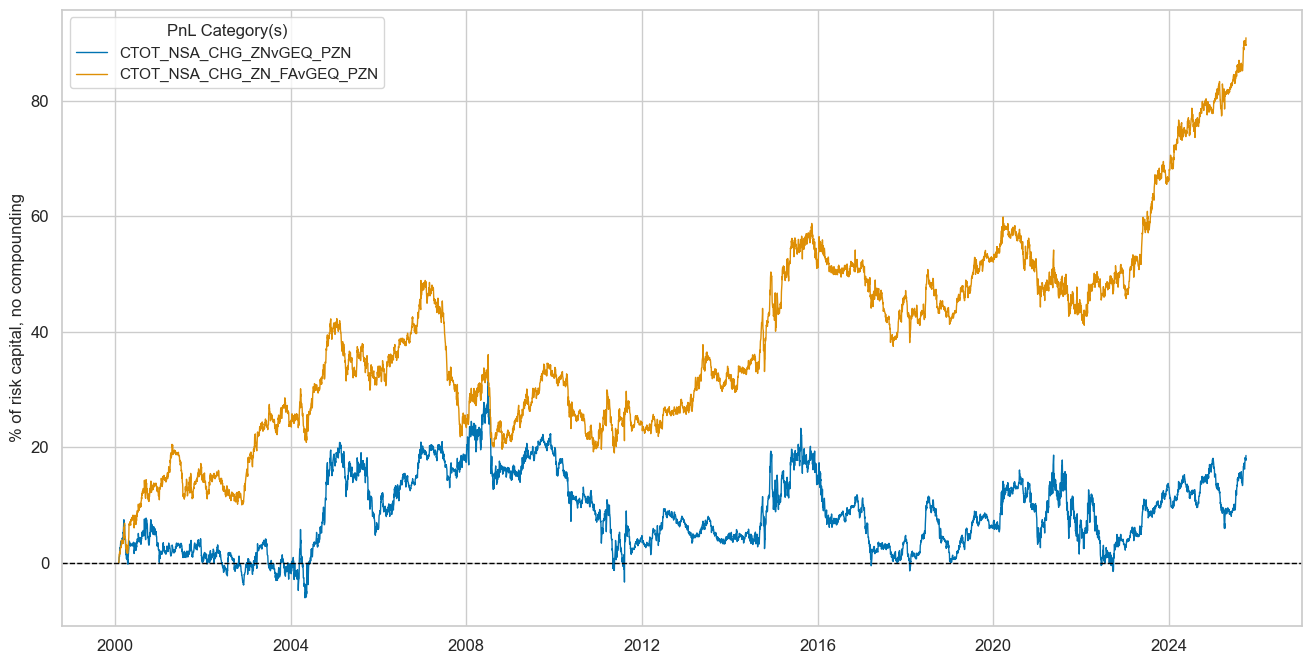
| xcat | CTOT_NSA_CHG_ZNvGEQ_PZN | CTOT_NSA_CHG_ZN_FAvGEQ_PZN |
|---|---|---|
| Return % | 0.72 | 3.54 |
| St. Dev. % | 10.00 | 10.00 |
| Sharpe Ratio | 0.07 | 0.35 |
| Sortino Ratio | 0.10 | 0.51 |
| Max 21-Day Draw % | -13.57 | -13.96 |
| Max 6-Month Draw % | -15.78 | -21.77 |
| Peak to Trough Draw % | -34.75 | -29.88 |
| Top 5% Monthly PnL Share | 4.81 | 0.95 |
| EUR_FXXR_NSA correl | -0.01 | -0.00 |
| USD_EQXR_NSA correl | 0.06 | 0.00 |
| USD_DU05YXR_NSA correl | 0.01 | 0.00 |
| Traded Months | 310.00 | 310.00 |
Strategy portfolio PnL #
Single factor strategies #
# Dictionary for all single-factor strategies

all_naive_pnls = {}
# Collect all single-signal strategy parameters

dict_pnls = {
    "DFX": {
        "title": "Directional FX",
        "dict": dict_fxd,
        "sig": "CTOT_NSA_CHG_ZN",
        "diversity": 2,
    },
    "RFX": {
        "title": "Relative FX",
        "dict": dict_fxr,
        "sig": "CTOT_NSA_CHG_ZNvGFX",
        "diversity": 2,
    },
    "DEQ": {
        "title": "Directional equity",
        "dict": dict_deq,
        "sig": "CTOT_NSA_CHG_ZN_FA",
        "diversity": 1,
    },
    "REQ": {
        "title": "Relative equity",
        "dict": dict_req,
        "sig": "CTOT_NSA_CHG_ZN_FAvGEQ",
        "diversity": 2,
    },
    "GED": {
        "title": "Equity Duration",
        "dict": dict_ged,
        "sig": "CTOT_NSA_P1W4WL1_ZN",
        "diversity": 1,
    },
}

# Signal labels
dict_sig_labs = {
    "CTOT_NSA_CHG_ZN": "ToT change, all horizons, % ar",
    "CTOT_NSA_CHG_ZN_FA": "ToT change adjusted for real appreciation, all horizons, % ar",
    "CTOT_NSA_P1W4WL1_ZN": "ToT 1-week change vs 4-week average, % ar",
    "CTOT_NSA_CHG_ZNvGFX": "Rel. ToT change, all horizons, % ar",
    "CTOT_NSA_CHG_ZN_FAvGEQ": "Rel. ToT change adjusted for appreciation, all horizons, % ar",
}
# Display PnL tables and collect figures

figs = []
axs = []
tabs = []

for k, v in dict_pnls.items():

    title = v["title"]
    dix = v["dict"]
    sig = v["sig"]
    dp = v["diversity"]

    pnl_name = f"{sig}_{k}"
    pnl_lab ={pnl_name: dict_sig_labs[sig]}

    targ = dix["targ"]
    cidx = dix["cids"]
    start = dix["start"]
    black = dix["black"]

    naive_pnl = msn.NaivePnL(
        dfx,
        ret=targ,
        sigs=[sig],
        cids=cidx,
        start=start,
        blacklist=black,
        bms=["EUR_FXXR_NSA", "USD_EQXR_NSA", "USD_DU05YXR_NSA"],
    )

    naive_pnl.make_pnl(
        sig,
        sig_op="zn_score_pan",
        thresh=2,
        rebal_freq="monthly",
        neutral="zero",
        vol_scale=None,
        leverage=(1 / len(cidx))**(1/dp),
        rebal_slip=1,
        pnl_name=pnl_name,
    )

    figs.append(plt.figure())
    axs.append(
        naive_pnl.plot_pnls(
            pnl_cats=[pnl_name],
            pnl_cids=["ALL"],
            start=start,
            figsize=(16, 8),
            compounding=False,
            title=title,
            return_fig=True,
            xcat_labels=pnl_lab
        )
    )

    tabs.append(naive_pnl.evaluate_pnls(pnl_cats=[pnl_name]))
    all_naive_pnls[pnl_name] = naive_pnl

for fig in figs:
    plt.close(fig)
# Multi-Pnl plot figure

def plot_axes(axs, rows, cols, figsize=(16, 6)):
    fig, new_axs = plt.subplots(rows, cols, figsize=figsize)
    if isinstance(new_axs, np.ndarray):
        new_axs = new_axs.flatten()
    else:
        new_axs = [new_axs]
    for i, ax in enumerate(axs):
        for line in ax.get_lines():
            new_axs[i].plot(line.get_xdata(), line.get_ydata(),
                        color=line.get_color(),
                        linewidth=line.get_linewidth(),
                        linestyle=line.get_linestyle(),
                        label=line.get_label())

        new_axs[i].set_xlim(ax.get_xlim())
        new_axs[i].set_ylim(ax.get_ylim())
        new_axs[i].set_title(ax.get_title())
        new_axs[i].set_xlabel(ax.get_xlabel())
        new_axs[i].set_ylabel(ax.get_ylabel())
        # Copy x-axis formatter and locator
        new_axs[i].xaxis.set_major_formatter(ax.xaxis.get_major_formatter())
        new_axs[i].xaxis.set_major_locator(ax.xaxis.get_major_locator())
        legend = ax.get_legend()
        if legend:
            labels = [t.get_text() for t in legend.get_texts()]
            handles = [h for h in legend.legend_handles]
            new_axs[i].legend(handles, labels)
    for j in range(len(axs), len(new_axs)):
        new_axs[j].remove()
    return fig, new_axs
# Plot all PnLs

new_fig, new_axs = plot_axes(axs, 3, 2, figsize=(20, 15))
new_fig.suptitle("Single-signal strategy PnLs", fontsize=22, y=0.94)
plt.show()
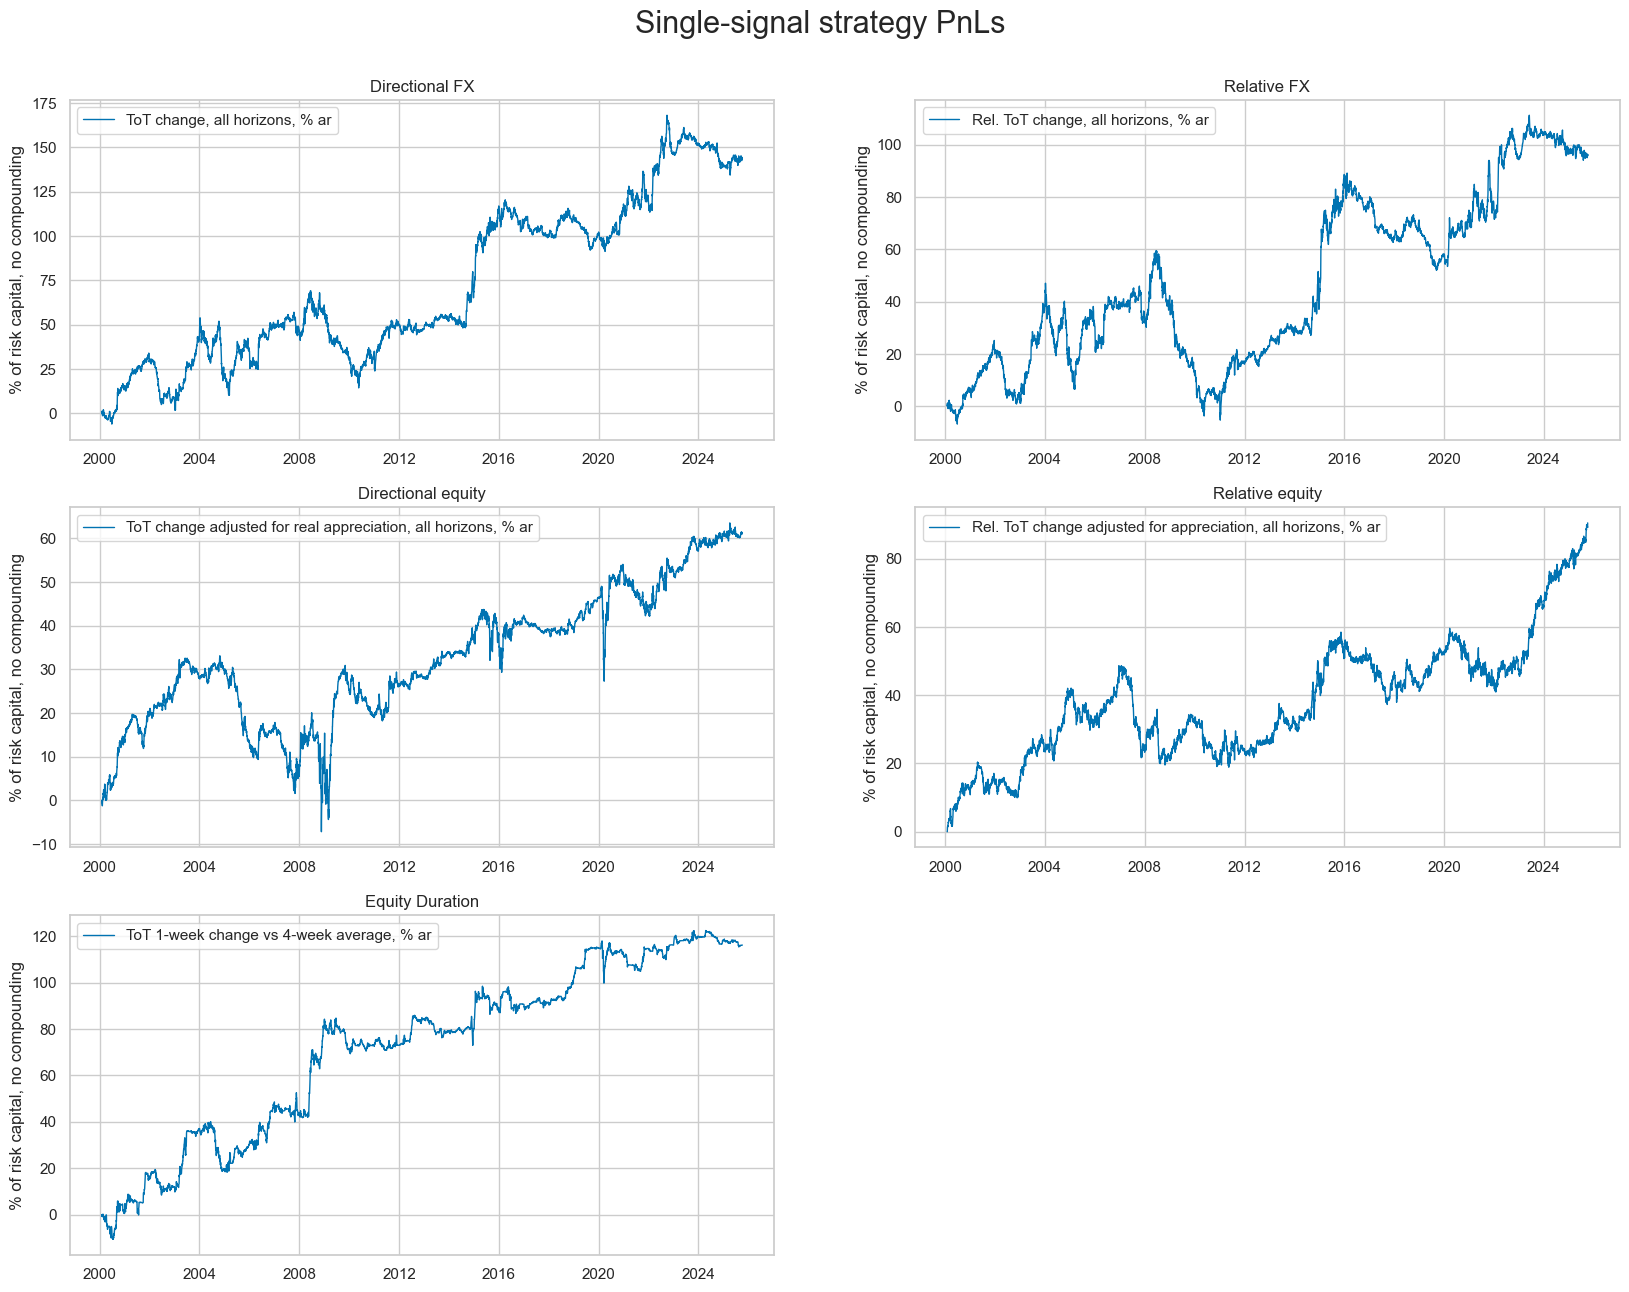
# Summary table

sumtab= pd.concat(tabs, axis=1).astype("float").round(2)
sumtab.columns = [lab[-3:] for lab in sumtab.columns]
display(sumtab)
| DFX | RFX | DEQ | REQ | GED | |
|---|---|---|---|---|---|
| Return % | 5.62 | 3.75 | 2.39 | 3.52 | 4.53 |
| St. Dev. % | 14.40 | 13.13 | 8.00 | 9.95 | 7.33 |
| Sharpe Ratio | 0.39 | 0.29 | 0.30 | 0.35 | 0.62 |
| Sortino Ratio | 0.57 | 0.41 | 0.43 | 0.51 | 0.93 |
| Max 21-Day Draw % | -23.24 | -17.49 | -21.34 | -13.90 | -18.06 |
| Max 6-Month Draw % | -35.80 | -27.46 | -22.64 | -21.67 | -21.01 |
| Peak to Trough Draw % | -54.83 | -64.88 | -40.29 | -29.74 | -21.74 |
| Top 5% Monthly PnL Share | 1.34 | 1.76 | 1.54 | 0.95 | 1.18 |
| EUR_FXXR_NSA correl | 0.02 | 0.06 | 0.02 | -0.00 | -0.05 |
| USD_EQXR_NSA correl | -0.01 | 0.01 | 0.13 | 0.00 | 0.05 |
| USD_DU05YXR_NSA correl | -0.00 | -0.00 | -0.03 | 0.00 | -0.04 |
| Traded Months | 310.00 | 310.00 | 310.00 | 310.00 | 309.00 |
Combined PnL #
# Combine PnL data into a single quantamental dataframe

unit_pnl_name = "PNLx"

df_pnls = QuantamentalDataFrame.from_qdf_list(
    [
        QuantamentalDataFrame.from_long_df(
            df=pnl.df[
                (pnl.df["xcat"] == key) & (pnl.df["cid"] == "ALL")
            ],
            cid=key[-3:],
            xcat=unit_pnl_name,
        )
        for key, pnl in all_naive_pnls.items()
    ]
)
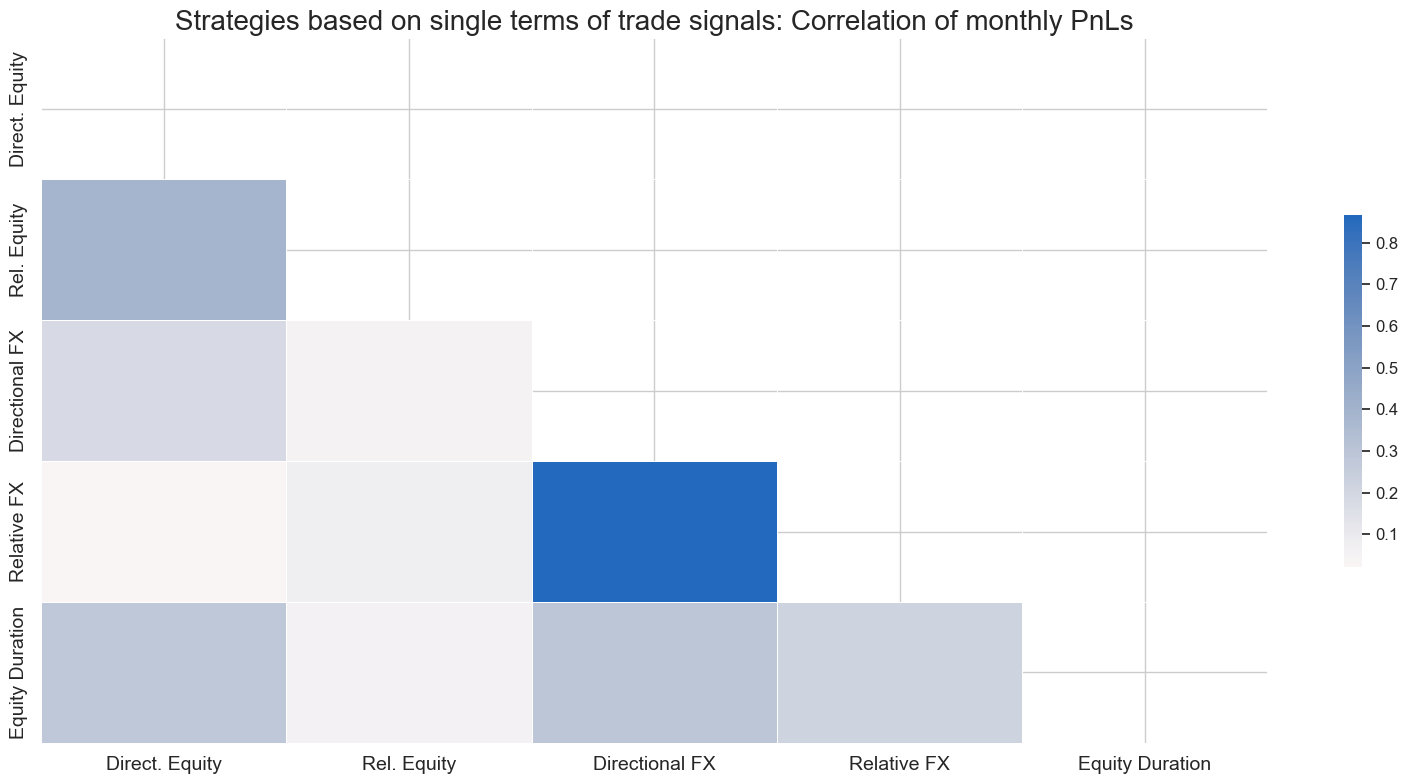
# Correlation matrix

cids_pnls = [key[-3:] for key in all_naive_pnls.keys()]
cids_labels ={
    "DFX": "Directional FX",
    "DEQ": "Direct. Equity",
    "GED": "Equity Duration",
    "RFX": "Relative FX",
    "REQ": "Rel. Equity",
}

msp.correl_matrix(
    df_pnls,
    xcats=["PNLx"],
    cids=cids_pnls,
    freq="M",
    start="2000-01-01",
    title="Strategies based on single terms of trade signals: Correlation of monthly PnLs",
    title_fontsize=20,
    size=(16, 8),
    cluster=True,
    cid_labels=cids_labels
)
# Create a wide dataframe of equal signals for each strategy

sig_value = 1
usig = "USIG"  # unit signal name
pnl_names=[pnl[-3:] for pnl in all_naive_pnls.keys()]

dt_range = pd.bdate_range(start=dfx["real_date"].min(), end=dfx["real_date"].max())
df_usigs = pd.DataFrame(
    data=sig_value, columns=pnl_names, index=dt_range
)
df_usigs.index.name = "real_date"
df_usigs.columns += f"_{usig}"
# Concat the unit signals to the PNL dataframe

df_usigs = msm.utils.ticker_df_to_qdf(df_usigs)
df_pnls = msm.update_df(df_pnls, df_usigs)
dfx = msm.update_df(dfx, df_pnls)
# Calculate the combined PnL

all_pnl = msn.NaivePnL(
    dfx,
    ret=unit_pnl_name,
    sigs=[usig],
    cids=pnl_names,
    start="2000-01-01",
    bms=["EUR_FXXR_NSA", "USD_EQXR_NSA", "USD_DU05YXR_NSA"],
)
all_pnl.make_pnl(sig=usig, sig_op="raw", leverage=1/4)

all_pnl.plot_pnls(
    pnl_cats=[f"PNL_{usig}"],
    start="2000-01-01",
    title="Combined naive PnLs of single terms of trade-signal strategies",
    title_fontsize=16,
    figsize=(13, 7),
    xcat_labels=["equally-weighted portfolio of five single-signal strategies"],
)
display(all_pnl.evaluate_pnls(pnl_cats=[f"PNL_{usig}"]))
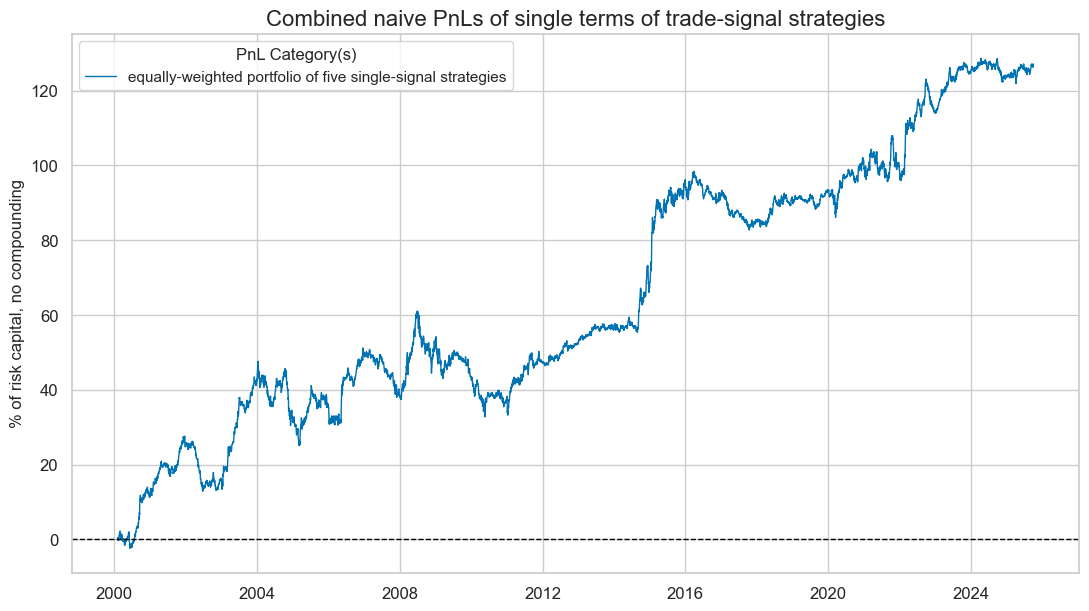
| xcat | PNL_USIG |
|---|---|
| Return % | 4.952114 |
| St. Dev. % | 8.307024 |
| Sharpe Ratio | 0.596136 |
| Sortino Ratio | 0.877259 |
| Max 21-Day Draw % | -10.857579 |
| Max 6-Month Draw % | -17.309781 |
| Peak to Trough Draw % | -28.285339 |
| Top 5% Monthly PnL Share | 0.908097 |
| EUR_FXXR_NSA correl | 0.026601 |
| USD_EQXR_NSA correl | 0.043115 |
| USD_DU05YXR_NSA correl | -0.016627 |
| Traded Months | 310 |