Governance scores #
Country governance quality plays a critical role in economic development and is an important benchmark for market-based sovereign risk premia. JPMaQS contains point-in-time scores of two prominent sources of governance-related data:
-
The Corruption Perceptions Index published by Transparency International, measures perceived levels of public sector corruption worldwide.
-
The Worldwide Governance Indicators of the World Bank include six dimensions of governance, including control of corruption, government effectiveness, regulatory quality, and rule of law.
Transparency survey #
Ticker : CORRUPTION_NSA
Label : Corruption perception score.
Definition : Corruption perception index, z-score.
Notes :
-
The score is a point-in-time transformation of the Transparency International corruption index, which is widely regarded as a benchmark for corruption risk across countries. The higher the index, the less corrupt the country.
-
The source index ranks 180 countries and territories worldwide by their perceived levels of public sector corruption, pooling 13 different corruption surveys and assessments collected from reputable institutions, including the World Bank and the World Economic Forum.
-
Our indicator is calculated by taking the latest value of the Transparency International corruption index, and normalising it sequentially and point-intime based on the mean and the standard deviation of a full panel of developed and emerging countries of JPMaQS. This means that scores incorporate both historical and cross-sectional information.
-
The data starts in 1995 for a broad set of the countries and are published once a year.
-
To read about how Transparency International compute their indices, please see appendix 1 .
-
For information on our z-scoring methodology, see appendix 2
World Bank survey scores #
Ticker : ACCOUNTABILITY_NSA / POLSTAB_NSA / GOVEFFECT_NSA / REGQUALITY_NSA / RULELAW_NSA / CORRCONTROL_NSA
Label : World Bank survey scores: Voice and accountability index / Political stability and absence of violence index / Government effectiveness index / Regulatory quality index / Rule of law index / Control of corruption index.
Definition : World Bank surveys: Voice and accountability index, z-score / Political stability and absence of violence/terrorism index, z-score / Government effectiveness index, z-score / Regulatory quality index, z-score / Rule of law index, z-score / Control of corruption index, z-score.
Notes :
-
The Voice and accountability index by the World Bank (WB) aims to capture perceptions and views of the degree to which a country’s citizens can take part in the selection of government and in the exercise of fundamental freedoms, including freedom of expression, freedom of association, and freedom of the press. The data reflect both citizens’ and experts’ views on civil liberties and political rights across countries and over time.
-
The Political Stability and Absence of Violence/Terrorism index by the World Bank (WB) captures perceptions and views regarding the likelihood that a government will be destabilised or overthrown by unconstitutional or violent means, including politically-motivated violence and terrorism. The data focuses on both domestic and international threats to political order, including civil unrest, terrorism, and armed conflict risks.
-
The Government Effectiveness index captures perceptions of the efficiency and quality of public services, the professionalism and independence of the civil service, and the government’s ability to implement sound policies. It aggregates views from both citizens and experts across multiple reputable sources, reflecting how reliably public institutions perform. The index provides insights into the strength of state capacity and the credibility of policy commitments.
-
The Regulatory Quality index by the World Bank (WB) captures perceptions and views of the government’s ability to formulate and implement sound policies and regulations that permit and promote private sector development. The data assess both the market-friendliness and the predictability of regulatory environments across countries and over time.
-
The Rule of Law index by the World Bank (WB) captures perceptions and views of the extent to which individuals have confidence in and abide by the rules of society, including the quality of contract enforcement, property rights, the police, the judiciary, and the likelihood of crime and violence. The data represents both the institutional strength of legal frameworks and societal trust in formal dispute resolution mechanisms.
-
The Control of Corruption index by the World Bank (WB) captures perceptions and views of the extent to which public power is exercised for private gain, including both petty and grand corruption, as well as “capture” of the state by elites and private interests. The data encompasses both actual experiences of corruption and the general public’s and experts’ perceptions of corrupt practices across countries and over time.
-
The WB indices are computed by aggregating seven major surveys of firm managers and 24 data sources coming from expert assessments reflecting the perceptions and views of experts affiliated with a range of NGO, private sector, and government sector organisations.
-
JPMaQS scores are calculated by taking the point-in-time value for any governance index in percentile terms. We then normalise it versus the mean and the standard deviation of the panel. This is done on a vintage-specific basis, so that the final score incorporates both historical and cross-sectional information up to that point.
-
The data starts in 1998 for a broad set of the countries and is published yearly. We have set the release dates at the end of September of each year as this is when the World Bank publishes its governance indicators.
-
To read about how the World Bank compute their indices, please see appendix 1 .
-
For information on our z-scoring methodology, see appendix 2
Imports #
Only the standard Python data science packages and the specialized
macrosynergy
package are needed.
import os
import numpy as np
import pandas as pd
from pandas import Timestamp
import matplotlib.pyplot as plt
import seaborn as sns
import math

import json
import yaml

import macrosynergy.management as msm
import macrosynergy.panel as msp
import macrosynergy.signal as mss
import macrosynergy.pnl as msn
import macrosynergy.visuals as msv

from macrosynergy.download import JPMaQSDownload

from timeit import default_timer as timer
from datetime import timedelta, date, datetime

import warnings

warnings.simplefilter("ignore")
The
JPMaQS
indicators we consider are downloaded using the J.P. Morgan Dataquery API interface within the
macrosynergy
package. This is done by specifying
ticker strings
, formed by appending an indicator category code
<category>
to a currency area code
<cross_section>
. These constitute the main part of a full quantamental indicator ticker, taking the form
DB(JPMAQS,<cross_section>_<category>,<info>)
, where
<info>
denotes the time series of information for the given cross-section and category. The following types of information are available:
-
valuegiving the latest available values for the indicator -
eop_lagreferring to days elapsed since the end of the observation period -
mop_lagreferring to the number of days elapsed since the mean observation period -
gradedenoting a grade of the observation, giving a metric of real time information quality.
After instantiating the
JPMaQSDownload
class within the
macrosynergy.download
module, one can use the
download(tickers,start_date,metrics)
method to easily download the necessary data, where
tickers
is an array of ticker strings,
start_date
is the first collection date to be considered and
metrics
is an array comprising the times series information to be downloaded.
Only the standard Python data science packages and the specialized
macrosynergy
package are needed.
cids_dmca = [
    "AUD",
    "CAD",
    "CHF",
    "GBP",
    "JPY",
    "NOK",
    "NZD",
    "SEK",
    "USD",
]  # DM currency areas

cids_dmec = ["DEM", "ESP", "FRF", "ITL", "NLG"]  # DM euro area countries

cids_latm = ["BRL", "CLP", "COP", "MXN", "PEN"]  # Latam countries

cids_emea = ["CZK", "HUF", "ILS", "PLN", "RUB", "TRY", "ZAR", "RON", "RSD"]  # EMEA countries

cids_emas = [
    "CNY",
    "INR",
    "KRW",
    "MYR",
    "PHP",
    "SGD",
    "THB",
    "TWD",
]  # EM Asia countries

cids_frontier = [
    "AED",
    "ARS",
    "BHD",
    "DOP",
    "EGP",
    "NGN",
    "OMR",
    "PAB",
    "QAR",
    "SAR",
    "UYU",
    "VEF",
]

# Combine all developed and emerging market codes
cids_dm = cids_dmca + cids_dmec
cids_em = cids_latm + cids_emea + cids_emas + cids_frontier
cids_fc = sorted(list(set(cids_latm + cids_emea + cids_frontier)))

# Full list of available cross-sections
cids = sorted(cids_dm + cids_em)
corruption = [
    "CORRUPTION_NSA"
]
governance = [
    "ACCOUNTABILITY_NSA",
    "POLSTAB_NSA",
    "GOVEFFECT_NSA",
    "REGQUALITY_NSA",
    "RULELAW_NSA",
    "CORRCONTROL_NSA",
]

gov_scores = corruption + governance

# Features
govfin = [
    "GGOBGDPRATIO_NSA",
    "GGOBGDPRATIONY_NSA",
    "GGDGDPRATIO_NSA",
]

xbal = [
    "CABGDPRATIO_NSA_12MMA",
    "MTBGDPRATIO_NSA_12MMA",
]

xliab = [
    "NIIPGDP_NSA_D1Mv2YMA",
    "NIIPGDP_NSA_D1Mv5YMA",
    "IIPLIABGDP_NSA_D1Mv2YMA",
    "IIPLIABGDP_NSA_D1Mv5YMA",
]

xdebt = [
    "ALLIFCDSGDP_NSA",
    "GGIFCDSGDP_NSA",
]

risk_metrics = [
    "LTFCRATING_NSA",
    "LTLCRATING_NSA",
    "FCBICRY_NSA",
    "FCBICRY_VT10",
    "CDS05YSPRD_NSA",
    "CDS05YXRxEASD_NSA",
    "NIIPGDP_NSA_D1Mv5YMA"
]

features = govfin + xbal + xliab + xdebt + risk_metrics

targets = [
    'FCBIR_NSA',
    'CDS05YXR_NSA'
]

xcats = corruption + governance + targets + features
# Download series from J.P. Morgan DataQuery by tickers

start_date = "1990-01-01"
tickers = [cid + "_" + xcat for cid in cids for xcat in xcats]
print(f"Maximum number of tickers is {len(tickers)}")

# Retrieve credentials

client_id: str = os.getenv("DQ_CLIENT_ID")
client_secret: str = os.getenv("DQ_CLIENT_SECRET")

# Download from DataQuery

with JPMaQSDownload(client_id=client_id, client_secret=client_secret) as downloader:
    start = timer()
    assert downloader.check_connection()
    df = downloader.download(
        tickers=tickers,
        start_date=start_date,
        metrics=["value", "eop_lag", "mop_lag", "grading"],
        suppress_warning=True,
        show_progress=True,
    )
    end = timer()

dfd = df

print("Download time from DQ: " + str(timedelta(seconds=end - start)))
Maximum number of tickers is 1296
Downloading data from JPMaQS.
Timestamp UTC:  2025-05-09 12:50:07
Connection successful!
Requesting data: 100%|███████████████████████████████████████████████████████████████| 250/250 [00:55<00:00,  4.51it/s]
Downloading data: 100%|██████████████████████████████████████████████████████████████| 250/250 [01:30<00:00,  2.78it/s]
Some expressions are missing from the downloaded data. Check logger output for complete list.
696 out of 4992 expressions are missing. To download the catalogue of all available expressions and filter the unavailable expressions, set `get_catalogue=True` in the call to `JPMaQSDownload.download()`.
Some dates are missing from the downloaded data.
74 out of 9224 dates are missing.
Download time from DQ: 0:02:42.893371
Availability #
cids_exp = cids  # cids expected in category panels
msm.missing_in_df(dfd, xcats=gov_scores, cids=cids_exp)
No missing XCATs across DataFrame.
Missing cids for ACCOUNTABILITY_NSA:  []
Missing cids for CORRCONTROL_NSA:     []
Missing cids for CORRUPTION_NSA:      []
Missing cids for GOVEFFECT_NSA:       []
Missing cids for POLSTAB_NSA:         []
Missing cids for REGQUALITY_NSA:      []
Missing cids for RULELAW_NSA:         []
xcatx = xcats
cidx = cids_exp
dfx = msm.reduce_df(dfd, xcats=xcatx, cids=cidx)
xcatx = gov_scores
cidx = cids_fc

dfs = msm.reduce_df(dfd, xcats=xcatx, cids=cidx)
dfs = msm.check_startyears(
    dfs,
)
msm.visual_paneldates(dfs, size=(18, 8))

print("Last updated:", date.today())
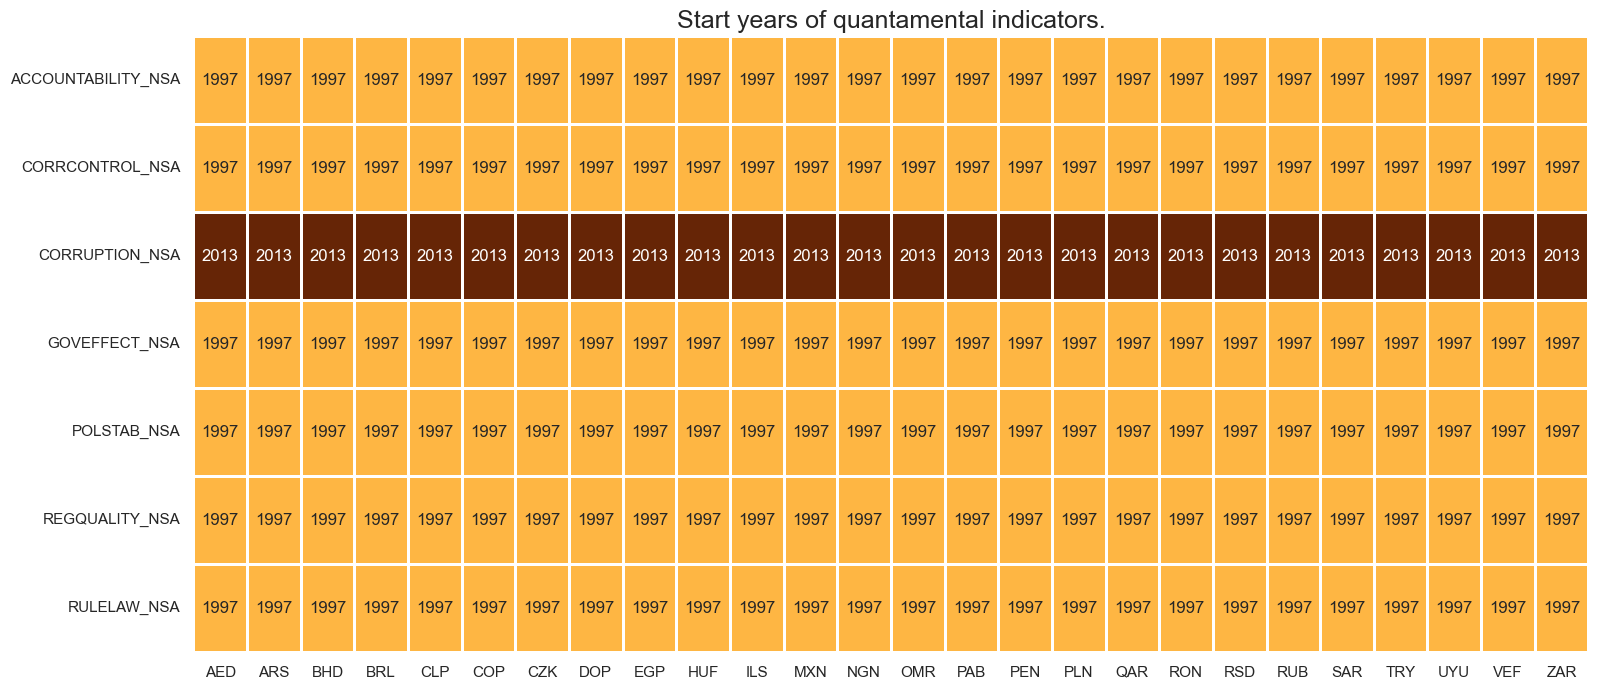
Last updated: 2025-05-09
History #
Corruption scores are mostly structural indicators and non-overlapping across many country pairs, even over decades.
xcatx = corruption
cidx = cids

msp.view_ranges(
    dfd,
    xcats=xcatx,
    cids=cids,
    sort_cids_by="std",
    kind="box",
    title="Boxplots of corruption scores, since inception",
    xcat_labels=["Corruption score"],
    size=(16, 8),
)

xcatx = corruption
cidx = cids
msp.view_timelines(
    dfd,
    xcats=xcatx,
    cids=cidx,
    start="2000-01-01",
    title="Transparency international corruption score, z-score",
    # title_adj=1.05,
    title_xadj=0.455,
    title_fontsize=22,
    legend_fontsize=17,
    label_adj=0.2,
    xcat_labels=["Corruption score"],
    cumsum=False,
    ncol=3,
    same_y=False,
    size=(12, 7),
    aspect=1.7,
    all_xticks=True,
)
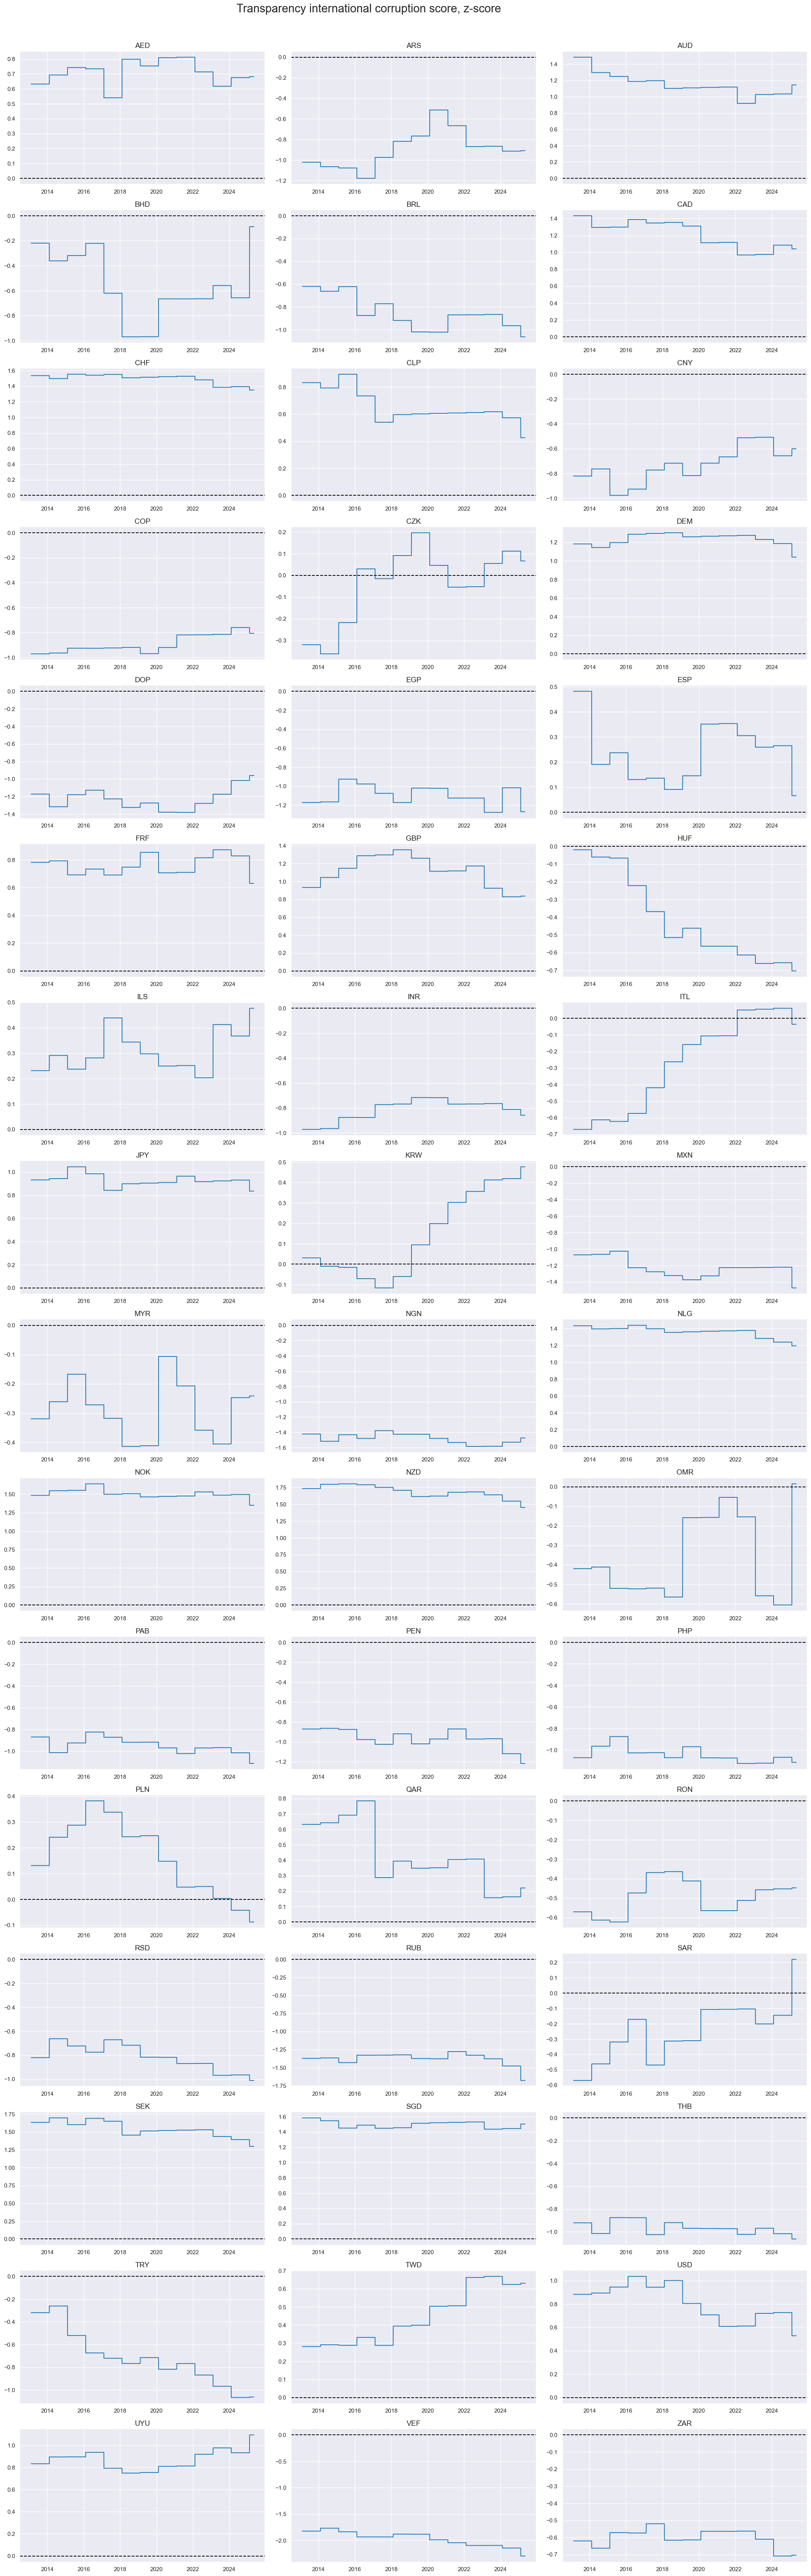
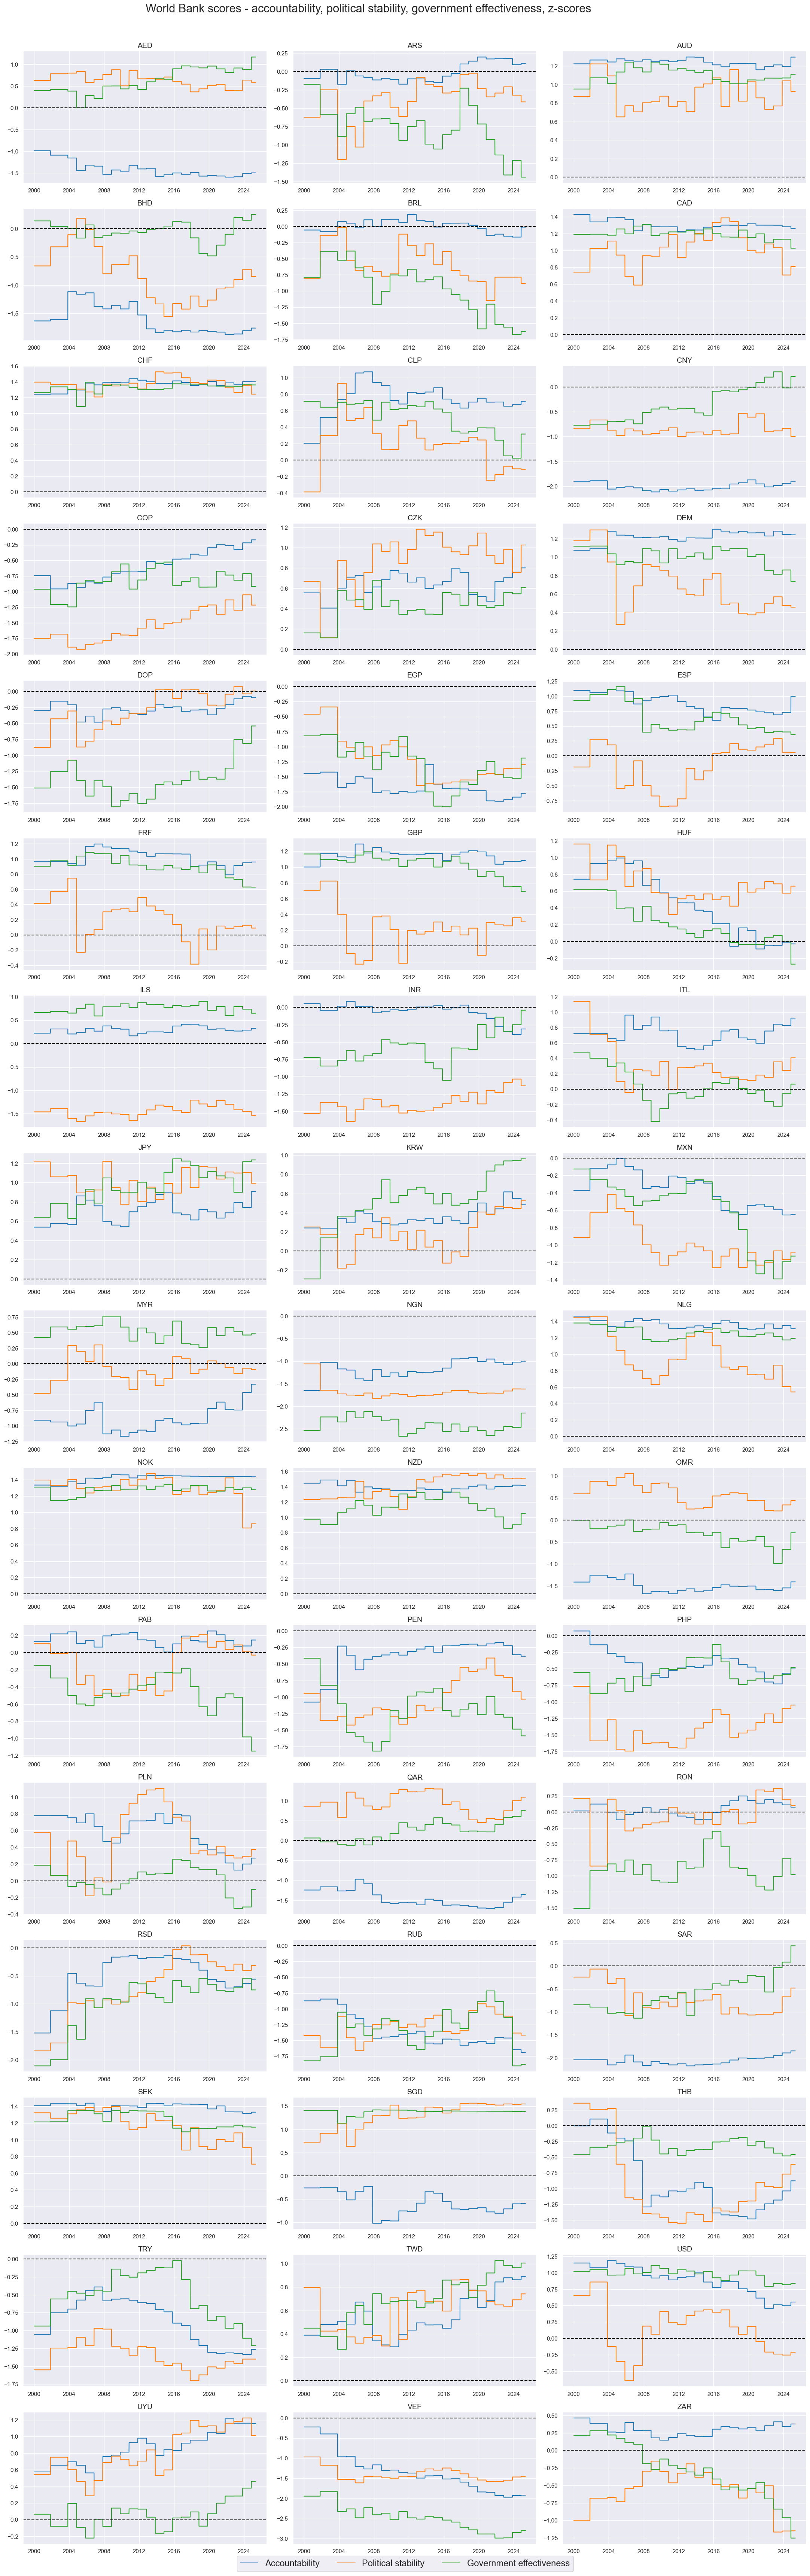
Also World Bank governance scores are largely structural. Importantly, there can be huge differences across different aspects of governance within one country. This means that weighting and selection of scores for the purpose of trading signal generation is of great importance.
xcatx = [
    "ACCOUNTABILITY_NSA",
    "POLSTAB_NSA",
    "GOVEFFECT_NSA",
]

cidx = cids
msp.view_timelines(
    dfd,
    xcats=xcatx,
    cids=cidx,
    start="2000-01-01",
    title="World Bank scores - accountability, political stability, government effectiveness, z-scores",
    # title_adj=1.05,
    title_xadj=0.455,
    title_fontsize=22,
    legend_fontsize=17,
    label_adj=0.2,
    xcat_labels=["Accountability", "Political stability", "Government effectiveness"],
    cumsum=False,
    ncol=3,
    same_y=False,
    size=(12, 7),
    aspect=1.7,
    all_xticks=True,
)
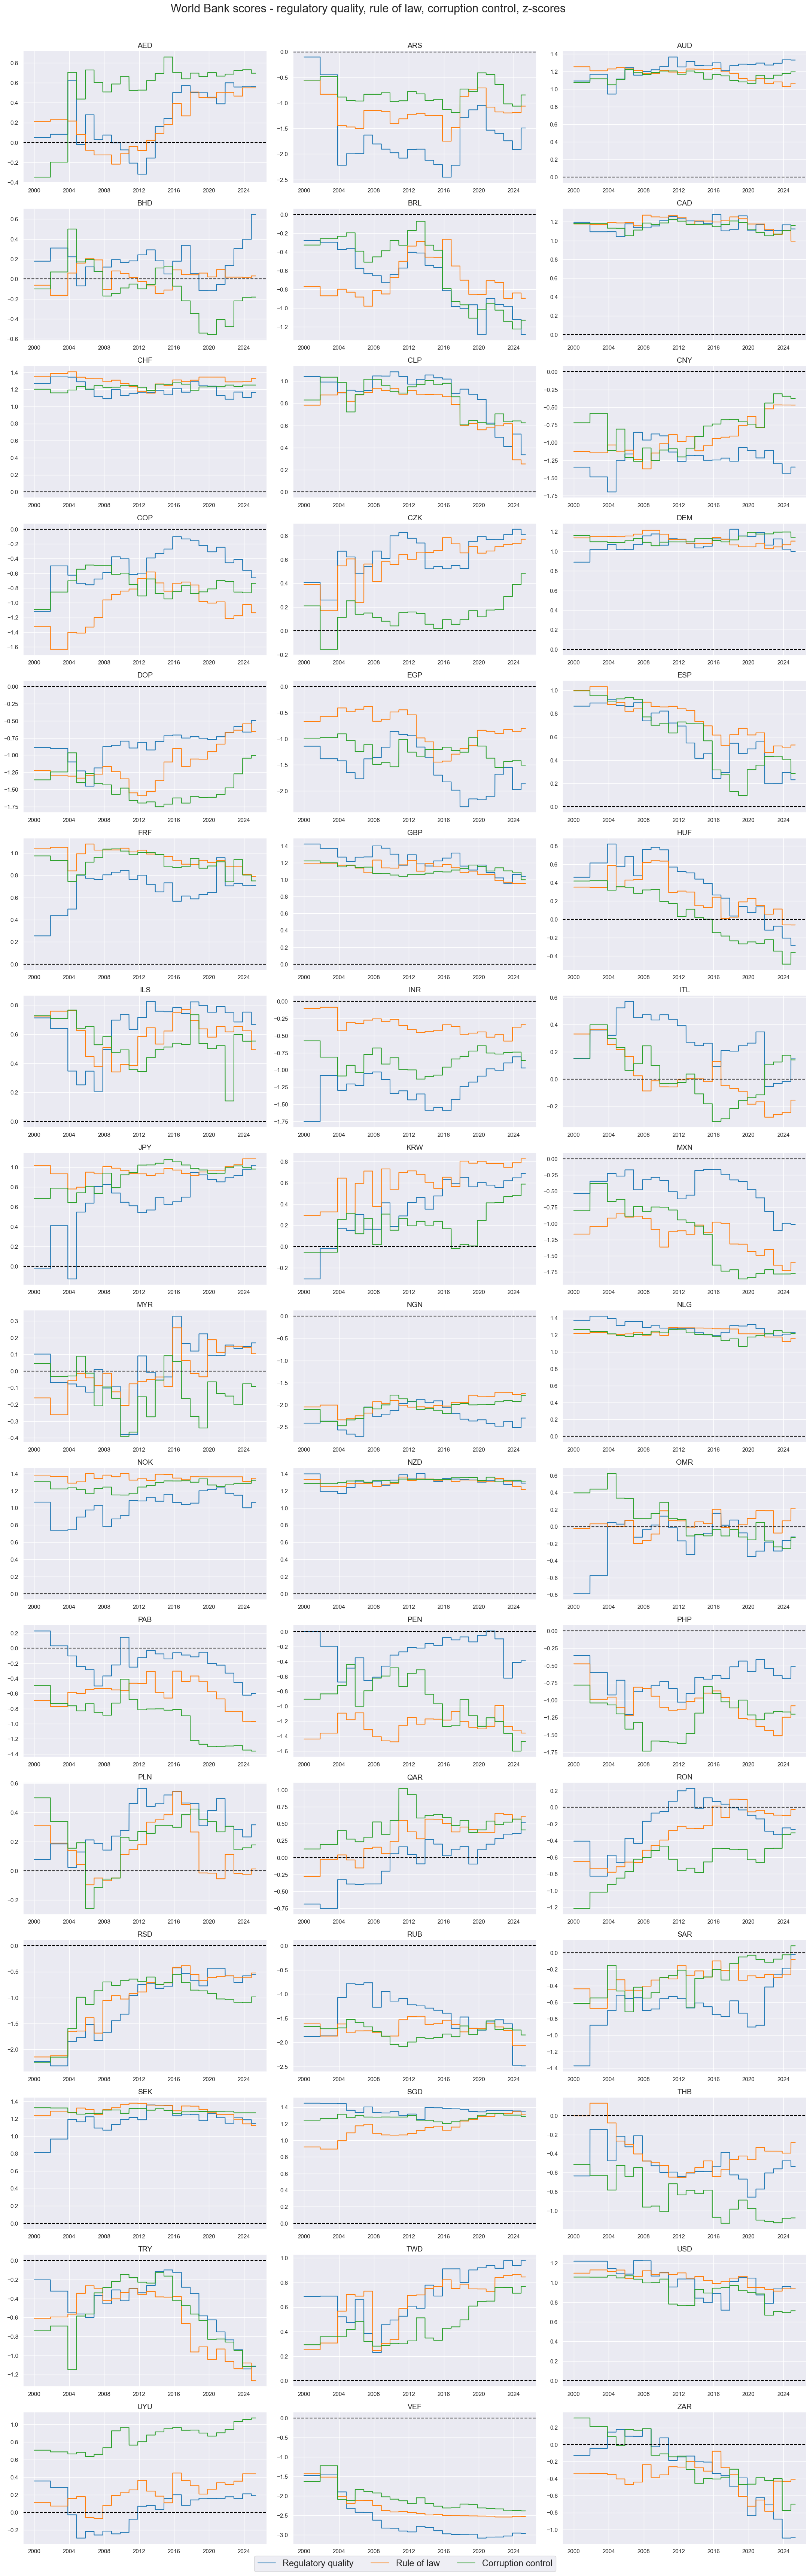
xcatx = [
    "REGQUALITY_NSA",
    "RULELAW_NSA",
    "CORRCONTROL_NSA",
]

cidx = cids
msp.view_timelines(
    dfd,
    xcats=xcatx,
    cids=cidx,
    start="2000-01-01",
    title="World Bank scores - regulatory quality, rule of law, corruption control, z-scores",
    title_xadj=0.455,
    title_fontsize=22,
    legend_fontsize=17,
    label_adj=0.2,
    xcat_labels=["Regulatory quality", "Rule of law", "Corruption control"],
    cumsum=False,
    ncol=3,
    same_y=False,
    size=(12, 7),
    aspect=1.7,
    all_xticks=True,
)
Importance #
Research links #
“The central question addressed by this study is whether countries with above-average governance grew faster than countries with below-average governance. Using the World Bank’s worldwide governance indicators to measure governance performance, it examines whether a country with governance “surplus” in a given base year (1998) grew faster on average in a subsequent period (1998-2011) than a country with governance “deficit.” Governance is defined in several dimensions, including government effectiveness, political stability, control of corruption and regulatory quality, voice and accountability, and rule of law. The study finds that government effectiveness, political stability, control of corruption and regulatory quality all have a more significant positive impact on country growth performance than voice and accountability and rule of law.” Han, Ali Khan, Zhuang
“Our empirical analysis found that political stability and absence of violence (PSA) and regulatory quality (REQ) positively influence sustainable investment returns in the Asian region. While control of corruption (COC) exhibits a significant negative impact on sustainable investment returns. These findings imply that more excellent political stability and reasonable regulations contribute to higher stock market returns.” Darsono, Wong, Nguyen, Jati, Dewant
“This study uses international asset pricing models to investigate the link between the quality of government institutions and the performance of global stock markets. The results demonstrate a significant positive association between stock market performance measures and the quality of the institutional environment.” Hooper, Boon Sim, Uppal
Empirical clues #
Governance scores are an important building block for the estimation of macro risk premia, i.e., the difference between market-implied sovereign risk compensation and actual indicator-based risk. This is particularly relevant for sovereign credit markets. Here we follow the methodology of published research (“EM sovereign bond allocation with macro risk premium scores”) to build series of macro risk premium scores. We then analyse the relationships between governance-adjusted risk-premiumn scores and foreign currency bond returns.
# Governing dictionary

dict_macros = {
    "GOVFIN":{
        "GGOBGDPRATIO_NSA": ["median", ""],
        "GGOBGDPRATIONY_NSA": ["median", ""],
        "GGDGDPRATIO_NSA": ["median", "NEG"],
    },
    "XBAL":{
        "CABGDPRATIO_NSA_12MMA": ["zero", ""],
        "MTBGDPRATIO_NSA_12MMA": ["zero", ""],
    },
    "XLIAB":{
        "NIIPGDP_NSA_D1Mv2YMA": ["zero", ""],
        "NIIPGDP_NSA_D1Mv5YMA": ["zero", ""],
        "IIPLIABGDP_NSA_D1Mv2YMA": ["zero", "NEG"],
        "IIPLIABGDP_NSA_D1Mv5YMA": ["zero", "NEG"],
    },
    "XDEBT":{
        "ALLIFCDSGDP_NSA": ["median", "NEG"],
        "GGIFCDSGDP_NSA": ["median", "NEG"],
    },
}

dict_factz = {}
dict_labels = {}
# Normalize all macro-quantamental categories based on the broad EM set

cidx = cids_em

for fact in dict_macros.keys():

    dict_fact = dict_macros[fact]
    xcatx = list(dict_fact.keys())

    dfa = pd.DataFrame(columns=list(dfx.columns))

    for xc in xcatx:

        postfix = dict_fact[xc][1]
        neutral = dict_fact[xc][0]

        dfaa = msp.make_zn_scores(
            dfx,
            xcat=xc,
            cids=cidx,
            sequential=True,
            min_obs=261 * 3,
            neutral=neutral,
            pan_weight=1,
            thresh=3,
            postfix="_" + postfix + "ZN",
            est_freq="m",
        )
        dfaa["value"] = dfaa["value"] * (1 if postfix == "" else -1)
        dfa = msm.update_df(dfa, dfaa)

    dict_factz[fact] = dfa["xcat"].unique()
    dfx = msm.update_df(dfx, dfa)
# Combine quantamental scores to conceptual scores

cidx = cids_em

for key, value in dict_factz.items():

    dfa = msp.linear_composite(
        dfx,
        xcats=value,
        cids=cidx,
        complete_xcats=False,
        new_xcat=key,
    )

    dfx = msm.update_df(dfx, dfa)

for key in dict_factz.keys():

    dfa = msp.make_zn_scores(
        dfx,
        xcat=key,
        cids=cidx,
        sequential=True,
        min_obs=261 * 3,
        neutral="zero",
        pan_weight=1,
        thresh=3,
        postfix="_ZN",
        est_freq="m",
    )

    dfx = msm.update_df(dfx, dfa)
# Use index carry where CDS spreads not available ("priced risk" score)
black_fc = {'RUB': [Timestamp('2022-02-01 00:00:00'), Timestamp('2035-02-26 00:00:00')]}
msm.missing_in_df(df, xcats=["CDS05YSPRD_NSA"], cids=cids_fc)   # countries without CDS
cidx = ['AED', 'DOP', 'EGP', 'INR', 'NGN', 'OMR', 'QAR', 'RSD', 'SAR', 'UYU']

calcs = ["CDS05YSPRD_NSA = FCBICRY_NSA"]
dfa = msp.panel_calculator(dfx, calcs=calcs, cids=cidx)
dfx = msm.update_df(dfx, dfa)

# Use inverse rating score ("rated risk" score)

calcs = ["LTFCRATING_INV = 1 / LTFCRATING_NSA"]
cidx = cids_fc
dfa = msp.panel_calculator(dfx, calcs=calcs, cids=cidx)
dfx = msm.update_df(dfx, dfa)

# Normalize spreads and ratings
cidx = cids_fc
xcatx = ["CDS05YSPRD_NSA", "LTFCRATING_INV"]

for xc in xcatx:
    dfa = msp.make_zn_scores(
        dfx,
        xcat=xc,
        cids=cidx,
        sequential=True,
        min_obs=261 * 3,
        neutral="median",
        pan_weight=1,
        blacklist=black_fc,
        thresh=3,
        postfix="_ZN",
        est_freq="m",
    )

    dfx = msm.update_df(dfx, dfa)
No missing XCATs across DataFrame.
Missing cids for CDS05YSPRD_NSA:  ['AED', 'ARS', 'BHD', 'DOP', 'EGP', 'NGN', 'OMR', 'PAB', 'QAR', 'RSD', 'SAR', 'UYU', 'VEF']
# Calculations of Spread-based premium scores

cidx = cids_fc

calcs_spread = [
    "SPREADvGOVFIN = CDS05YSPRD_NSA_ZN + GOVFIN_ZN",
    "SPREADvXBAL = CDS05YSPRD_NSA_ZN + XBAL_ZN",
    "SPREADvXLIAB = CDS05YSPRD_NSA_ZN + XLIAB_ZN",
    "SPREADvXDEBT = CDS05YSPRD_NSA_ZN + XDEBT_ZN",
]

calcs_rating = [
    "RATINGvGOVFIN = LTFCRATING_INV_ZN + GOVFIN_ZN",
    "RATINGvXBAL = LTFCRATING_INV_ZN + XBAL_ZN",
    "RATINGvXLIAB = LTFCRATING_INV_ZN + XLIAB_ZN",
    "RATINGvXDEBT = LTFCRATING_INV_ZN + XDEBT_ZN",
]

calcs = calcs_spread + calcs_rating

dfa = msp.panel_calculator(dfx, calcs=calcs, cids=cidx)
dfx = msm.update_df(dfx, dfa)

spread_macros = ["SPREADvGOVFIN", "SPREADvXBAL", "SPREADvXLIAB", "SPREADvXDEBT"]
rating_macros = ["RATINGvGOVFIN", "RATINGvXBAL", "RATINGvXLIAB", "RATINGvXDEBT"]

dict_labels["SPREADvMACRO"] = "Spread-based premium score"
dict_labels["RATINGvMACRO"] = "Rating-based premium score"
dict_labels["RISKvMACRO"] = "Broad macro risk premium score excluding governance"
dict_labels["RISKxMACRO"] = "Market risk score"
cidx = cids_fc
dict_risks = {
"SPREADvMACRO": spread_macros,
"RATINGvMACRO": rating_macros,
"RISKvMACRO": ["SPREADvMACRO", "RATINGvMACRO"],
# Transparency International corruption computations
"SPREADvMACROvCORR": ["SPREADvMACRO", "CORRUPTION_NSA"],
"RATINGvMACROvCORR": ["RATINGvMACRO", "CORRUPTION_NSA"],
"RISKvMACROvCORR": ["RISKvMACRO", "CORRUPTION_NSA"],
# World Bank governance computations
"GOVERNANCE_MEAN": ["ACCOUNTABILITY_NSA", "POLSTAB_NSA", "CORRCONTROL_NSA"],
"GOVvRISKvMACRO": ["RISKvMACRO", "GOVERNANCE_MEAN"],
# Universal mean
"FULLGOVSCORE": ["CORRUPTION_NSA", "ACCOUNTABILITY_NSA", "POLSTAB_NSA", "CORRCONTROL_NSA", "GOVEFFECT_NSA", "REGQUALITY_NSA", "RULELAW_NSA"],
"FULLGOVSCOREvRISKvMACRO": ["RISKvMACRO", "FULLGOVSCORE"]
}
for key, value in dict_risks.items():
dfa = msp.linear_composite(
dfx,
xcats=value,
cids=cidx,
complete_xcats=False,
new_xcat=key,
)
dfx = msm.update_df(dfx, dfa)
dict_labels["RISKvMACROvCORR"] = "Corruption-based market risk score (Transparency)"
dict_labels["GOVvRISKvMACRO"] = "Governance-based market risk score (World Bank)"
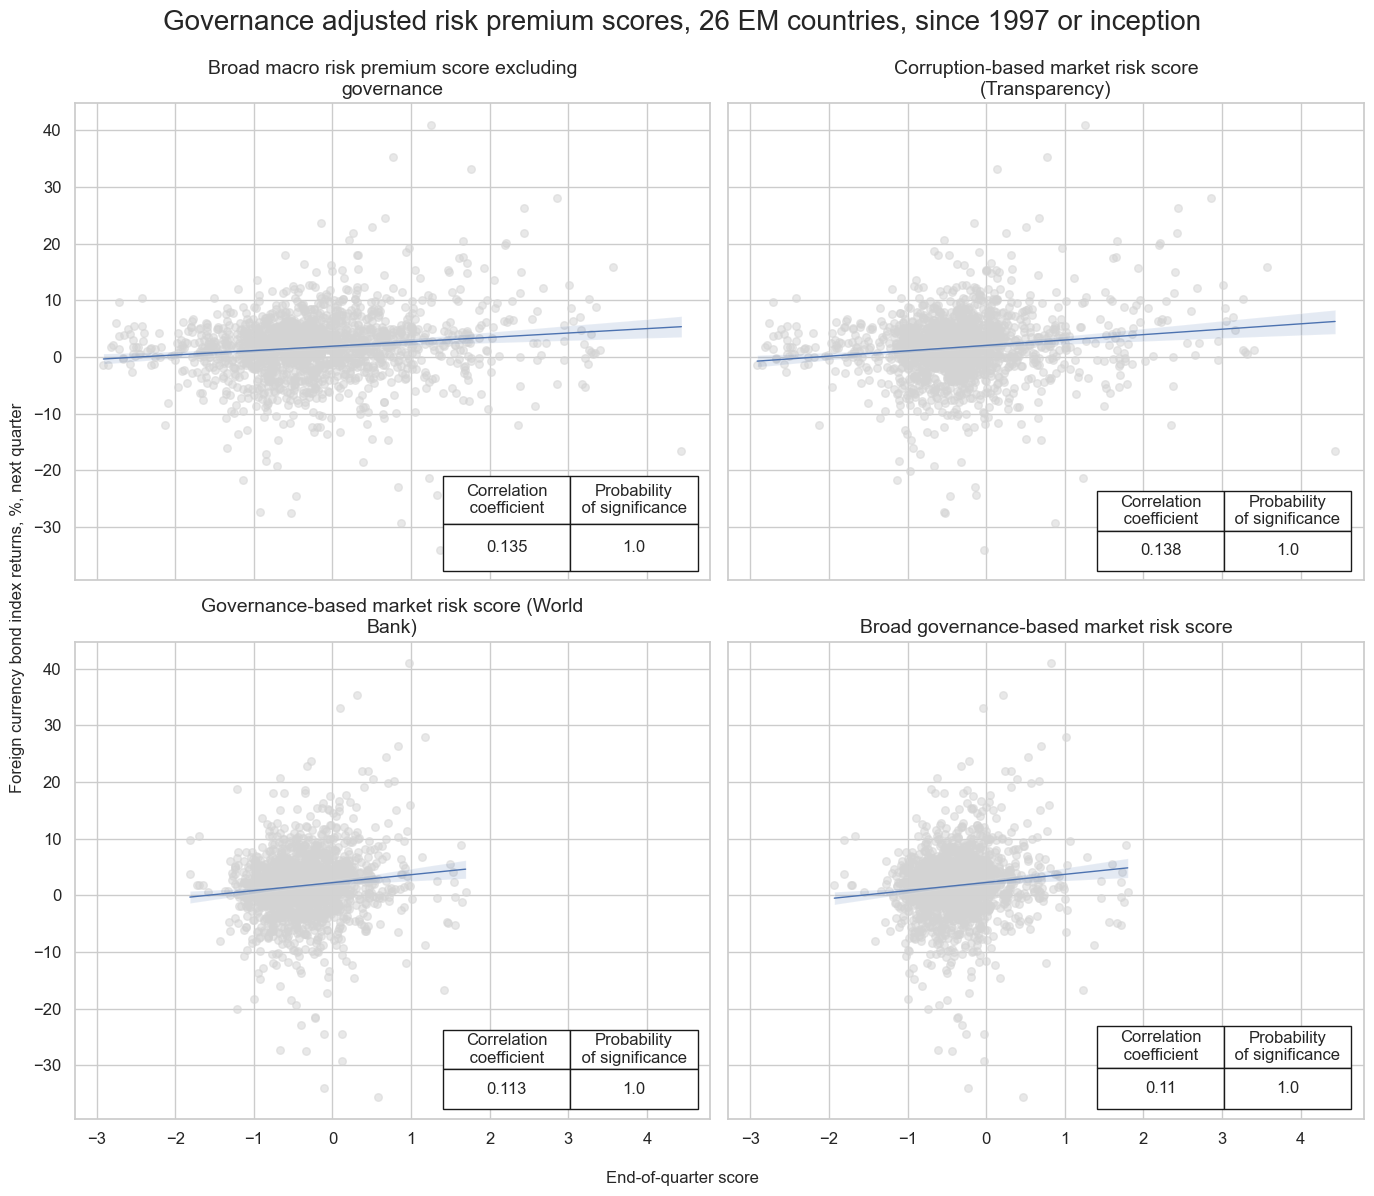
dict_labels["FULLGOVSCOREvRISKvMACRO"] = "Broad governance-based market risk score"
Governance-based macro risk scores based on Transparency and World Bank indicators show a positive relationship with foreign currency bond index returns, similar to other risk scores based on other macro performance indicators. This means if spread scores are high and governance scores positive, there is a tendency towards positive returns. If spread scores are low and governance scores are poor, there is a tendency towards negative returns. This relationship is particularly significant for the corruption-adjusted risk premium score.
dict_dir = {
    "sigs": ["RISKvMACRO", "RISKvMACROvCORR", "GOVvRISKvMACRO", "FULLGOVSCOREvRISKvMACRO"],
    "targ": "FCBIR_NSA",
    "cidx": cids_fc,
    "start": "2000-01-01",
    "black": black_fc,
    "srr": None,
    "pnls": None,
}

dix = dict_dir

sigs = dix['sigs']
ret = dix["targ"]
cidx = dix["cidx"]
start = dix["start"]
black = dix["black"]

catregs = {}
for sig in sigs:
    catregs[sig] = msp.CategoryRelations(
        dfx,
        xcats=[sig, ret],
        cids=cidx,
        freq="Q",
        lag=1,
        xcat_aggs=["last", "sum"],
        start=start,
        blacklist=black_fc,
    )

msv.multiple_reg_scatter(
    cat_rels=[v for k, v in catregs.items()],
    ncol=2,
    nrow=2,
    figsize=(14, 12),
    title="Governance adjusted risk premium scores, 26 EM countries, since 1997 or inception",
    title_xadj=0.5,
    title_yadj=0.99,
    title_fontsize=20,
    xlab="End-of-quarter score",
    ylab="Foreign currency bond index returns, %, next quarter",
    coef_box="lower right",
    prob_est="map",
    single_chart=True,
    subplot_titles=[dict_labels[key] for key in sigs]
)
RISKvMACRO misses: ['BHD'].
FCBIR_NSA misses: ['ARS', 'CZK', 'ILS', 'PAB', 'VEF'].
FCBIR_NSA misses: ['ARS', 'CZK', 'ILS', 'PAB', 'VEF'].
FCBIR_NSA misses: ['ARS', 'CZK', 'ILS', 'PAB', 'VEF'].
FCBIR_NSA misses: ['ARS', 'CZK', 'ILS', 'PAB', 'VEF'].
Appendices #
Appendix 1: World Bank and Transparency International Methodology #
Transparency International methodology
The Transparency International methodology (here) follows four basic steps: selection of the data, rescaling, aggregating and reporting. The Corruption Perception Index (CPI) draws upon 13 data sources which capture the assessment of experts and business executives on a number of corrupt behaviours in the public sector, among which:
• Bribery
• Diversion of public funds
• Use of public office for private gain
• Nepotism in the civil service
• State capture
In addition, a series of other mechanisms to prevent corruption are looked at, such as:
• The government’s ability to enforce integrity mechanisms
• The effective prosecution of corrupt officials
• Red tape and excessive bureaucratic burden
• The existence of adequate laws on financial disclosure, conflict of interest, prevention and access to information
• Legal protection for whistleblowers, journalists and investigators
To ensure the integrity and consistency of the Corruption Perceptions Index (CPI), Transparency International rigorously evaluates each data source against five core criteria: methodological robustness and institutional credibility, alignment with the concept of public sector corruption, sufficient scoring granularity (at least a four-point scale, 0 to 100), cross-country comparability, and multi-year data availability. Only data from professional institutions with transparent and sound methodologies are accepted, and all sources must assess corruption levels or risks specific to the public sector. To maintain international comparability, sources must use consistent metrics across countries. Additionally, only those designed for repeated use over time are included to support longitudinal analysis. All accepted scores are standardised onto a 0–100 scale, where 0 indicates maximum perceived corruption and 100 the least.
To address gaps in coverage across data sources used in the Corruption Perceptions Index (CPI), Transparency International performs an imputation process for a designated baseline year using Stata’s “impute” command. This estimates missing values based on sources that cover at least 50% of the countries in the CPI, with the exception of specific cases like the Bertelsmann indices. Once imputation is complete, the mean and standard deviation of each source are calculated and used to standardise all scores into z-scores, ensuring a distribution centred at zero with unit variance. Crucially, these z-scores are derived using parameters from the imputed baseline year, maintaining consistency across years. However, the imputed values themselves are not included in the final CPI score calculation—they serve only to establish the global parameters. Finally, the z-scores are rescaled to the CPI’s 0–100 scale, with a transformation that sets the mean at 45 and standard deviation at 20.
World Bank methodology
The World Bank’s methodology for constructing governance indicators begins by collecting a wide range of source data from surveys and expert assessments. The methodology follows that of Kauffmann, Kraay and Zoido-Lobaton (1999), Kraay and MAstruzzi (2004, 2011).
The methodology used is that of the ‘Unobserved Components Model’ (UCM), whereby each individual indicator reflects only a noisy and incomplete view of the true quality of governance. Since the actual underlying governance level cannot be directly measured, the WB is faced with the problem of extracting the most reliable estimate from imperfect observations. The UCM offers a formal solution to this challenge by statistically combining the various indicators to produce the most precise possible estimate, subject to certain modelling assumptions detailed later.
For each of the six dimensions of governance discussed in Section 2, the WB assumes that the relationship between the observed data and the unobserved level of governance is as follows:
where 𝑦(𝑐, 𝑘) represents the observed data for country 𝑐 on data source 𝑘; 𝑔(𝑐) is the unobserved level of governance in country 𝑐 which is assumed to have zero mean and unit standard deviation across countries; 𝜀(𝑐, 𝑘) is the measurement error in data source 𝑘 for country 𝑐 which is assumed to have zero mean and variance 𝜎^2 (𝑘); and 𝛼(𝑘) and 𝛽(𝑘) are source-specific parameters that map the unobserved level of governance in the country into the observed data. The above model is then estimated separately for each of the six dimensions of governance.
The variable g(c) is then normalised to have zero mean and unit standard deviation, by choice. Further, 𝑔(𝑐) and 𝜀(𝑐, 𝑘) are assumed to be normally distributed and mutually independent. Being 𝑦(𝑐, 𝑘) and 𝑔(𝑐) also jointly normally distributed, it follows that:
where 𝑦(𝑐) ≡ (𝑦(𝑐, 1), … , 𝑦(𝑐,𝐾(𝑐)))′ denotes the 𝐾(𝑐) × 1 vector of data sources available for country 𝑐. This conditional mean serves as our estimate of governance for each country.
The parameters of the UCM are estimated by maximum likelihood estimation. The aggregate measures are reported in two ways: (a) in their natural underlying standard normal units, ranging from approximately -2.5 to 2.5, and (b) in percentile rank terms ranging from 0 to 100.
Appendix 2: Z-scoring methodology #
It is these percentiles coming from Transparency International and the World Bank that we use to calculate our vintage-specific z-scores. The percentiles are scored in a vintage-specific manner, taking into account both the history and the panel of cross-sections.
The z-scorisation takes the following form for indicator i:
where:
z(n, t, r): z-score of indicator for country n at release r with observation dates T
N = number of cross sections
T = number of observation dates
R = release dates
x(n, t, r): raw indicator value for country n at release r with observation dates T
𝜇(r): panel mean of indicator, for all cross sections N for all observation dates up to T, for a given release date 𝑟
𝜎(𝑖): panel standard deviation of indicator, for all cross sections N for all observation dates up to T, for a given release date 𝑟
Appendix 2: Currency symbols #
The word ‘cross-section’ refers to currencies, currency areas or economic areas. In alphabetical order, these are AED (Emirates dirham), AUD (Australian dollar), ARS (Argentinian peso) BHD (Bahraini Dinar), BRL (Brazilian real), CAD (Canadian dollar), CHF (Swiss franc), CLP (Chilean peso), CNY (Chinese yuan renminbi), COP (Colombian peso), CZK (Czech Republic koruna), DEM (German mark), DOP (Dominican Peso), EGP (Egyptian Pound), ESP (Spanish peseta), EUR (Euro), FRF (French franc), GBP (British pound), HKD (Hong Kong dollar), HUF (Hungarian forint), IDR (Indonesian rupiah), ITL (Italian lira), JPY (Japanese yen), KRW (Korean won), MXN (Mexican peso), MYR (Malaysian ringgit), NGN (Nigerian Naira), NLG (Dutch guilder), NOK (Norwegian krone), NZD (New Zealand dollar), OMR (Omani Rial), QAR (Qatari Riyal), PAB (Panamanian balboa), PEN (Peruvian sol), PHP (Phillipine peso), PLN (Polish zloty), RON (Romanian leu), RSD (Serbian Dinar), RUB (Russian ruble), SEK (Swedish krona), SAR (Saudi riyal), SGD (Singaporean dollar), THB (Thai baht), TRY (Turkish lira), TWD (Taiwanese dollar), UYU (Peso Uruguayo), USD (U.S. dollar), VEF (Venezuelan bolívar), ZAR (South African rand).