Signal optimization basics #
Get packages and JPMaQS data #
# Run only if needed!
"""
%%capture
!pip install macrosynergy --upgrade"""
'\n%%capture\n!pip install macrosynergy --upgrade'
import os
import pandas as pd
import numpy as np
import seaborn as sns
import random

from sklearn.pipeline import Pipeline
from sklearn.linear_model import LogisticRegression, LinearRegression
from sklearn.ensemble import RandomForestRegressor, RandomForestClassifier, VotingRegressor, VotingClassifier

from sklearn.metrics import (
    make_scorer,
    balanced_accuracy_score,
    r2_score,
    matthews_corrcoef
)
import scipy.stats as stats

import macrosynergy.management as msm
import macrosynergy.panel as msp
import macrosynergy.pnl as msn
import macrosynergy.signal as mss
import macrosynergy.learning as msl
from macrosynergy.download import JPMaQSDownload

import warnings

np.random.seed(42)
random.seed(42)

warnings.simplefilter("ignore")
# Cross-sections of interest

cids_dm = ["AUD", "CAD", "CHF", "EUR", "GBP", "JPY", "NOK", "NZD", "SEK", "USD"]
cids_em = [
    "CLP",
    "COP",
    "CZK",
    "HUF",
    "IDR",
    "ILS",
    "INR",
    "KRW",
    "MXN",
    "PLN",
    "THB",
    "TRY",
    "TWD",
    "ZAR",
]
cids = sorted(cids_dm + cids_em)
cids_dux = sorted(list(set(cids) - set(["IDR", "INR", "NZD", "TRY"])))
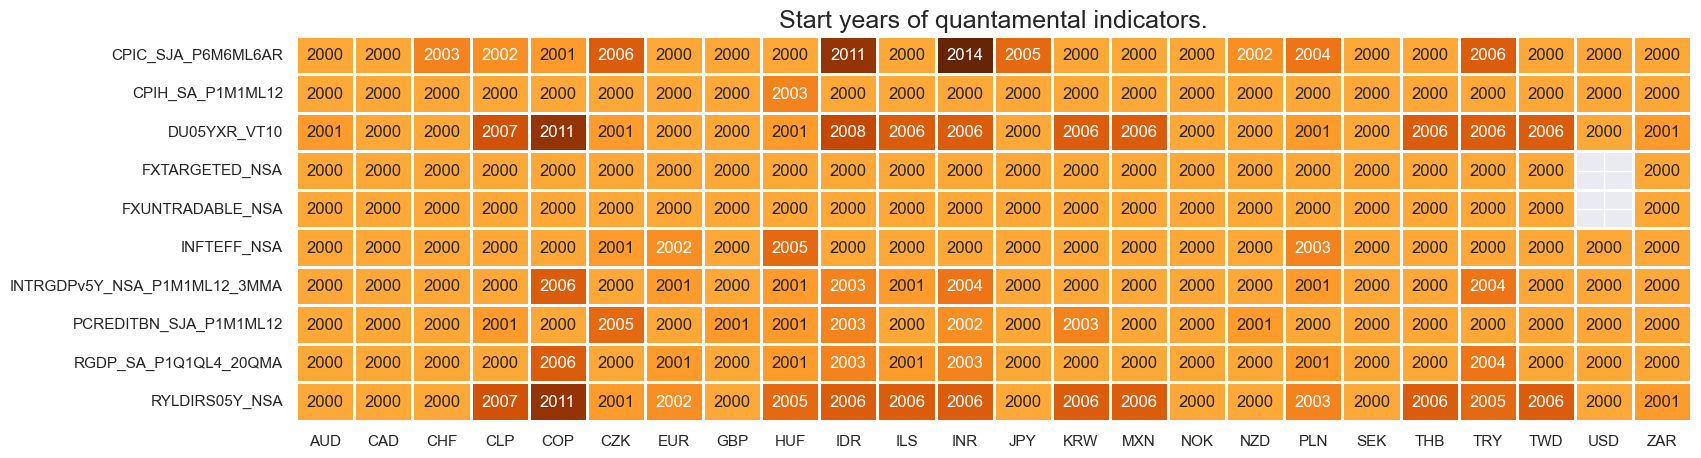
# Quantamental categories of interest

main = [
    "RYLDIRS05Y_NSA",
    "INTRGDPv5Y_NSA_P1M1ML12_3MMA",
    "CPIC_SJA_P6M6ML6AR",
    "CPIH_SA_P1M1ML12",
    "INFTEFF_NSA",
    "PCREDITBN_SJA_P1M1ML12",
    "RGDP_SA_P1Q1QL4_20QMA",
]

mkts = [
    "DU05YXR_VT10",
    "FXTARGETED_NSA",
    "FXUNTRADABLE_NSA"
]


xcats = main + mkts
# Resultant tickers for download

tickers = [cid + "_" + xcat for cid in cids for xcat in xcats] + [
    "USD_DU05YXR_NSA",
    "USD_GB10YXR_NSA",
]
# Download series from J.P. Morgan DataQuery by tickers

start_date = "2000-01-01"
end_date = None

# Retrieve credentials

oauth_id = os.getenv("DQ_CLIENT_ID")  # Replace with own client ID
oauth_secret = os.getenv("DQ_CLIENT_SECRET")  # Replace with own secret

# Download from DataQuery

with JPMaQSDownload(client_id=oauth_id, client_secret=oauth_secret) as downloader:
    df = downloader.download(
        tickers=tickers,
        start_date=start_date,
        end_date=end_date,
        metrics=["value"],
        suppress_warning=True,
        show_progress=True,
    )

dfx = df.copy()
dfx.info()
Downloading data from JPMaQS.
Timestamp UTC:  2025-03-13 20:23:49
Connection successful!
Requesting data: 100%|█████████████████████████████████████████████████████████████████| 13/13 [00:02<00:00,  4.62it/s]
Downloading data: 100%|████████████████████████████████████████████████████████████████| 13/13 [00:13<00:00,  1.04s/it]
Some expressions are missing from the downloaded data. Check logger output for complete list.
2 out of 242 expressions are missing. To download the catalogue of all available expressions and filter the unavailable expressions, set `get_catalogue=True` in the call to `JPMaQSDownload.download()`.
Some dates are missing from the downloaded data.
2 out of 6576 dates are missing.
<class 'pandas.core.frame.DataFrame'>
RangeIndex: 1500682 entries, 0 to 1500681
Data columns (total 4 columns):
 #   Column     Non-Null Count    Dtype
---  ------     --------------    -----
 0   real_date  1500682 non-null  datetime64[ns]
 1   cid        1500682 non-null  object
 2   xcat       1500682 non-null  object
 3   value      1500682 non-null  float64
dtypes: datetime64[ns](1), float64(1), object(2)
memory usage: 45.8+ MB
Availability and blacklisting #
msm.missing_in_df(df, xcats=xcats, cids=cids)
No missing XCATs across DataFrame.
Missing cids for CPIC_SJA_P6M6ML6AR:            []
Missing cids for CPIH_SA_P1M1ML12:              []
Missing cids for DU05YXR_VT10:                  []
Missing cids for FXTARGETED_NSA:                ['USD']
Missing cids for FXUNTRADABLE_NSA:              ['USD']
Missing cids for INFTEFF_NSA:                   []
Missing cids for INTRGDPv5Y_NSA_P1M1ML12_3MMA:  []
Missing cids for PCREDITBN_SJA_P1M1ML12:        []
Missing cids for RGDP_SA_P1Q1QL4_20QMA:         []
Missing cids for RYLDIRS05Y_NSA:                []
msm.check_availability(df=dfx, xcats=xcats, cids=cids, missing_recent=False)
# Create blacklisting dictionary

dfb = df[df["xcat"].isin(["FXTARGETED_NSA", "FXUNTRADABLE_NSA"])].loc[
    :, ["cid", "xcat", "real_date", "value"]
]
dfba = (
    dfb.groupby(["cid", "real_date"])
    .aggregate(value=pd.NamedAgg(column="value", aggfunc="max"))
    .reset_index()
)
dfba["xcat"] = "FXBLACK"
fxblack = msp.make_blacklist(dfba, "FXBLACK")
fxblack
{'CHF': (Timestamp('2011-10-03 00:00:00'), Timestamp('2015-01-30 00:00:00')),
 'CZK': (Timestamp('2014-01-01 00:00:00'), Timestamp('2017-07-31 00:00:00')),
 'ILS': (Timestamp('2000-01-03 00:00:00'), Timestamp('2005-12-30 00:00:00')),
 'INR': (Timestamp('2000-01-03 00:00:00'), Timestamp('2004-12-31 00:00:00')),
 'THB': (Timestamp('2007-01-01 00:00:00'), Timestamp('2008-11-28 00:00:00')),
 'TRY_1': (Timestamp('2000-01-03 00:00:00'), Timestamp('2003-09-30 00:00:00')),
 'TRY_2': (Timestamp('2020-01-01 00:00:00'), Timestamp('2024-07-31 00:00:00'))}
Transformation and checks #
Signal constituent candidates #
calcs = [
    "XGDP_NEG = - INTRGDPv5Y_NSA_P1M1ML12_3MMA",
    "XCPI_NEG =  - ( CPIC_SJA_P6M6ML6AR + CPIH_SA_P1M1ML12 ) / 2 + INFTEFF_NSA",
    "XPCG_NEG = - PCREDITBN_SJA_P1M1ML12 + INFTEFF_NSA + RGDP_SA_P1Q1QL4_20QMA",
    "XRYLDIRS05Y_NSA = RYLDIRS05Y_NSA",
]

dfa = msp.panel_calculator(dfx, calcs=calcs, cids=cids)
dfx = msm.update_df(dfx, dfa)
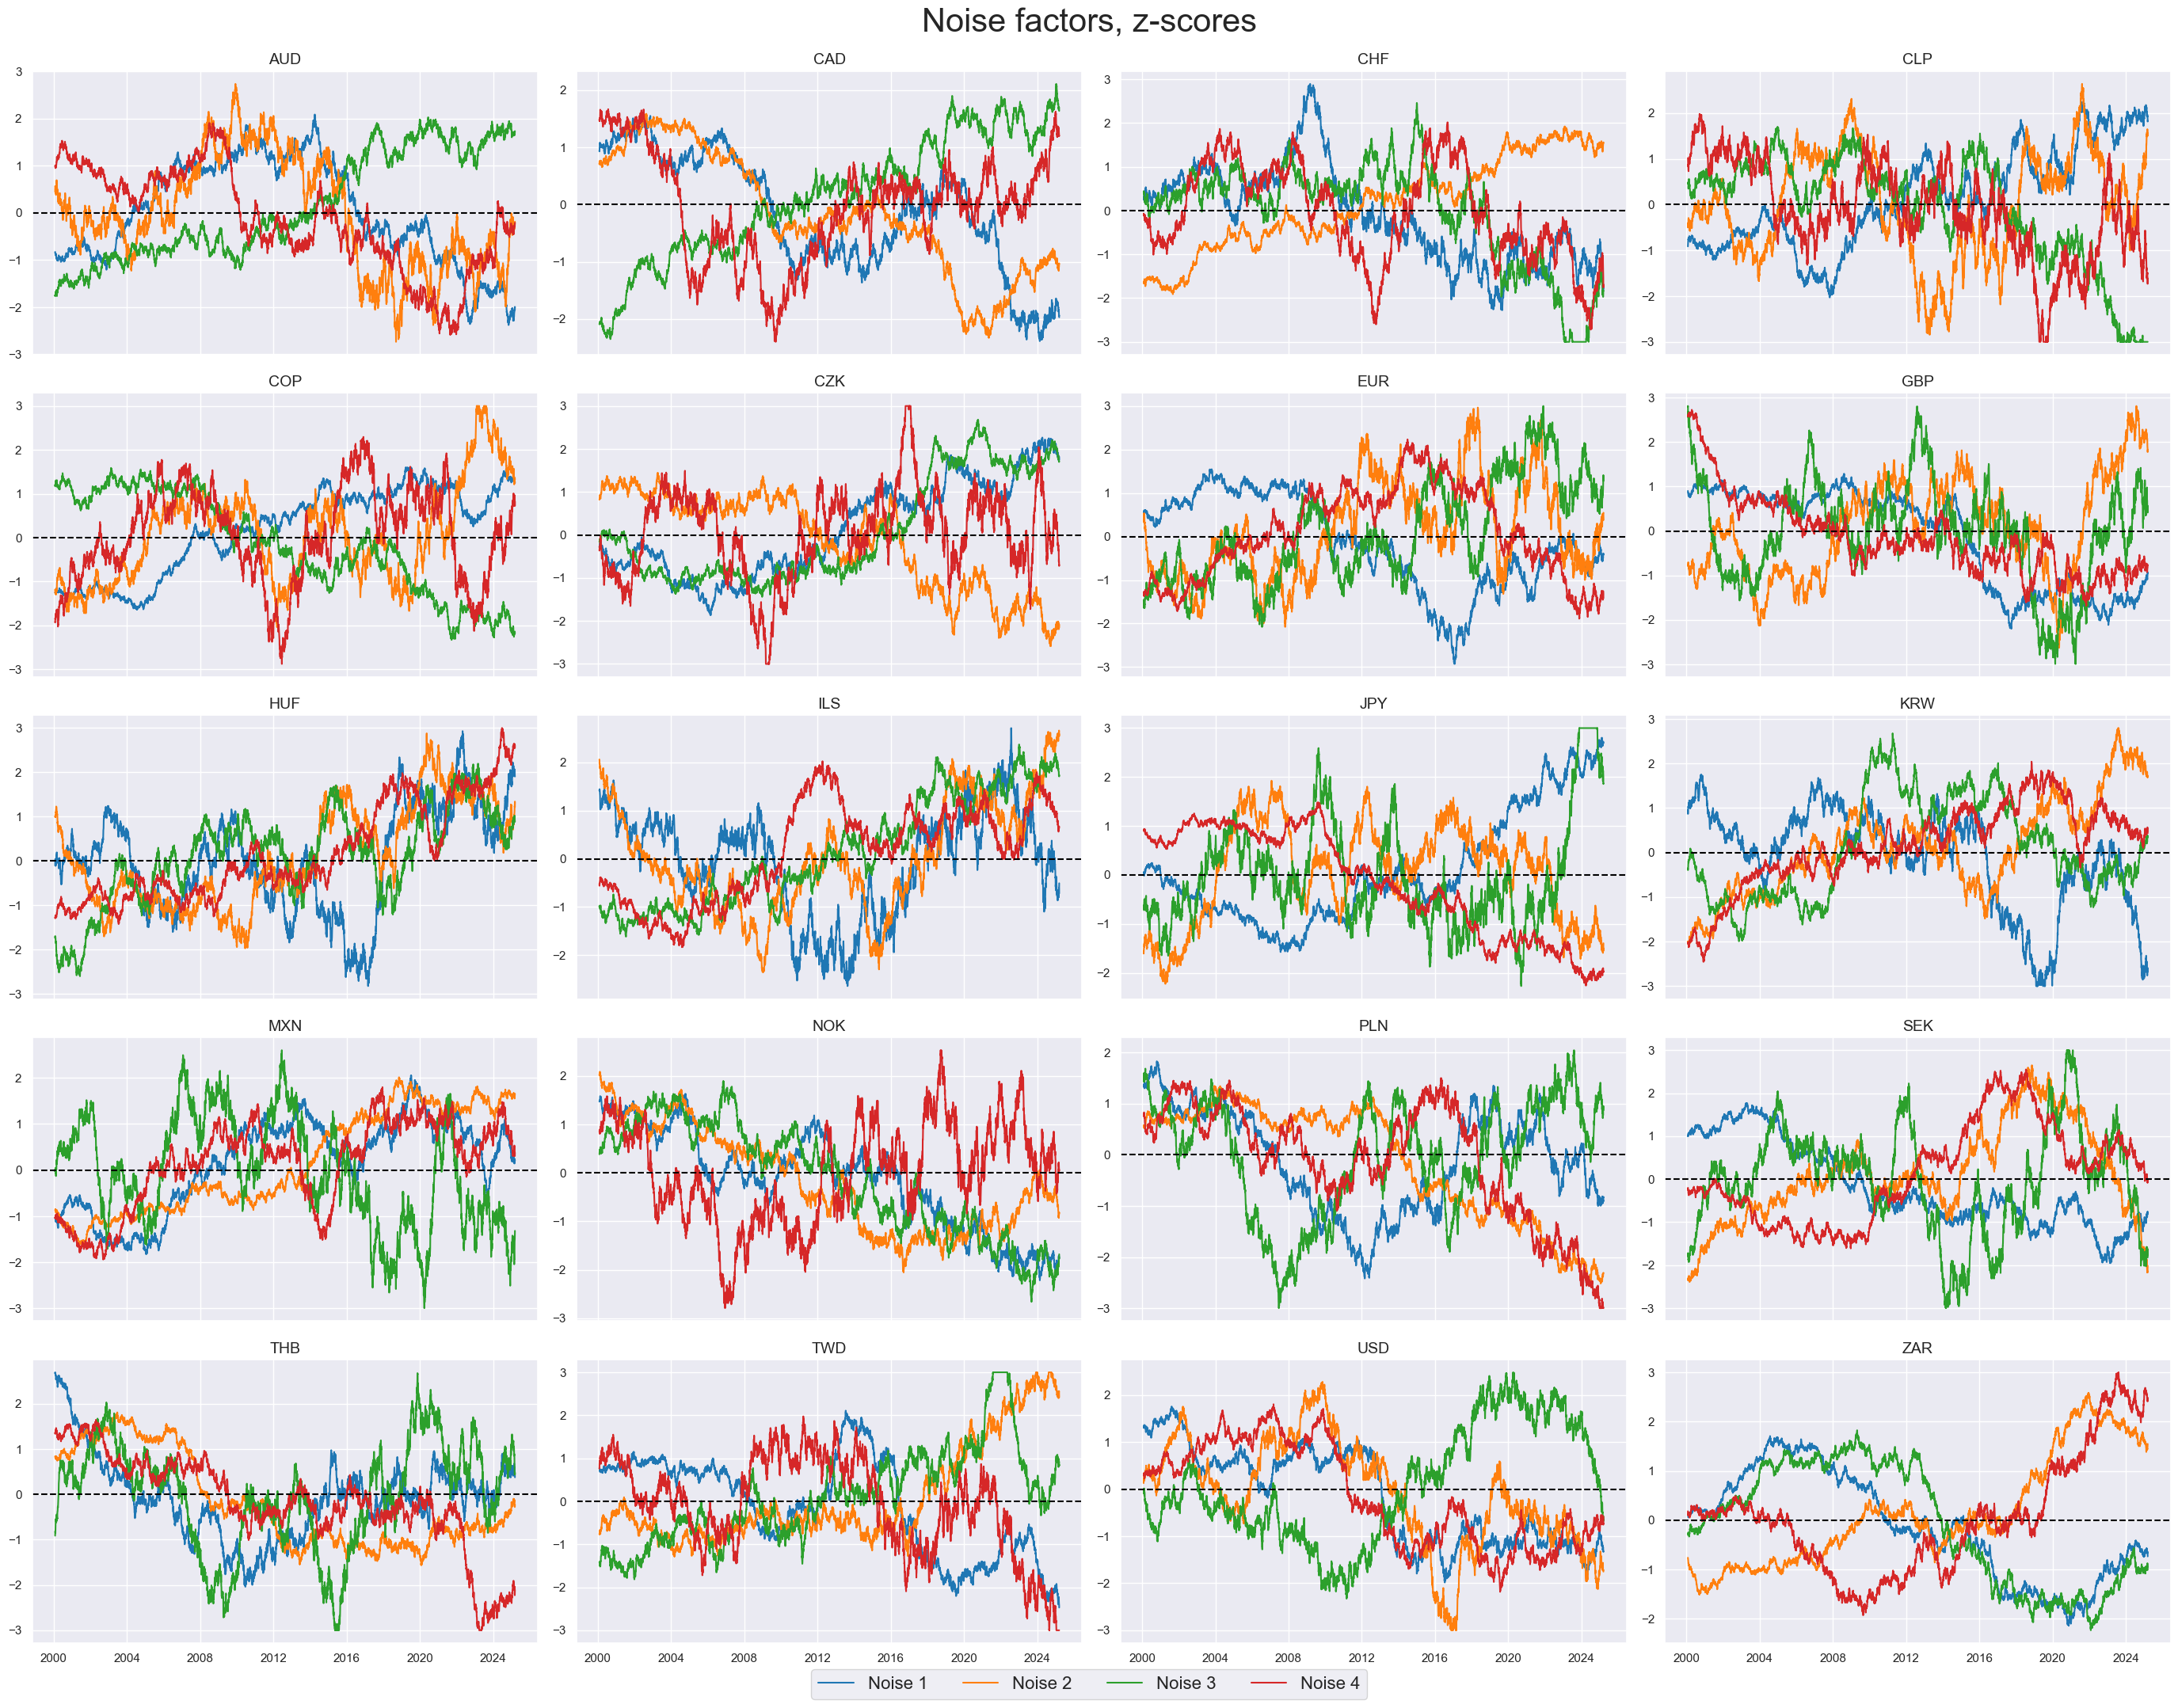
Add noise features
xcatx = ["NOISE1", "NOISE2", "NOISE3", "NOISE4"]

df_cids = pd.DataFrame(index=cids, columns=['earliest', 'latest', 'mean_add','sd_mult'])

for cid in cids:
    df_cids.loc[cid] = [start_date, pd.Timestamp.today().date(), 0, 1]

df_xcats = pd.DataFrame(
    index=xcatx,
    columns=['earliest', 'latest', 'mean_add','sd_mult', 'ar_coef', 'back_coef'],
)

for xcat in xcatx:
    df_xcats.loc[xcat] = [start_date, pd.Timestamp.today().date(), 0, 1, 1, 0]

dfa = msm.make_qdf(df_cids, df_xcats)
dfx = msm.update_df(dfx, dfa)
Individual and average z-scores #
macros = [
    "XGDP_NEG",
    "XCPI_NEG",
    "XPCG_NEG",
    "XRYLDIRS05Y_NSA",
    "NOISE1",
    "NOISE2",
    "NOISE3",
    "NOISE4",
]
xcatx = macros

for xc in xcatx:
    dfa = msp.make_zn_scores(
        dfx,
        xcat=xc,
        cids=cids,
        neutral="zero",
        thresh=3,
        est_freq="M",
        pan_weight=1,
        postfix="_ZN",
    )
    dfx = msm.update_df(dfx, dfa)

dfa = msp.linear_composite(
    df=dfx,
    xcats=[xc + "_ZN" for xc in xcatx],
    cids=cids,
    new_xcat="MACRO_AVGZ",
)

dfx = msm.update_df(dfx, dfa)
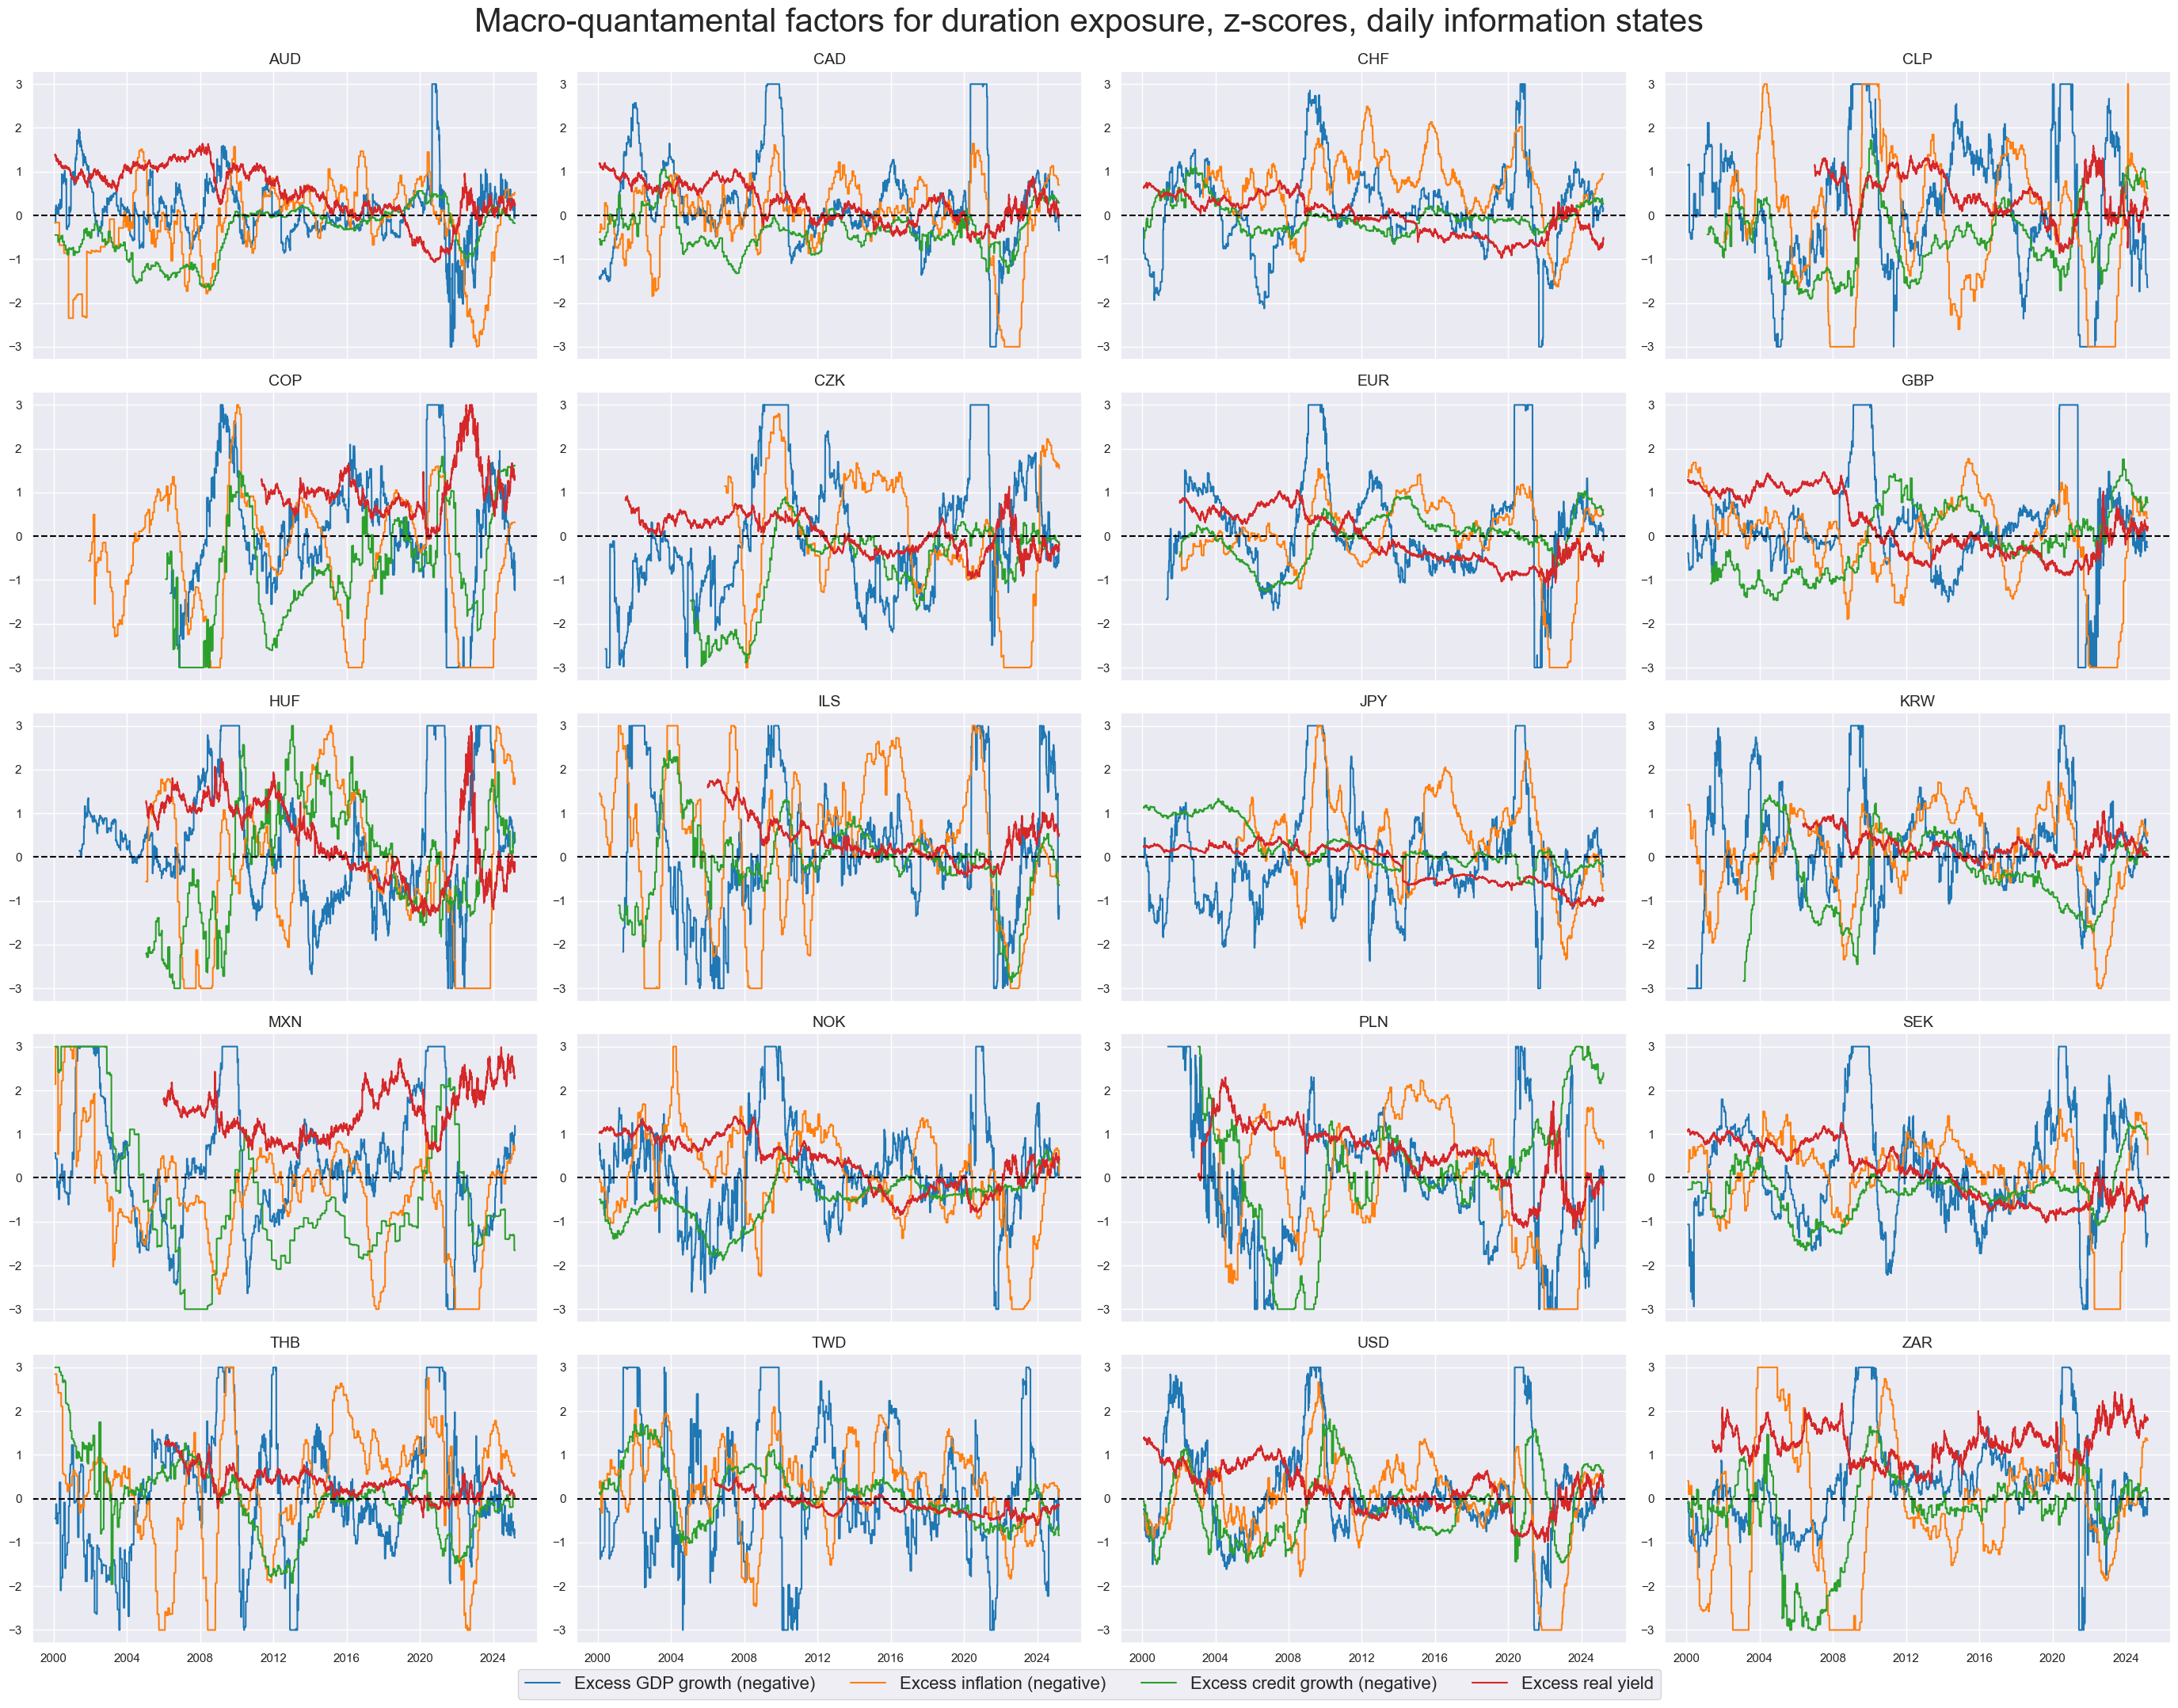
macroz = [m + "_ZN" for m in macros]
xcatx = macroz[:-4]

msp.view_timelines(
    dfx,
    xcats=xcatx,
    cids=cids_dux,
    ncol=4,
    start="2000-01-01",
    title="Macro-quantamental factors for duration exposure, z-scores, daily information states",
    title_fontsize=30,
    same_y=False,
    cs_mean=False,
    xcat_labels=[
        "Excess GDP growth (negative)",
        "Excess inflation (negative)",
        "Excess credit growth (negative)",
        "Excess real yield",
    ],
    legend_fontsize=16,
)
xcatx = macroz[-4:]

msp.view_timelines(
    dfx,
    xcats=xcatx,
    cids=cids_dux,
    ncol=4,
    start="2000-01-01",
    title="Noise factors, z-scores",
    title_fontsize=30,
    same_y=False,
    cs_mean=False,
    xcat_labels=["Noise 1", "Noise 2", "Noise 3", "Noise 4"],
    legend_fontsize=16,
)
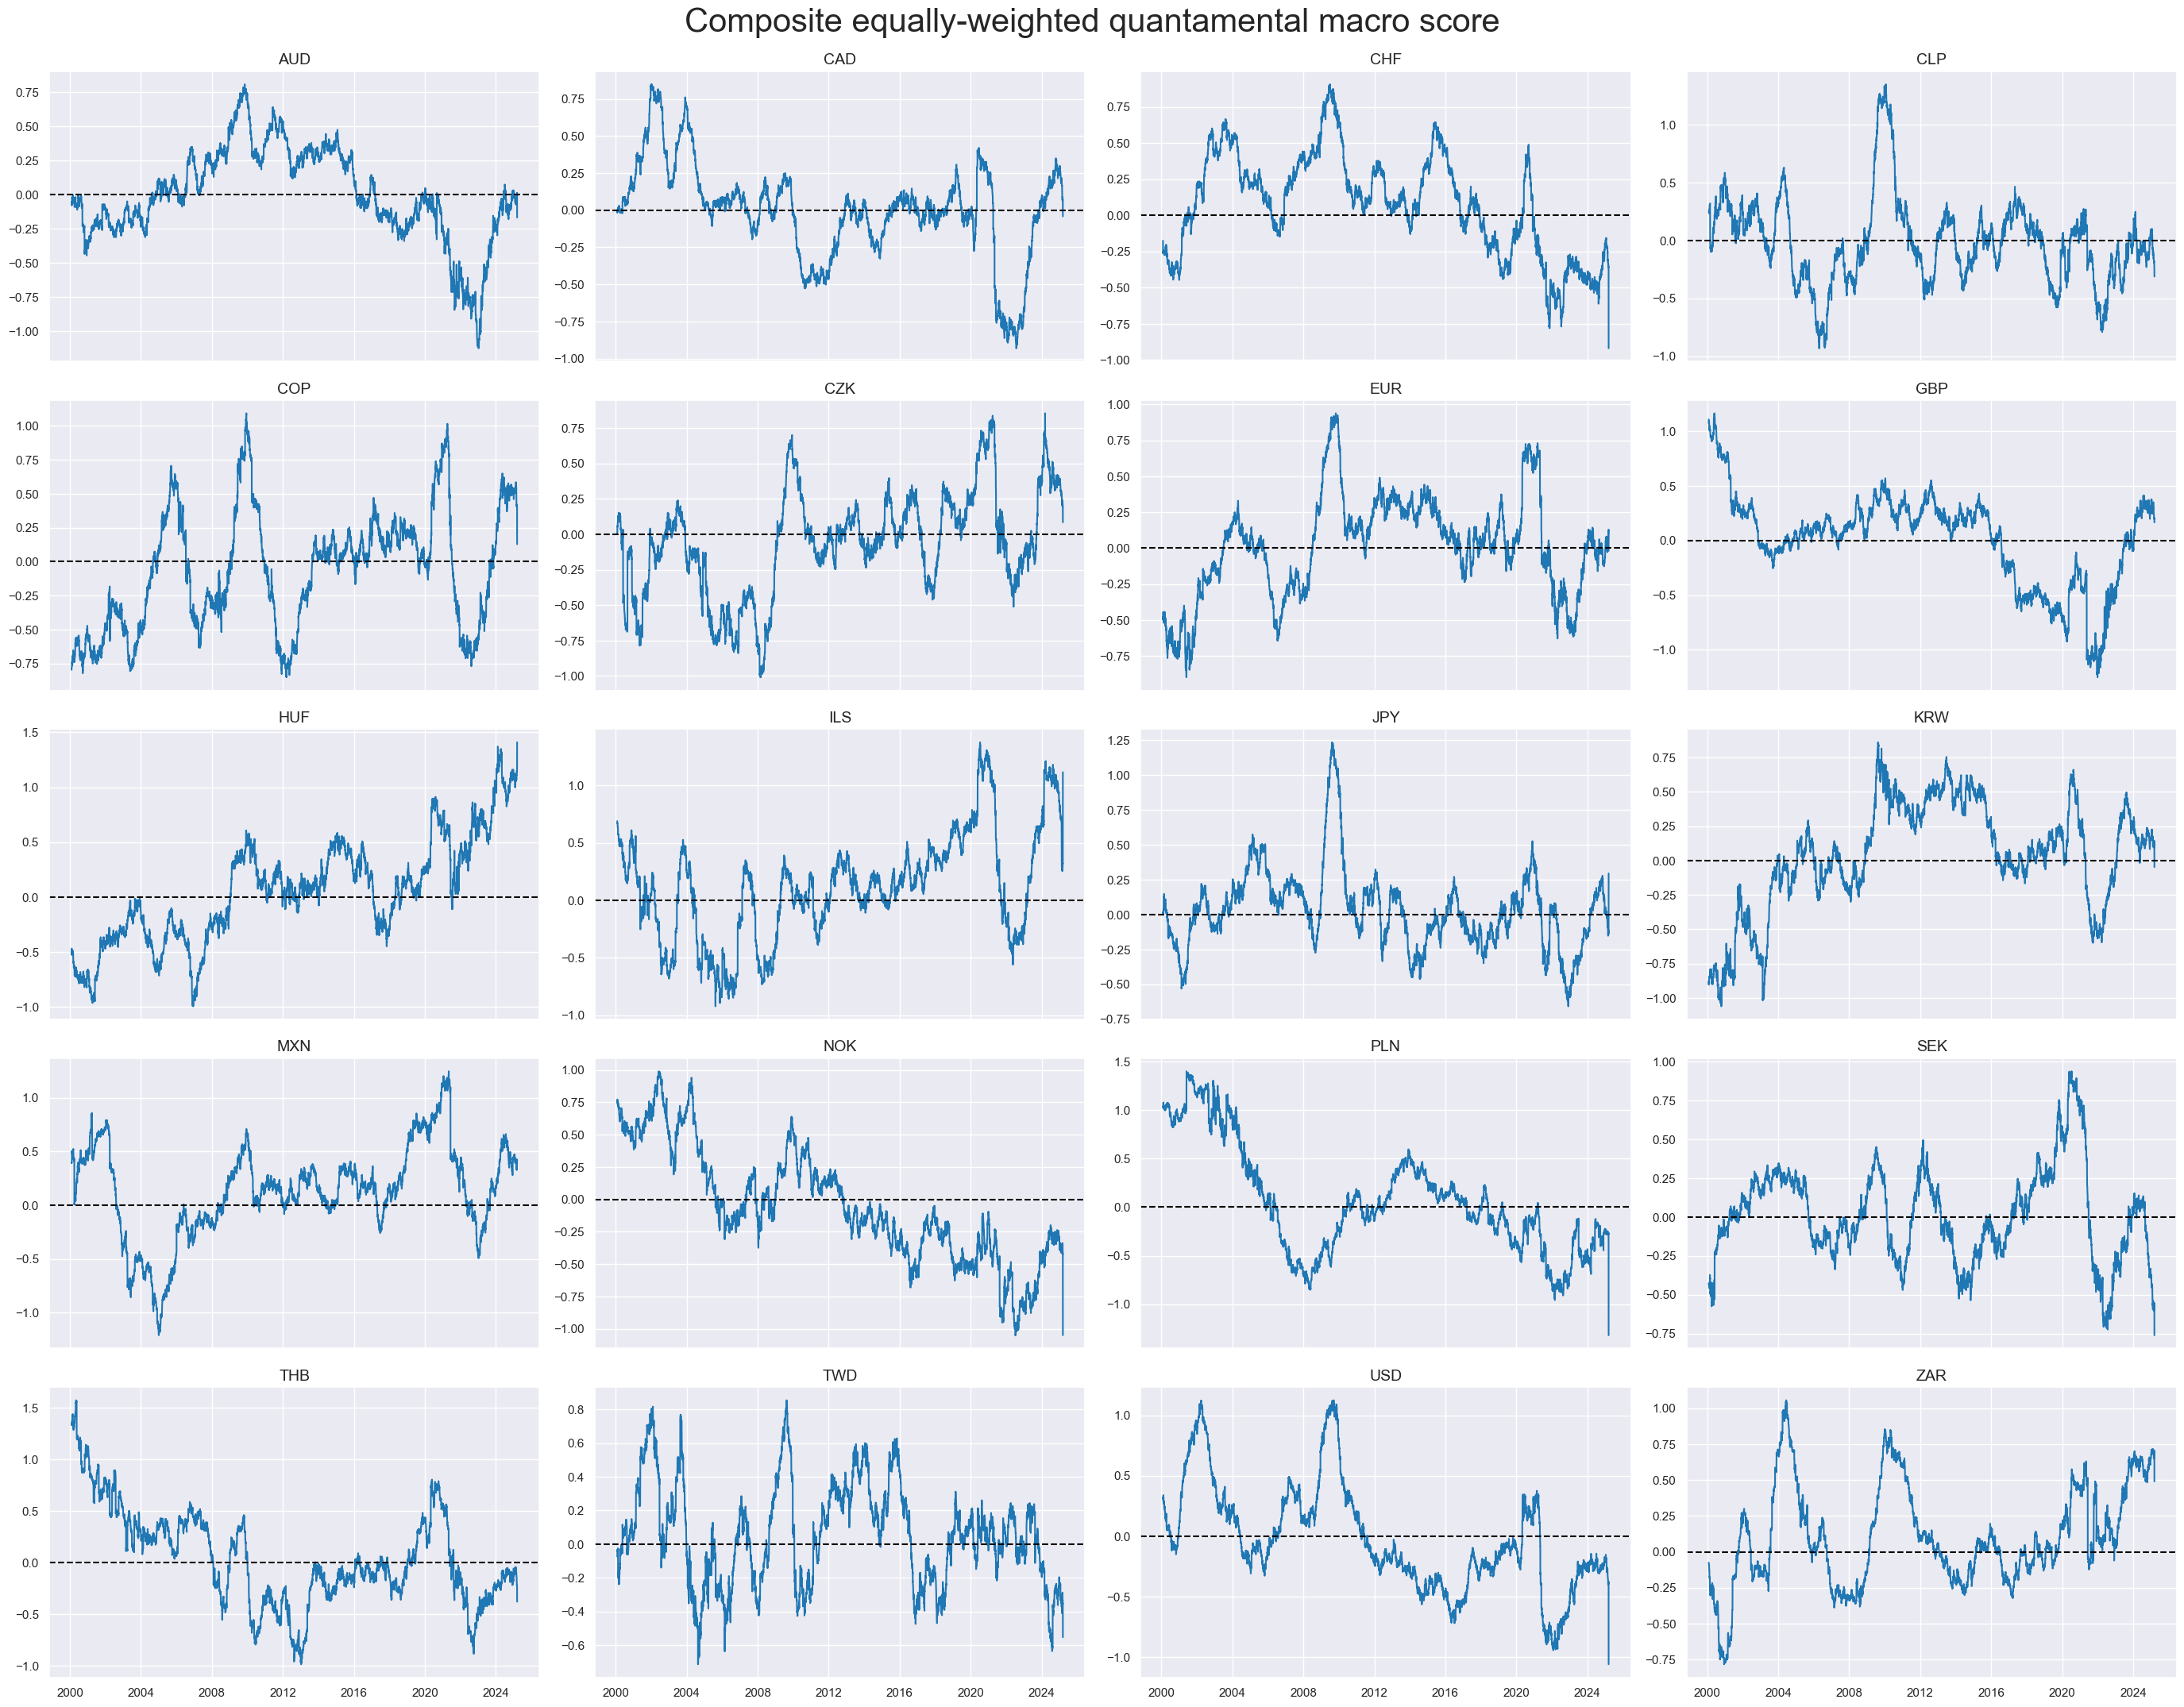
xcatx = ["MACRO_AVGZ"]

msp.view_timelines(
    dfx,
    xcats=xcatx,
    cids=sorted(cids_dux),
    ncol=4,
    start="2000-01-01",
    title="Composite equally-weighted quantamental macro score",
    title_fontsize=30,
    same_y=False,
    cs_mean=False,
    xcat_labels=None,
)
Features and targets for scikit-learn (defunct) #
# Specify features and target category
xcatx = macroz + ["DU05YXR_VT10"]

# Downsample from daily to monthly frequency (features as last and target as sum)
dfw = msm.categories_df(
    df=dfx,
    xcats=xcatx,
    cids=cids_dux,
    freq="M",
    lag=1,
    blacklist=fxblack,
    xcat_aggs=["last", "sum"],
)

# Drop rows with missing values and assign features and target
dfw.dropna(inplace=True)
X = dfw.iloc[:, :-1]
y = dfw.iloc[:, -1]
Cross-validation #
Types of cross-validation #
split_xi = msl.ExpandingIncrementPanelSplit(
    train_intervals=12, min_periods=36, test_size=12
)
split_xi.visualise_splits(X, y)
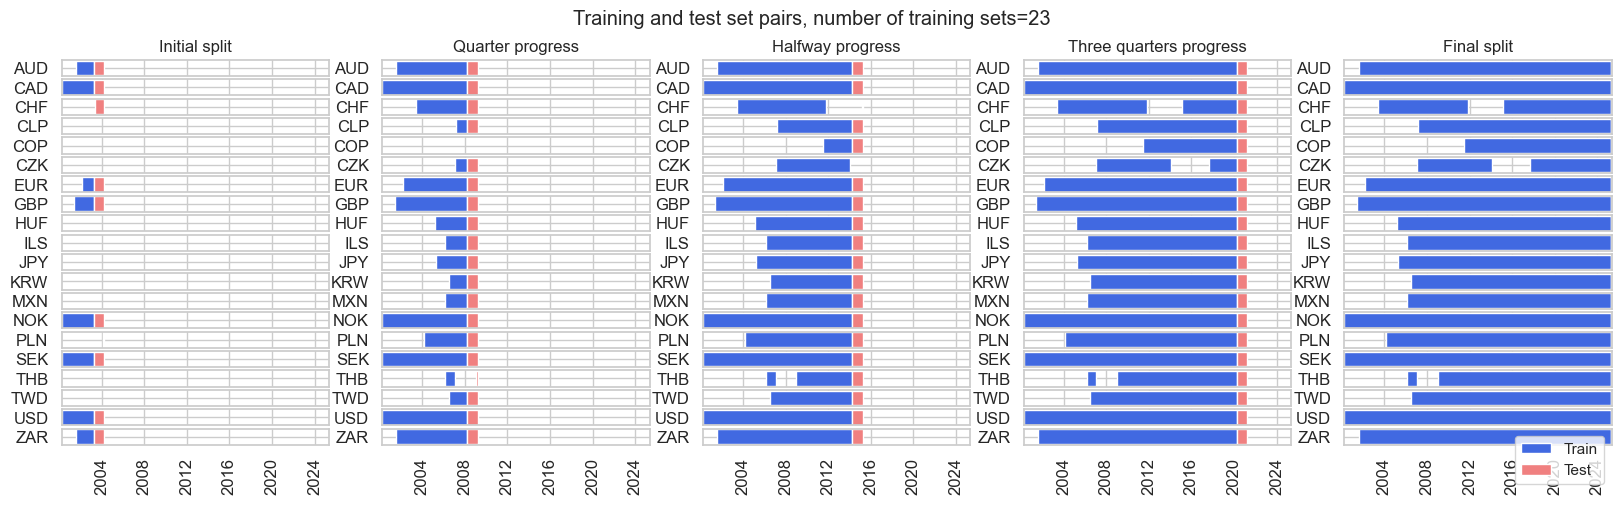
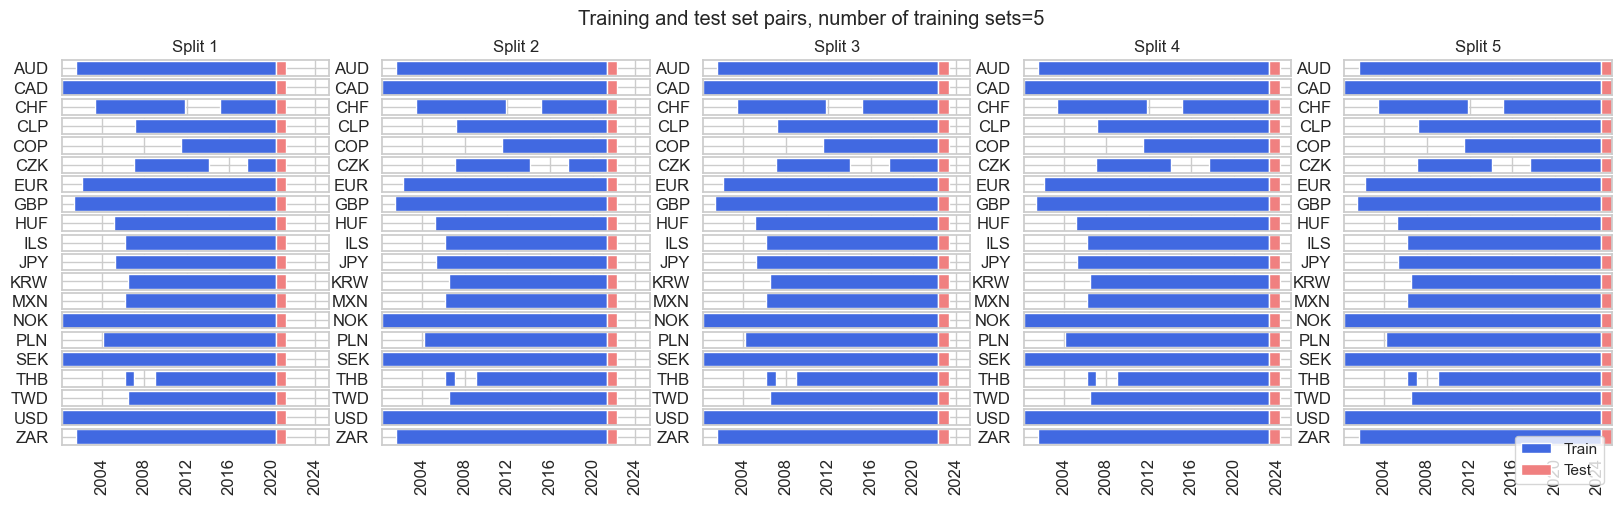
Generally, we will use one of the three below splitters as cross-validation splitters in our research.
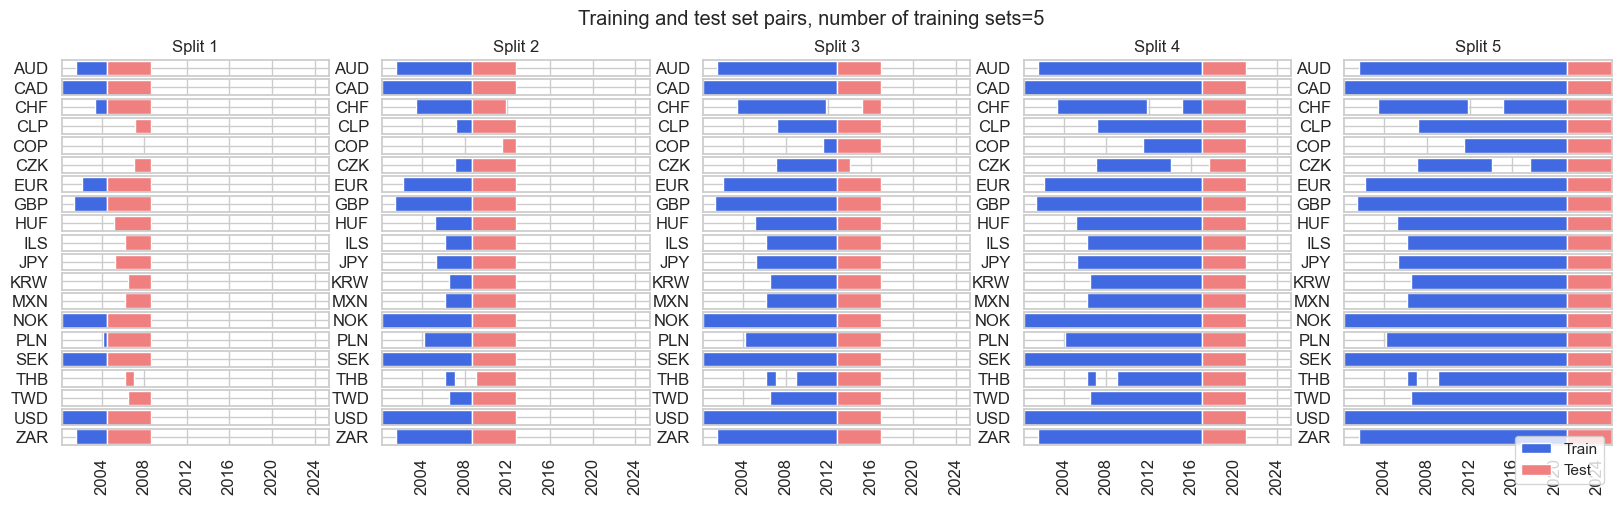
split_xkf = msl.ExpandingKFoldPanelSplit(n_splits=5)
split_xkf.visualise_splits(X, y)
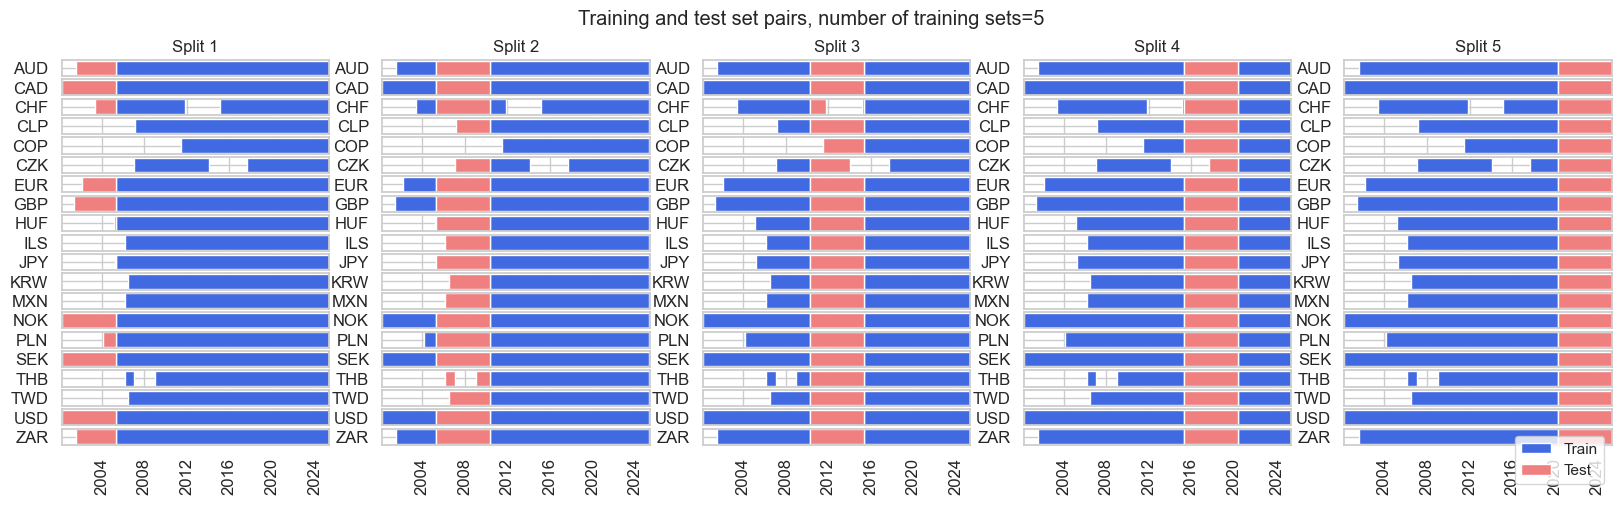
split_rkf = msl.RollingKFoldPanelSplit(n_splits=5)
split_rkf.visualise_splits(X, y)
split_rec = msl.RecencyKFoldPanelSplit(n_splits=5, n_periods=12)
split_rec.visualise_splits(X, y)
Signal generation #
min_cids = 4
min_periods = 36
cv_summary = "median"

splitter = {"Rolling": msl.RollingKFoldPanelSplit(5)}

scorer_fs = {"MAP": make_scorer(msl.panel_significance_probability)}
scorer_reg = {"SHARPE": make_scorer(msl.sharpe_ratio)}
scorer_cls = {"BAC": make_scorer(balanced_accuracy_score)}

test_size_rf = 3  # Random forest pipelines
test_size_fs = 1  # Feature selection pipeline

ftrs_renamed = {
    "XGDP_NEG_ZN": "Excess GDP growth (negative)",
    "XCPI_NEG_ZN": "Excess inflation (negative)",
    "XRYLDIRS05Y_NSA_ZN": "Excess real yield",
    "XPCG_NEG_ZN": "Excess credit growth (negative)",
    "NOISE1_ZN": "Noise factor 1",
    "NOISE2_ZN": "Noise factor 2",
    "NOISE3_ZN": "Noise factor 3",
    "NOISE4_ZN": "Noise factor 4",
}
Feature selection #
Model pipeline #
mods_fsz = {
    "LASSO_Z": Pipeline(
        [
            ("selector", msl.LassoSelector(positive=True)),
            ("predictor", msl.NaiveRegressor()),
        ]
    ),
    "MAP_Z": Pipeline(
        [
            ("selector", msl.MapSelector()),
            ("predictor", msl.NaiveRegressor()),
        ]
    ),
}

grids_fsz = {
    "LASSO_Z": {
        "selector__n_factors": [1, 2, 4, 8],
    },

    "MAP_Z": {
        "selector__n_factors": [1, 2, 4, 8],
    },
}
Backtest #
xcatx = macroz + ["DU05YXR_VT10"]
cidx = cids_dux

so_fsz = msl.SignalOptimizer(
    df = dfx,
    xcats = xcatx,
    cids = cidx,
    blacklist = fxblack,
    freq = "M",
    lag = 1,
    xcat_aggs = ["last", "sum"]
)

so_fsz.calculate_predictions(
    name = "MACRO_OPTSELZ",
    models = mods_fsz,
    hyperparameters = grids_fsz,
    scorers = scorer_fs,
    inner_splitters = splitter,
    min_cids = min_cids,
    min_periods = min_periods,
    cv_summary=cv_summary,
    n_jobs_outer = -1,
)

# Store optimized signals
dfa = so_fsz.get_optimized_signals()
dfx = msm.update_df(dfx, dfa)
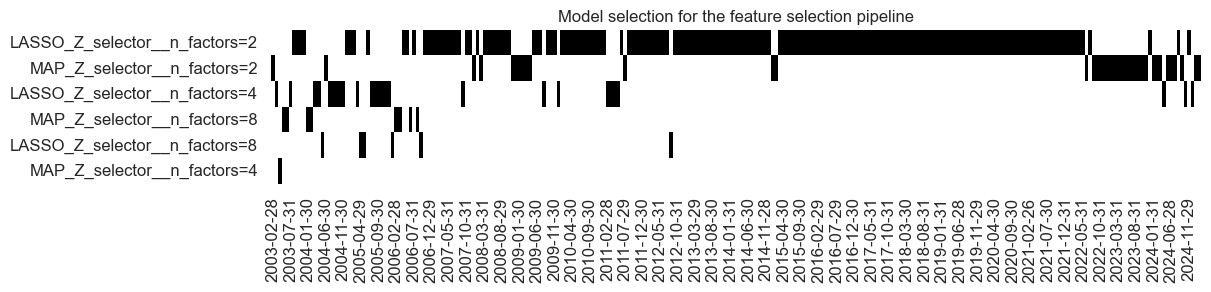
so_fsz.models_heatmap(
    name="MACRO_OPTSELZ",
    cap=6,
    title="Model selection for the feature selection pipeline",
    figsize=(12, 2),
)
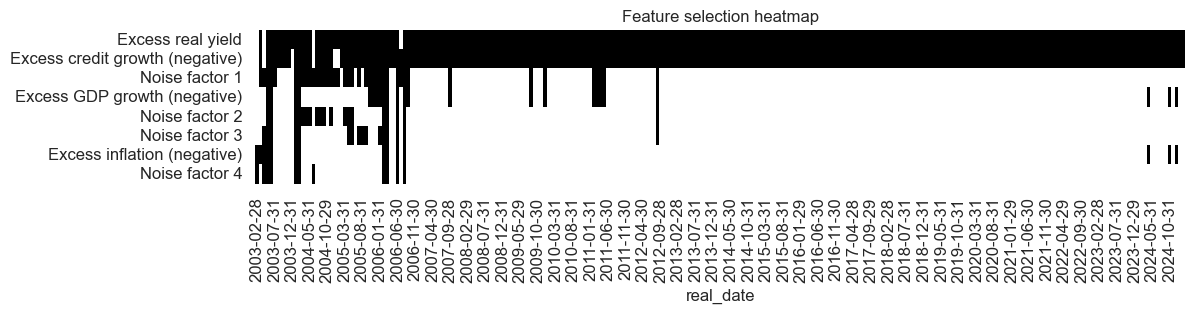
so_fsz.feature_selection_heatmap(
    name="MACRO_OPTSELZ",
    ftrs_renamed={
        "XGDP_NEG_ZN": "Excess GDP growth (negative)",
        "XCPI_NEG_ZN": "Excess inflation (negative)",
        "XRYLDIRS05Y_NSA_ZN": "Excess real yield",
        "XPCG_NEG_ZN": "Excess credit growth (negative)",
        "NOISE1_ZN": "Noise factor 1",
        "NOISE2_ZN": "Noise factor 2",
        "NOISE3_ZN": "Noise factor 3",
        "NOISE4_ZN": "Noise factor 4",
    },
    title = "Feature selection heatmap",
    figsize=(12, 2),
)
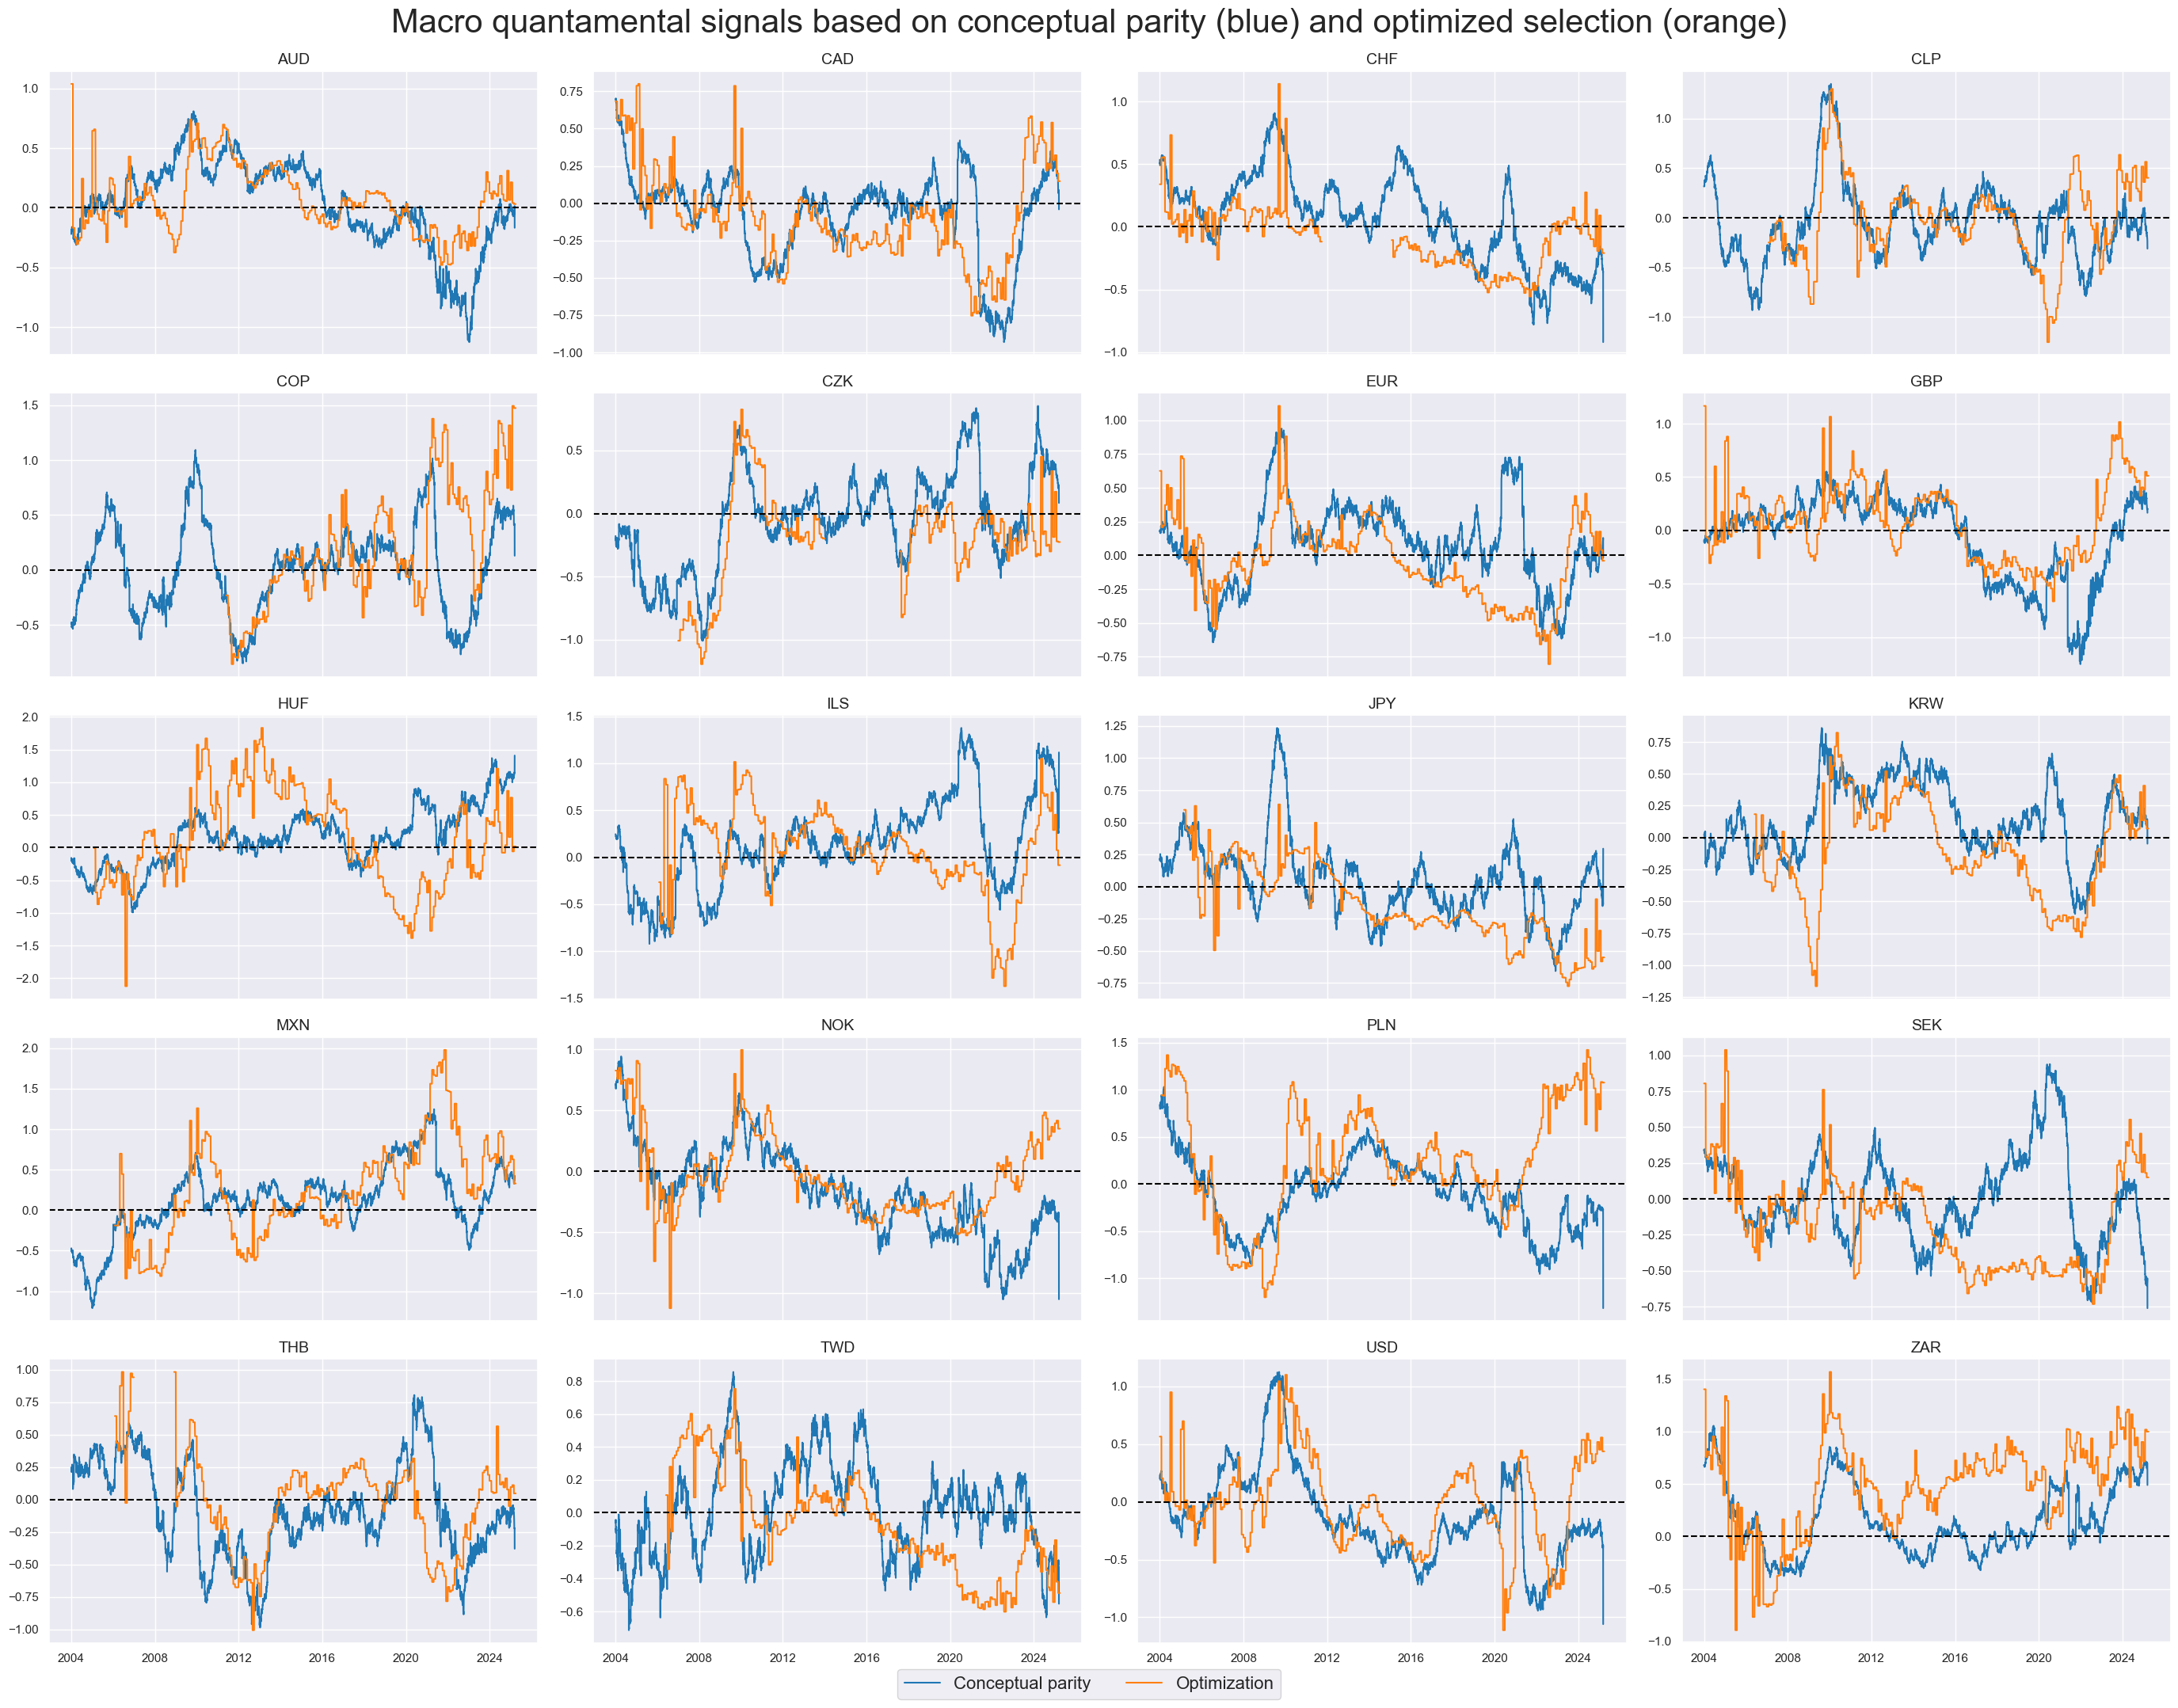
xcatx = ["MACRO_AVGZ", "MACRO_OPTSELZ"]

msp.view_timelines(
    dfx,
    xcats=xcatx,
    cids=cids_dux,
    ncol=4,
    start="2004-01-01",
    title="Macro quantamental signals based on conceptual parity (blue) and optimized selection (orange)",
    title_fontsize=30,
    same_y=False,
    cs_mean=False,
    xcat_labels=["Conceptual parity", "Optimization"],
    legend_fontsize=16,
)
Value checks #
## Compare optimized signals with simple average z-scores

srr = mss.SignalReturnRelations(
    df=dfx,
    rets=["DU05YXR_VT10"],
    sigs=["MACRO_AVGZ", "MACRO_OPTSELZ"],
    cosp=True,
    freqs=["M"],
    agg_sigs=["last"],
    start="2004-01-01",
    blacklist=fxblack,
    slip=1,
)

tbl_srr = srr.multiple_relations_table()
display(tbl_srr.astype("float").round(3))
| accuracy | bal_accuracy | pos_sigr | pos_retr | pos_prec | neg_prec | pearson | pearson_pval | kendall | kendall_pval | auc | ||||
|---|---|---|---|---|---|---|---|---|---|---|---|---|---|---|
| Return | Signal | Frequency | Aggregation | |||||||||||
| DU05YXR_VT10 | MACRO_AVGZ | M | last | 0.522 | 0.519 | 0.543 | 0.537 | 0.555 | 0.484 | 0.055 | 0.0 | 0.043 | 0.0 | 0.519 |
| MACRO_OPTSELZ | M | last | 0.546 | 0.547 | 0.491 | 0.537 | 0.585 | 0.509 | 0.105 | 0.0 | 0.075 | 0.0 | 0.547 |
sigs = ["MACRO_AVGZ", "MACRO_OPTSELZ"]


pnl = msn.NaivePnL(
    df=dfx,
    ret="DU05YXR_VT10",
    sigs=sigs,
    cids=cids_dux,
    start="2003-02-28",
    blacklist=fxblack,
    bms="USD_DU05YXR_NSA",
)
for sig in sigs:
    pnl.make_pnl(
        sig=sig,
        sig_op="zn_score_pan",
        rebal_freq="monthly",
        neutral="zero",
        rebal_slip=1,
        vol_scale=10,
        thresh=3,
    )


pnl.plot_pnls(
    title="Naive PnLs based on conceptual parity and optimized selection of signals",
    title_fontsize=14,
    xcat_labels=["Conceptual parity signal", "Optimized signal"],
)
pcats = ["PNL_" + sig for sig in sigs]
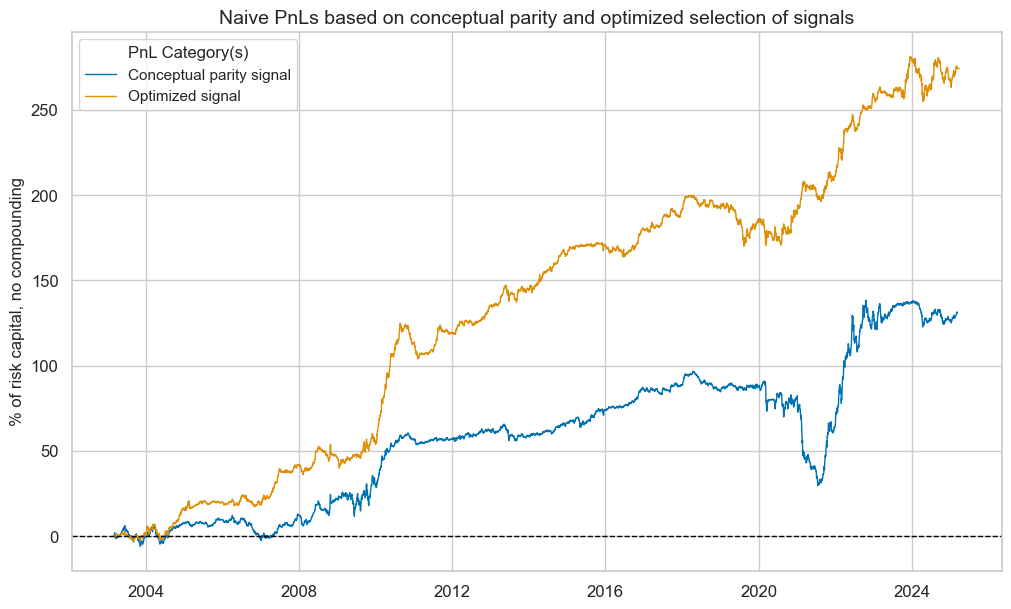
pnl.evaluate_pnls(pnl_cats=pcats)
| xcat | PNL_MACRO_AVGZ | PNL_MACRO_OPTSELZ |
|---|---|---|
| Return % | 5.943058 | 12.419651 |
| St. Dev. % | 10.0 | 10.0 |
| Sharpe Ratio | 0.594306 | 1.241965 |
| Sortino Ratio | 0.834452 | 1.901599 |
| Max 21-Day Draw % | -29.98348 | -14.718057 |
| Max 6-Month Draw % | -47.296221 | -23.686195 |
| Peak to Trough Draw % | -67.061088 | -29.928663 |
| Top 5% Monthly PnL Share | 1.177661 | 0.52426 |
| USD_DU05YXR_NSA correl | -0.026551 | 0.041908 |
| Traded Months | 266 | 266 |
Regression forecasts #
Model pipeline #
from sklearn.base import BaseEstimator, MetaEstimatorMixin, RegressorMixin

class FIExtractor(BaseEstimator, MetaEstimatorMixin, RegressorMixin):
    def __init__(self, estimator):
        self.estimator = estimator

    def fit(self, X, y):
        self.estimator.fit(X, y)

        if hasattr(self.estimator, "coef_"):
            self.feature_importances_ = np.abs(self.estimator.coef_) / np.sum(np.abs(self.estimator.coef_))
        elif hasattr(self.estimator, "feature_importances_"):
            self.feature_importances_ = self.estimator.feature_importances_ / np.sum(self.estimator.feature_importances_)

        return self

    def predict(self, X):
        return self.estimator.predict(X)

    def __getattr__(self, attr):
        """
        Get attributes from the underlying model.
        """
        if hasattr(self.estimator, attr):
            return getattr(self.estimator, attr)

        raise AttributeError(f"'{type(self).__name__}' object has no attribute '{attr}'")
mods_reg = {
    "linreg": FIExtractor(LinearRegression(positive=True)),
    "rf": FIExtractor(
            RandomForestRegressor(
                max_features = 0.3,
                min_samples_leaf = 5,
                n_estimators = 500,
                monotonic_cst = [1,1,1,1,1,1,1,1],
                random_state = 42
            )
    )
}

grids_reg = {
    "linreg": {"estimator__fit_intercept": [True, False]},
    "rf": {"estimator__max_samples": [0.1, 0.5]},
}
Backtest #
xcatx = macroz + ["DU05YXR_VT10"]
cidx = cids_dux

so_reg = msl.SignalOptimizer(
    df=dfx,
    xcats=xcatx,
    cids=cidx,
    blacklist=fxblack,
    freq="M",
    lag=1,
    xcat_aggs=["last", "sum"],
)

so_reg.calculate_predictions(
    name="MACRO_OPTREG",
    models=mods_reg,
    hyperparameters=grids_reg,
    scorers=scorer_reg,
    inner_splitters=splitter,
    search_type="grid",
    normalize_fold_results=False,
    cv_summary=cv_summary,
    min_cids=min_cids,
    min_periods=min_periods,
    test_size=test_size_rf,
    n_jobs_outer=-1,
)

dfa = so_reg.get_optimized_signals()
dfx = msm.update_df(dfx, dfa)
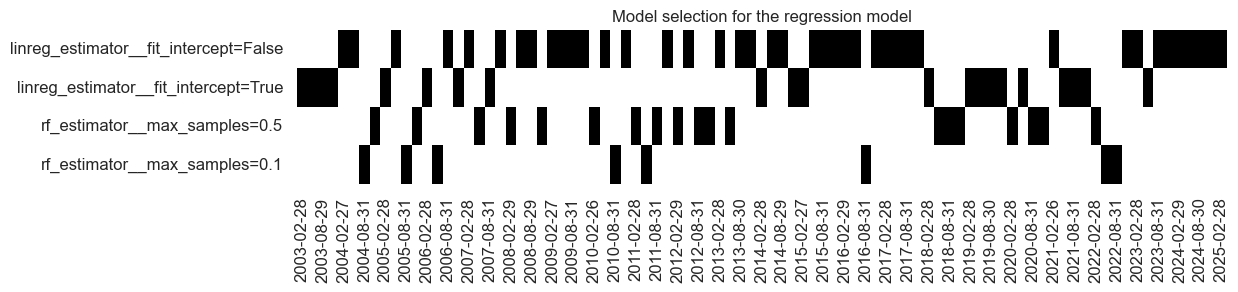
so_reg.models_heatmap(
    name="MACRO_OPTREG",
    cap=6,
    title="Model selection for the regression model",
    figsize=(12, 2),
)
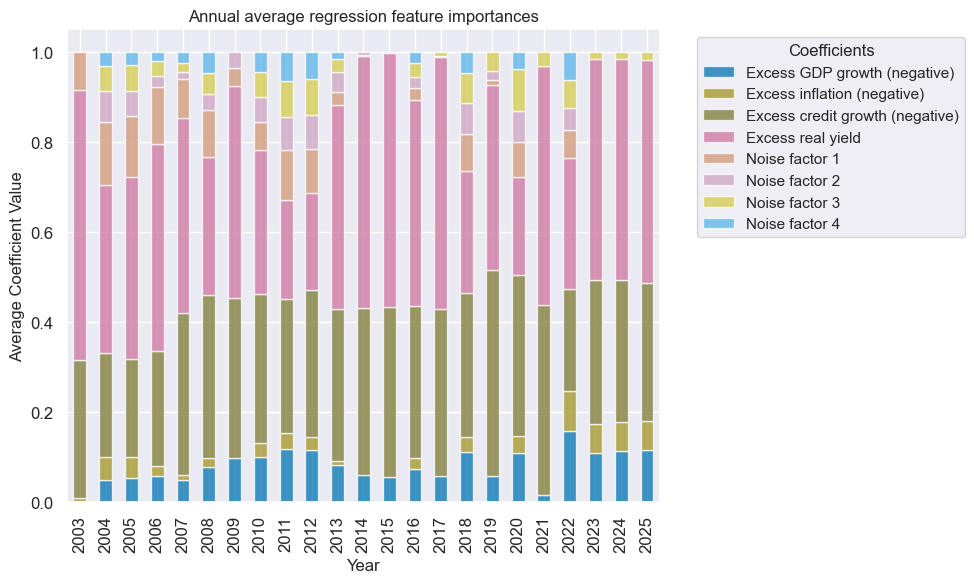
so_reg.coefs_stackedbarplot(name="MACRO_OPTREG", ftrs_renamed=ftrs_renamed, title="Annual average regression feature importances")
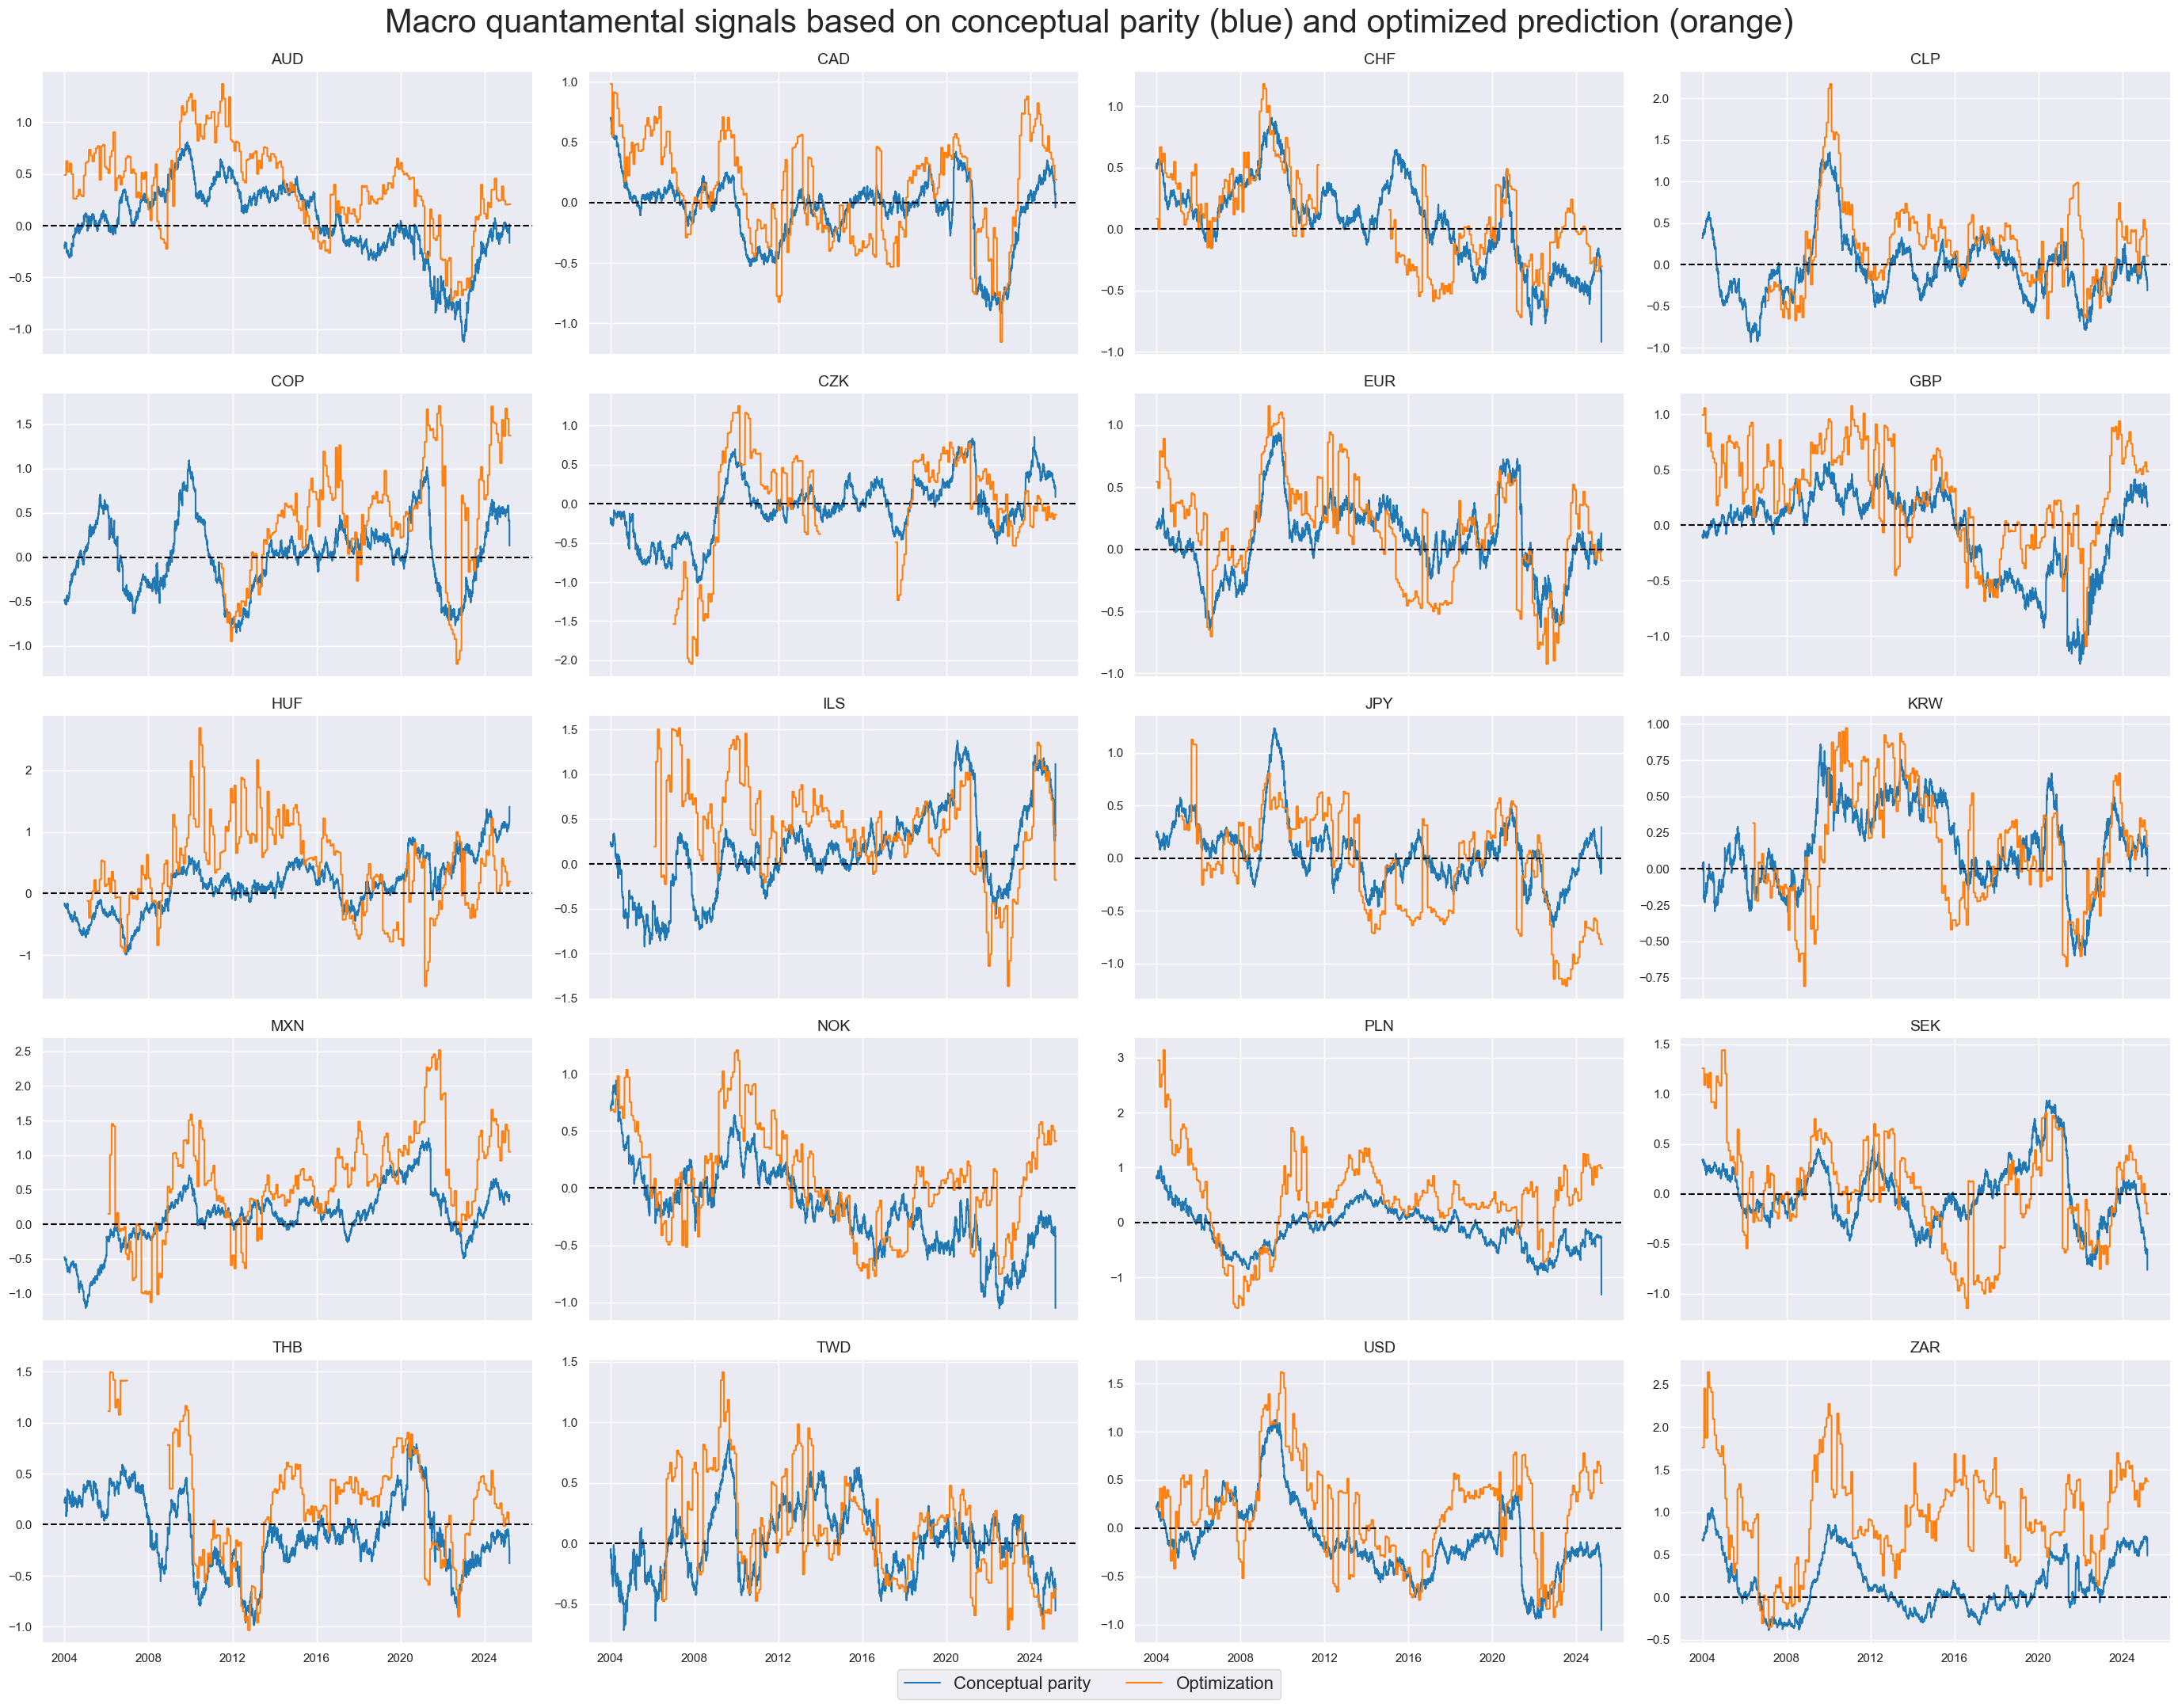
xcatx = ["MACRO_AVGZ", "MACRO_OPTREG"]

msp.view_timelines(
    dfx,
    xcats=xcatx,
    cids=cids_dux,
    ncol=4,
    start="2004-01-01",
    title="Macro quantamental signals based on conceptual parity (blue) and optimized prediction (orange)",
    title_fontsize=30,
    same_y=False,
    cs_mean=False,
    xcat_labels=["Conceptual parity", "Optimization"],
    legend_fontsize=16,
)
Value checks #
srr = mss.SignalReturnRelations(
    df=dfx,
    rets=["DU05YXR_VT10"],
    sigs=["MACRO_AVGZ", "MACRO_OPTREG"],
    cosp=True,
    freqs=["M"],
    agg_sigs=["last"],
    start="2004-01-01",
    blacklist=fxblack,
    slip=1,
)

tbl_srr = srr.signals_table()
display(tbl_srr.astype("float").round(3))
| accuracy | bal_accuracy | pos_sigr | pos_retr | pos_prec | neg_prec | pearson | pearson_pval | kendall | kendall_pval | auc | ||||
|---|---|---|---|---|---|---|---|---|---|---|---|---|---|---|
| Return | Signal | Frequency | Aggregation | |||||||||||
| DU05YXR_VT10 | MACRO_AVGZ | M | last | 0.522 | 0.519 | 0.543 | 0.537 | 0.555 | 0.484 | 0.055 | 0.0 | 0.043 | 0.0 | 0.519 |
| MACRO_OPTREG | M | last | 0.541 | 0.531 | 0.679 | 0.537 | 0.557 | 0.505 | 0.079 | 0.0 | 0.052 | 0.0 | 0.527 |
sigs = ["MACRO_AVGZ", "MACRO_OPTREG"]


pnl = msn.NaivePnL(
    df=dfx,
    ret="DU05YXR_VT10",
    sigs=sigs,
    cids=cids_dux,
    start="2004-01-01",
    blacklist=fxblack,
)
for sig in sigs:
    pnl.make_pnl(
        sig=sig,
        sig_op="zn_score_pan",
        rebal_freq="monthly",
        neutral="zero",
        rebal_slip=1,
        vol_scale=10,
        thresh=3,
    )

pnl.plot_pnls(
    title="Naive PnLs based on conceptual parity and optimized regression-based signals",
    title_fontsize=14,
    xcat_labels=["Conceptual parity signal", "Optimized signal"],
)
pcats = ["PNL_" + sig for sig in sigs]
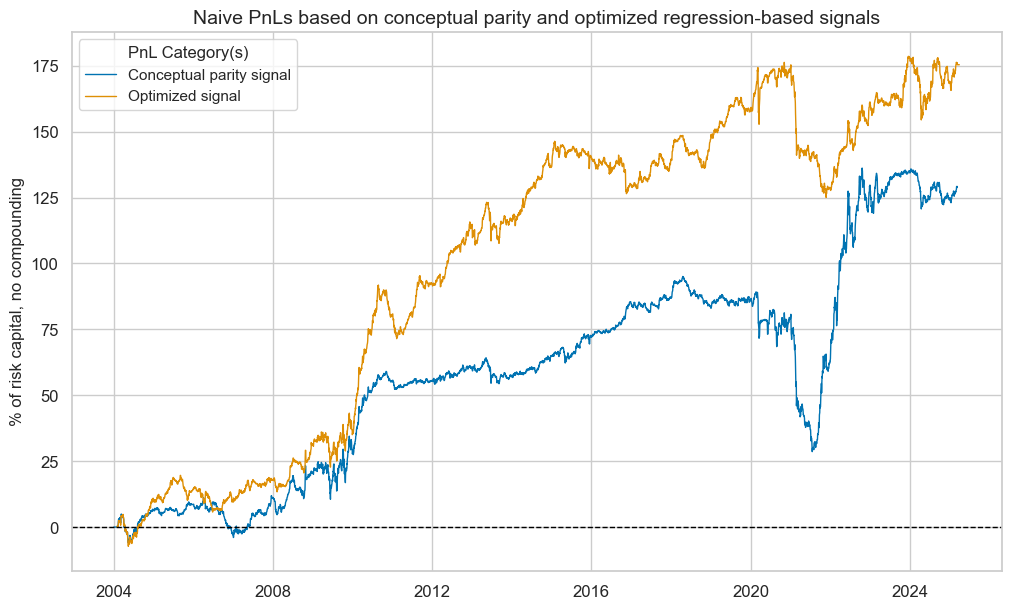
pnl.evaluate_pnls(pnl_cats=pcats)
| xcat | PNL_MACRO_AVGZ | PNL_MACRO_OPTREG |
|---|---|---|
| Return % | 6.077937 | 8.288867 |
| St. Dev. % | 10.0 | 10.0 |
| Sharpe Ratio | 0.607794 | 0.828887 |
| Sortino Ratio | 0.853234 | 1.152382 |
| Max 21-Day Draw % | -29.652877 | -30.006276 |
| Max 6-Month Draw % | -46.772495 | -35.121596 |
| Peak to Trough Draw % | -66.432023 | -51.240223 |
| Top 5% Monthly PnL Share | 1.135295 | 0.628028 |
| Traded Months | 255 | 255 |
Classification #
ys = np.sign(y)
calcs = ["MACRO_AVGZ_SIGN = np.sign( MACRO_AVGZ )"]
dfa = msp.panel_calculator(dfx, calcs=calcs, cids=cids)
dfx = msm.update_df(dfx, dfa)
Model pipeline #
mods_cls = {
    "logreg": FIExtractor(LogisticRegression()),
    "rf": FIExtractor(
            RandomForestClassifier(
                max_features=0.3,  # Default suggested in Breiman's original paper
                min_samples_leaf=1,  # Default suggested in Breiman's original paper for classification
                n_estimators=500,  # Default suggested in Breiman's original paper
                monotonic_cst=[1, 1, 1, 1, 1, 1, 1, 1],
                random_state=42,
            ),
        ),
}

grids_cls = {
    "logreg": {
        "estimator__fit_intercept": [True, False],
    },
    "rf": {
        "estimator__max_samples": [0.1, 0.5]
    }
}
xcatx = macroz + ["DU05YXR_VT10"]
cidx = cids_dux

so_cls = msl.SignalOptimizer(
    df=dfx,
    xcats=xcatx,
    cids=cidx,
    blacklist=fxblack,
    freq="M",
    lag=1,
    xcat_aggs=["last", "sum"],
    generate_labels=lambda x: 1 if x >= 0 else -1,
)

so_cls.calculate_predictions(
    name="MACRO_OPTCLASS",
    models=mods_cls,
    hyperparameters=grids_cls,
    scorers=scorer_cls,
    inner_splitters=splitter,
    search_type="grid",
    normalize_fold_results=False,
    cv_summary=cv_summary,
    min_cids=min_cids,
    min_periods=min_periods,
    test_size=test_size_rf,
    n_jobs_outer=-1,
)

dfa = so_cls.get_optimized_signals()
dfx = msm.update_df(dfx, dfa)
# Get optimized signals and view models heatmap
dfa = so_cls.get_optimized_signals()
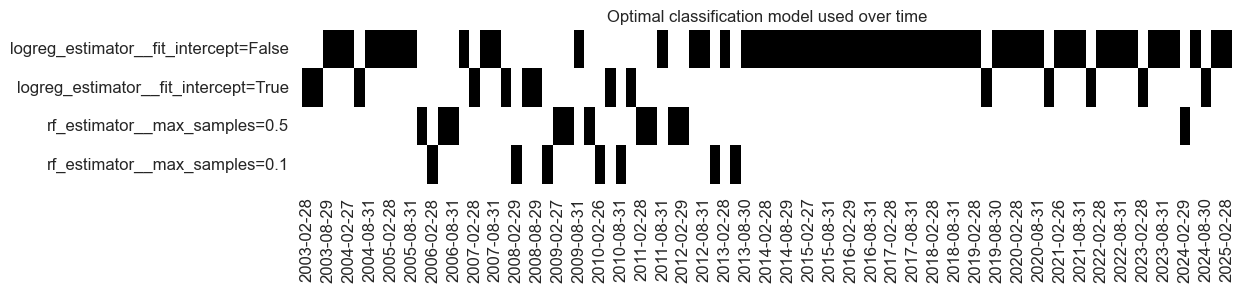
so_cls.models_heatmap(
name="MACRO_OPTCLASS",
cap=6,
title="Optimal classification model used over time",
figsize=(12, 2),
)
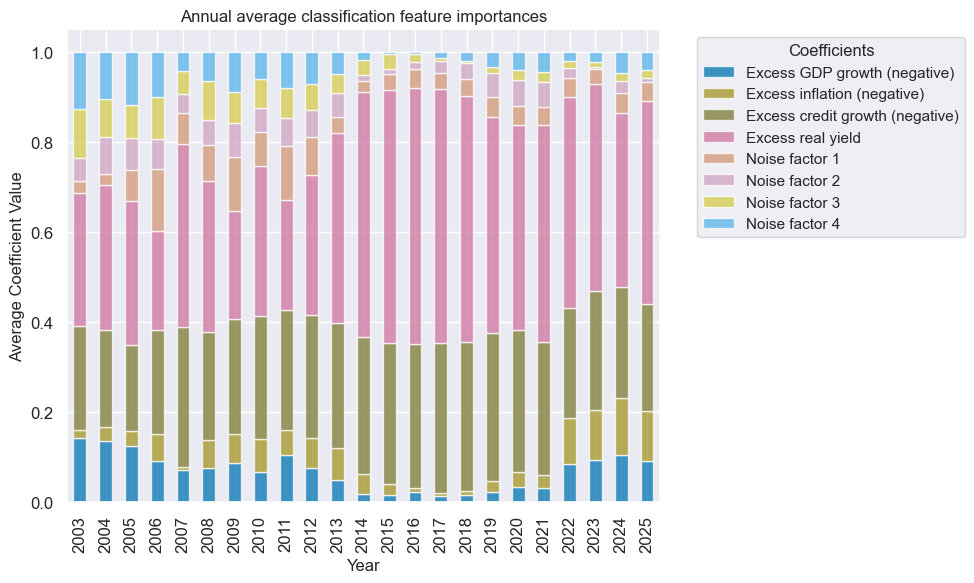
so_cls.coefs_stackedbarplot(name="MACRO_OPTCLASS", ftrs_renamed=ftrs_renamed, title = "Annual average classification feature importances")
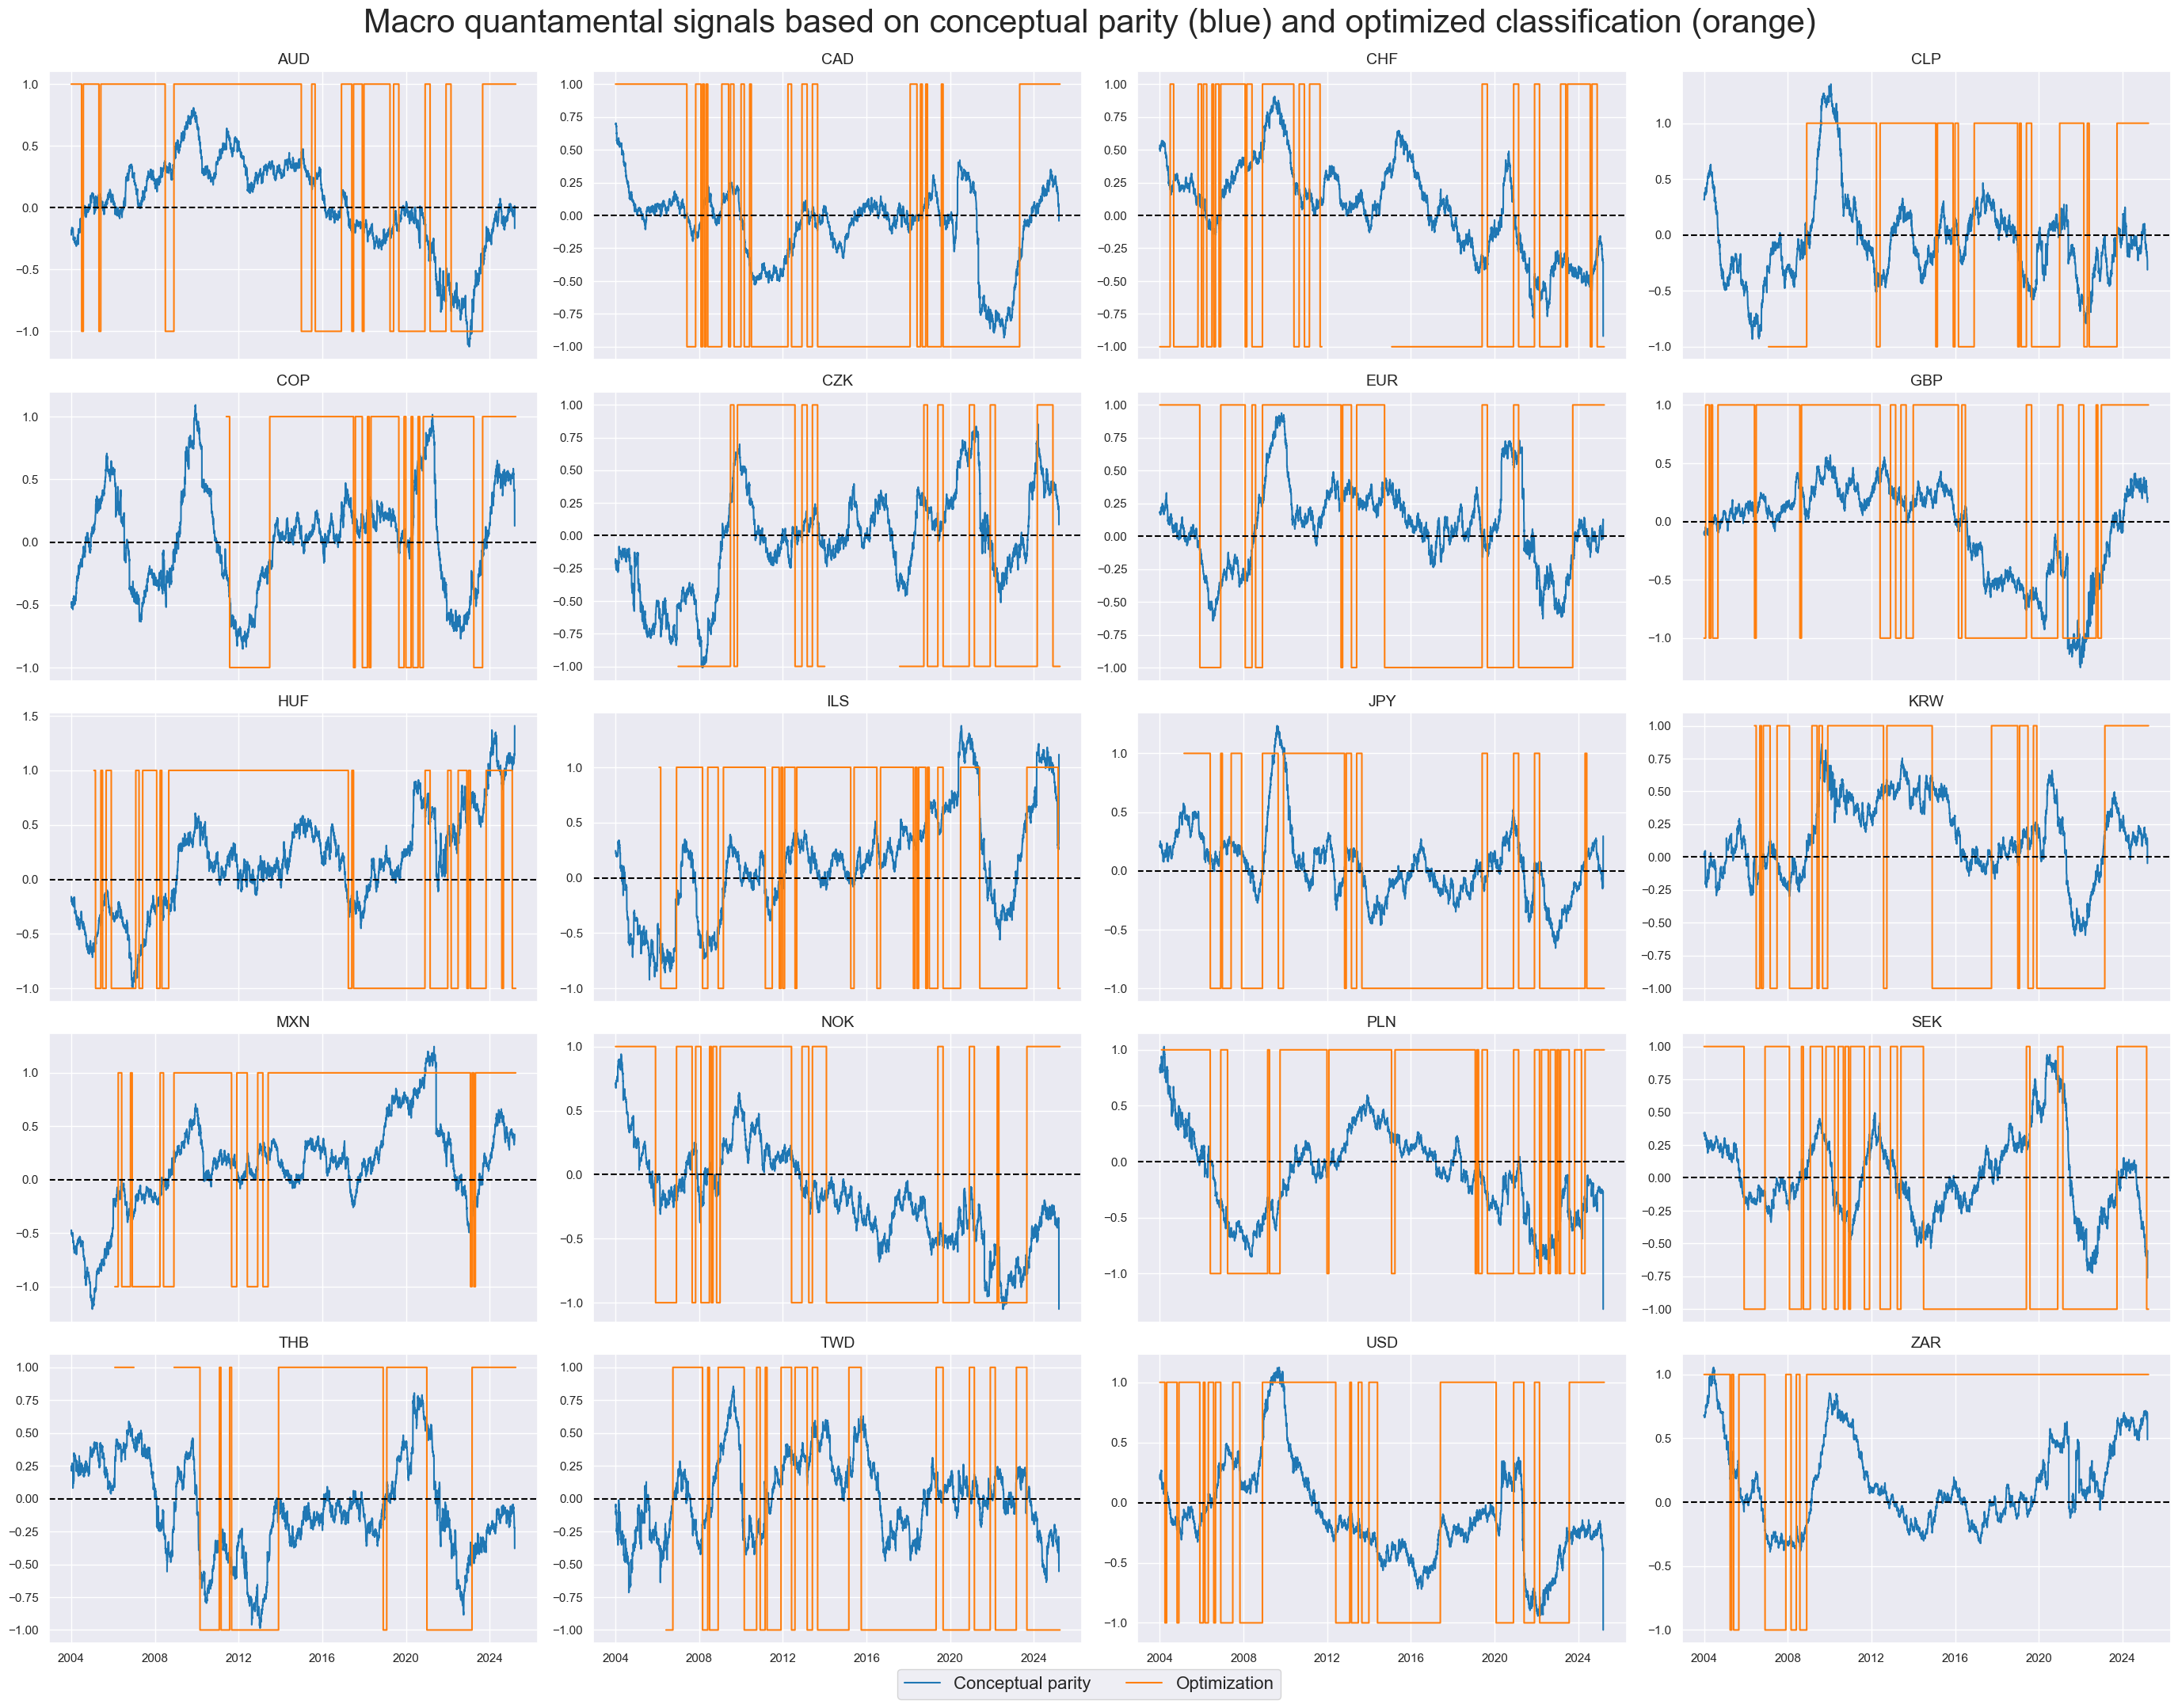
xcatx = ["MACRO_AVGZ", "MACRO_OPTCLASS"]

msp.view_timelines(
    dfx,
    xcats=xcatx,
    cids=cids_dux,
    ncol=4,
    start="2004-01-01",
    title="Macro quantamental signals based on conceptual parity (blue) and optimized classification (orange)",
    title_fontsize=30,
    same_y=False,
    cs_mean=False,
    xcat_labels=["Conceptual parity", "Optimization"],
    legend_fontsize=16,
)
Value checks #
## Compare optimized signals with simple average z-scores

srr = mss.SignalReturnRelations(
    df=dfx,
    rets=["DU05YXR_VT10"],
    sigs=["MACRO_AVGZ", "MACRO_OPTCLASS"],
    cosp=True,
    freqs=["M"],
    agg_sigs=["last"],
    start="2004-01-01",
    blacklist=fxblack,
    slip=1,
)

tbl_srr = srr.signals_table()
display(tbl_srr.astype("float").round(3))
| accuracy | bal_accuracy | pos_sigr | pos_retr | pos_prec | neg_prec | pearson | pearson_pval | kendall | kendall_pval | auc | ||||
|---|---|---|---|---|---|---|---|---|---|---|---|---|---|---|
| Return | Signal | Frequency | Aggregation | |||||||||||
| DU05YXR_VT10 | MACRO_AVGZ | M | last | 0.522 | 0.519 | 0.543 | 0.537 | 0.555 | 0.484 | 0.055 | 0.0 | 0.043 | 0.0 | 0.519 |
| MACRO_OPTCLASS | M | last | 0.538 | 0.533 | 0.570 | 0.537 | 0.566 | 0.501 | 0.068 | 0.0 | 0.059 | 0.0 | 0.533 |
sigs = ["MACRO_AVGZ", "MACRO_OPTCLASS"]
pnl = msn.NaivePnL(
df=dfx,
ret="DU05YXR_VT10",
sigs=sigs,
cids=cids_dux,
start="2004-01-01",
blacklist=fxblack,
)
for sig in sigs:
pnl.make_pnl(
sig=sig,
sig_op="binary",
rebal_freq="monthly",
neutral="zero",
rebal_slip=1,
vol_scale = 10
)
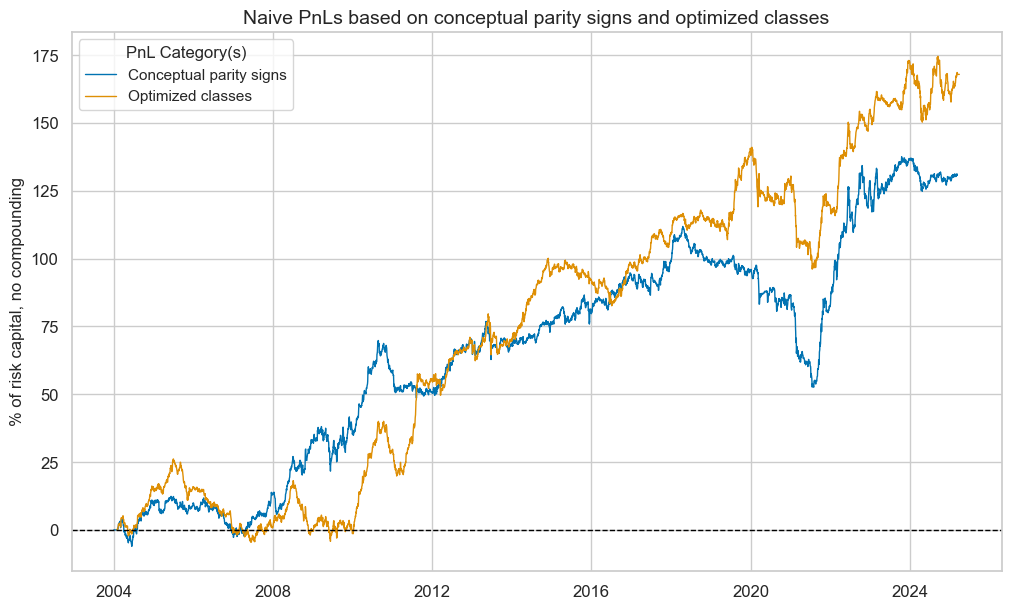
pnl.plot_pnls(
title="Naive PnLs based on conceptual parity signs and optimized classes",
title_fontsize=14,
xcat_labels=["Conceptual parity signs", "Optimized classes"],
)
pcats = ["PNL_" + sig for sig in sigs]
pnl.evaluate_pnls(pnl_cats=pcats)
| xcat | PNL_MACRO_AVGZ | PNL_MACRO_OPTCLASS |
|---|---|---|
| Return % | 6.172003 | 7.935446 |
| St. Dev. % | 10.0 | 10.0 |
| Sharpe Ratio | 0.6172 | 0.793545 |
| Sortino Ratio | 0.874241 | 1.151647 |
| Max 21-Day Draw % | -18.562526 | -22.850093 |
| Max 6-Month Draw % | -30.613791 | -31.007836 |
| Peak to Trough Draw % | -59.247687 | -44.891991 |
| Top 5% Monthly PnL Share | 0.916241 | 0.769737 |
| Traded Months | 255 | 255 |
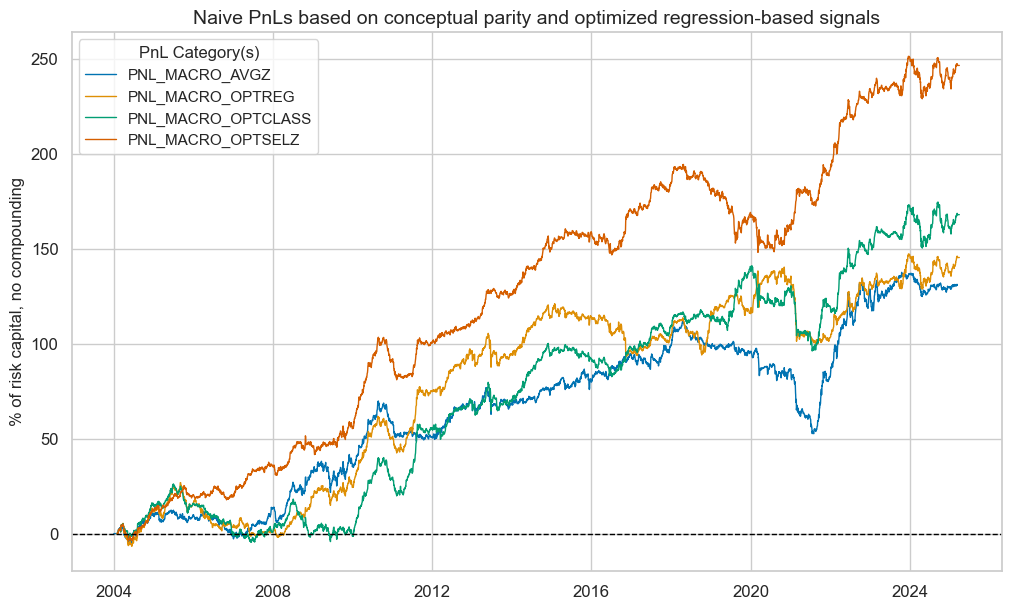
Signal comparison #
sigs = ["MACRO_AVGZ", "MACRO_OPTREG", "MACRO_OPTCLASS", "MACRO_OPTSELZ"]


pnl = msn.NaivePnL(
    df=dfx,
    ret="DU05YXR_VT10",
    sigs=sigs,
    cids=cids_dux,
    start="2004-01-01",
    blacklist=fxblack,
    bms="USD_GB10YXR_NSA",
)
for sig in sigs:
    pnl.make_pnl(
        sig=sig,
        sig_op="binary",
        rebal_freq="monthly",
        neutral="zero",
        rebal_slip=1,
        vol_scale=10,
        thresh=3,
    )

pnl.plot_pnls(
    title="Naive PnLs based on conceptual parity and optimized regression-based signals",
    title_fontsize=14,
    #xcat_labels=["Conceptual parity signal", "Optimized signal"],
)
pcats = ["PNL_" + sig for sig in sigs]