Home » Macro Quantamental Academy » What Are Macro Quantamental Indicators?
Macro quantamental indicators are time series of macroeconomic information states designed for the development and backtesting of financial markets trading strategies. They are the building blocks for the macro-quantamental technology, i.e., investment strategies based on the systematic use of macroeconomic information.
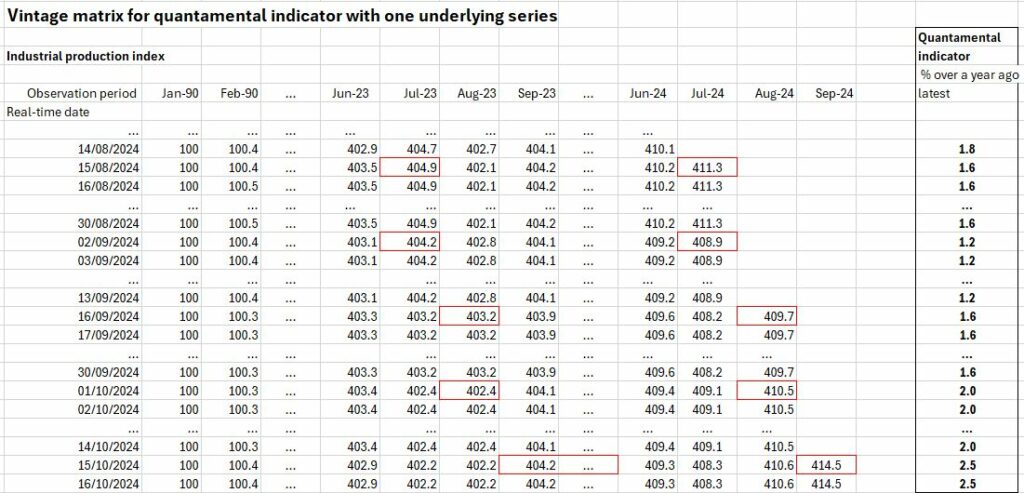
Example: Standard economic time series of production trends versus quantamental series
Example: Explanatory power of standard economic versus quantamental series
The key source of macro quantamental information for institutional investors is the J.P. Morgan Macrosynergy Quantamental System or JPMaQS. It is a service that makes it easy to use quantitative-fundamental (“quantamental”) information for financial market trading. With JPMaQS, users can access a wide range of relevant macro quantamental data that are designed for algorithmic strategies, as well as for backtesting macro trading principles in general.
The official documentation site of JPMaQS on J.P. Morgan Markets can be found here.
Macro-quantamental indicators and trading signals are transformative technologies for asset management. That is because they allow plugging point-in-time fundamental economic information into systematic trading, backtesting, and statistical learning pipelines and remove an important barrier to information efficiency. While the predictive power of macro information for asset returns has been evident for decades, its use in systematic trading and research has remained rare. This disconnect reflects the historical difficulties of replicating past data and analyses point-in-time and the need for expert curation of data updates going forward.
This post is a condensed guide on best practices for developing systematic macro trading strategies with links to related resources. The focus is on delivering proofs of strategy concepts that use direct information on the macroeconomy. The critical steps of the process are (1) downloading appropriate time series data panels of macro information and target returns, (2) transforming macro information states into panels of factors, (3) combining factors into a single type of signal per traded contract, and (4) evaluating the quality of the signals in various ways.
Quantamental economic surprises are point-in-time measures of deviations of economic indicators from expected values. There are two types of surprises: first-print events and pure revisions. First-print events feature new observation periods, and the surprise element depends on market expectations of the indicator. Market surveys can approximate such expectations, but only for a limited number of indicators. Quantamental surprises use econometric prediction models and can be calculated for all indicators and transformations, principally using the whole information state.
Quantamental data increase trading profits in two simple ways. First, they greatly enhance the feature space of macro trading factors. Second, they drastically reduce costs and development time of proprietary trading strategies with fundamental macro content.
The economic value of enhancing portfolio management through macro-quantamental trading factors at low cost is significant. Macrosynergy has demonstrated the predictive power and stylized PnL value of a range of plausible signals (see detailed analysis here). Notably, the correlation between conceptually distinct macro-quantamental strategies has remained low over the past decades, owing to the differences in signals and the broad range of asset classes and contracts that can be traded with such signals.
The correlation heatmap below illustrates this point for all 19 macro-quantamental strategies available on the Macrosynergy Academy as of the end of August 2024, covering fixed income, equity, FX, credit, and commodities (excluding cross-asset strategies). The average Pearson correlation has been 4%, with only one strategy pair exceeding a 50% correlation. Due to this diversification, a simple equally weighted average of these strategies, weighted by past volatility and rebalanced monthly, would have generated a high-Sharpe PnL with minimal seasonality and modest correlation to market benchmarks.
Macro quantamental indicators simply align measurements of economic events with their lifespan as the latest available information of its type. For instance, measurements of economic flows for a given month are associated with the time span from their release date up to but not including the date they become obsolete, due maybe to a revision or newly released month. This means that quantamental indicators always represent the knowledge of a fully-informed investor with respect to the concept, recorded on a timeline of real-time dates, although not everyone may use the information at the real-time date.
The real-time date principle implies that quantamental indicators are principally based on a two-dimensional data set.
For any given real-time date, an indicator is calculated based on the full information state, typically a time series that may be based on other time series and estimates that would be available at or before the real-time date. This information state-contingent time series is called a data vintage.
The two-dimensional structure of the data means that unlike regular time series quantamental indicators convey information on two types of changes: changes in reported values and reported changes in values. The time series of the quantamental indicator itself shows changes in reports arising from updates in the market’s information state. By contrast, quantamental indicators of changes are reported dynamics based on the latest information state alone.
This implies that a transformation (such as % change) of a quantamental indicator is not the same as a quantamental indicator of a transformation. The former operates on the first dimension (real-time dates), while the latter operates on the second dimension (observation dates).
A data vintage is an instance of a complete available time series associated with a real-time period. Conceptually, vintages are complete past states of information or “time series of time series”. They come about through data revision, data extension, and re-estimation of the parameters of the underlying model. Vintages allow replicating what markets knew at any day in recent history, which is critical for backtesting algorithmic strategies. Disregarding vintages leads to survivorship and look-ahead biases in evaluating trading ideas.
An inconvenient truth
Conceptually, all JPMaQS indicators are based on vintages, i.e., estimates of time series as they were available on the date of their timestamp. If all information was pristine, generated by use of a “time-machine” that allowed to go back to each day and check what market participants found on their databases, the history of indicators should never change.
However, in practice, indicators and underlying vintages do change, sometimes even market-related data. This is inconvenient insofar as analyses based on these indicators change as well. Typically, these changes are tiny. However, changing backtests are principally disconcerting, and actual live trading decisions may need to be reviewed if changes are material.
Why point-in-time data evolve
Changes in past data vintages occur for three basic reasons:
How JPMaQS manages vintage evolution
Transparency
Preparation
A system tool helps trace the impact of changes in calculation specifications or methodology at the (original) series level onto the final indicators that would be impacted. This helps generate the list of impacted indicators for client notification.
Checks
Records
The JPMaQS data warehouse contains three capabilities to maintain data/metadata about changes in values. These trace the changes from the very first value for an observation to the latest value with timestamps of all the updates.
Macrosynergy is a London based macroeconomic research and technology company whose founders have developed and employed macro quantamental investment strategies in liquid, tradable asset classes, across many markets and for a variety of different factors to generate competitive, uncorrelated investment returns for institutional investors for two decades. Our quantitative-fundamental (quantamental) computing system tracks a broad range of real-time macroeconomic trends in developed and emerging countries, transforming them into macro systematic quantamental investment strategies. In June 2020 Macrosynergy and J.P. Morgan started a collaboration to scale the quantamental system and to popularize tradable economics across financial markets.